Hotel Insights Q2 2021 - Valuation & Advisory Services | Asia - APREA Asia
←
→
Page content transcription
If your browser does not render page correctly, please read the page content below
Valuation & Advisory Services | Asia

Hotel Insights
Q2 2021
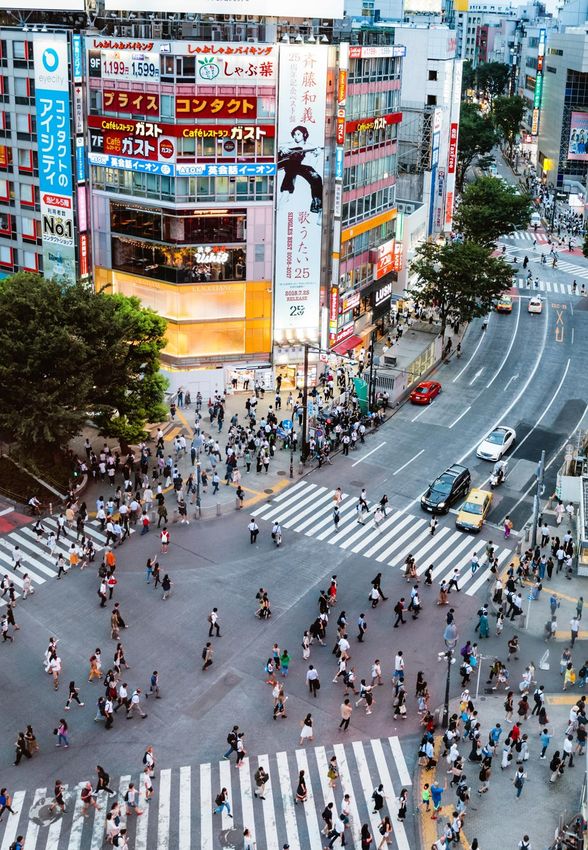
In this publication, we offer insights and
recommendations to investors and hoteliers
on investing across Asia Pacific in 2021 and
beyond and discuss the state of the hotel
industry in Sydney and Japan, respectively.
The publication concludes with an update on
the cruise industry.

In summary:
Why invest in hotels? – History tells of a rebound in
operating metrics and recovery in values. Hotels remain
attractive given their risk premium and locations,
allowing for both yield and capital appreciation. In Asia,
particularly, tourism and spend remain in a growth
phase and continue to present opportunities for
investors.
Sydney – In the near term, we expect the city to benefit
from domestic tourism with significant upside when
international travel returns. It remains an attractive
destination for investment.
Japan – We expect hotels in Japan to remain attractive to
investors, with the outlook remaining positive and pricing
firm in the medium term. We expect a return to pre-
COVID-19 levels by 2024 in terms of performance, with
pricing returning to attractive levels. As such, the sector
presents a good opportunity for investors to benefit
from a post-COVID-19 rebound.
Cruise – This has been one of the most hard-hit but
fastest recovering sectors. This is underpinned by the
sector's agility in adapting and tapping into significant
pent-up demand for travel.
Investment – Transactions remain at historically low
levels as the bid/ask gap remains significant. Owners,
supported by banks and government support, and with
less leverage, are prepared to hold rather than sell at a
discount. Distressed remains out of reach for many
buyers now and we do not expect this to change in the
near term. As replacement cost remains lower than
price, investors will continue to accept development risk.

                                                              3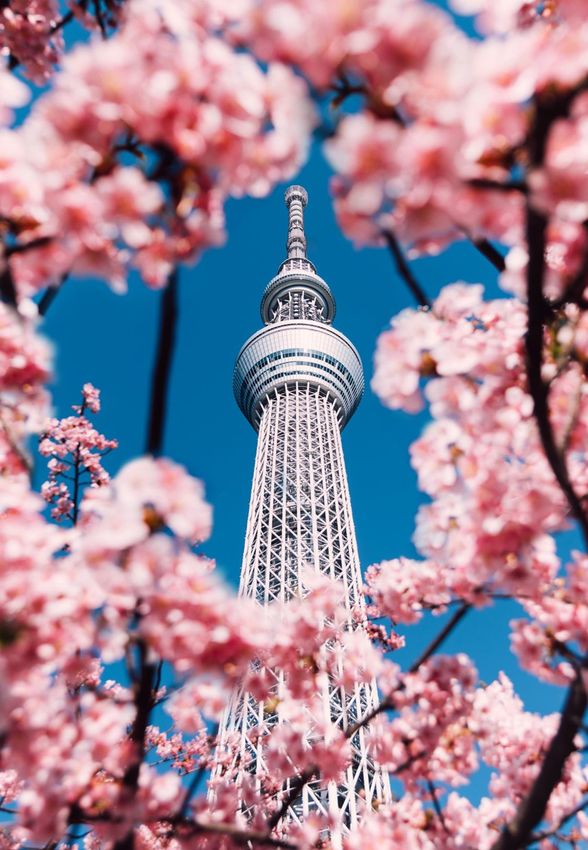
Introduction
                               W om o h Q2 2021 d o of Co                   ’
                               Hotel Insights, our quarterly report for leisure,
This edition includes:         hotel and other accommodation stakeholders
                               across Asia Pacific.
• Why invest in hotels?;       Over recent weeks, governments across the
                               world have stepped up efforts in rolling out
• Hotel market in Sydney;      vaccines. The anticipation is that, at least in
                               more developed countries, vaccinations of the
• Hotel market in Japan; and   mass population will occur by this summer. In
                               our opinion, any return to travel will ultimately
• Update on Cruise sector.
                               depend on the successful rollout of the
  Image placeholder            vaccine in the US, Europe and, to some
                               degree, China, i.e., the key source markets for
                               many destinations across Asia Pacific.
                               As COVID-19 containment measures are slowly
                               eased, at least domestically, hotels across Asia
                               Pacific witnessed a rebound in performance at
                               the end of Q1 2021. Overall room occupancy
                               increased to 42.7% but average daily rate
                               (ADR) decreased to US$78.04, year-to-date in
                               March. Consequently, Revenue Per Available
                               Room (RevPAR) for the region declined by
                               some 17.6% year-on-year, but with positive
                               improvement from Q4 2020.
                               In terms of room occupancy, most markets
                               witnessed year-on-year declines, but hotels in
                               Greater China recorded strong recoveries
                               according to STR. In local currency terms,
                               Beijing, Shanghai, Sanya, and Taipei all
                               recorded ADR increase when compared to
                               2020.
                               Looking ahead, the global economic outlook
                               continues to improve, with a cautious return
                               to travel underpinned by a rebound in
                               domestic demand. As the vaccination rollout
                               gathers pace and more green lanes/bubbles
                               open, we expect a rapid recovery led by pent-
                               up leisure demand, followed by business.

                                                                                   4
Hotels opinion
The case for investing in hotels The motivation for each scenario is distinct
across Asia Pacific and so are the potential returns.
As the world prepares to open and more We expect hotels across APAC to continue to
funds are allocated to hotels, it is important to attract capital as the hunt for yield continues.
consider the case for this and whether the Hotels typically do offer higher returns
sector warrants this attention as it marches (premium) to traditional asset classes such as
into contention for capital deployment office and industrial, reflecting the dynamic
with other traditional asset classes. risk profile of the sector. However, we do note
that as investors become more sophisticated
Investment in hotels is generally for three in the sector, this premium, especially for
main reasons: prime assets, continues to diminish.
• Yield/return – investment is mainly in Transaction data demonstrates that the sector
upscale and below by private equity funds remains resilient and rebounds within three to
and usually follows a cycle four years of a fall out. Yields, whilst relatively
• Capital appreciation – investment is mainly low currently, reflect capital values growth
in the upper upscale and above by family outpacing income (no surprise given the
offices and sovereign wealth, with long hold current situation), but this will increase to
in mind historic levels as performance improves. For
those looking to invest, depending on
• Worth – investment in trophy assets by motivation, most gateway and regional cities
ultra-high-net-worth individuals with little across APAC continue to be attractive.
or no desire to exit
Asia Pac Cap Rates – Hotels vs Office, Retail & Industrial
Asia Pacific Office Cap Rate Asia Pacific Industrial Cap Rate
9%
6%
3%
Mar 09
Mar 10
Mar 11
Mar 12
Mar 08
Mar 13
Mar 14
Mar 15
Mar 16
Mar 17
Mar 18
Mar 19
Mar 20
Mar 21
Sep 09
Sep 10
Sep 11
Sep 12
Sep 08
Sep 13
Sep 14
Sep 15
Sep 16
Sep 17
Sep 18
Sep 19
Sep 20
Asia Pac Hotel Price (US$/Room)
500,000
400,000
300,000
200,000
100,000
0
Mar 09
Mar 08
Mar 10
Mar 11
Mar 12
Mar 13
Mar 14
Mar 15
Mar 16
Mar 17
Mar 18
Mar 19
Mar 20
Mar 21
Sep 08
Sep 09
Sep 10
Sep 11
Sep 12
Sep 13
Sep 14
Sep 15
Sep 16
Sep 17
Sep 18
Sep 19
Sep 20
5
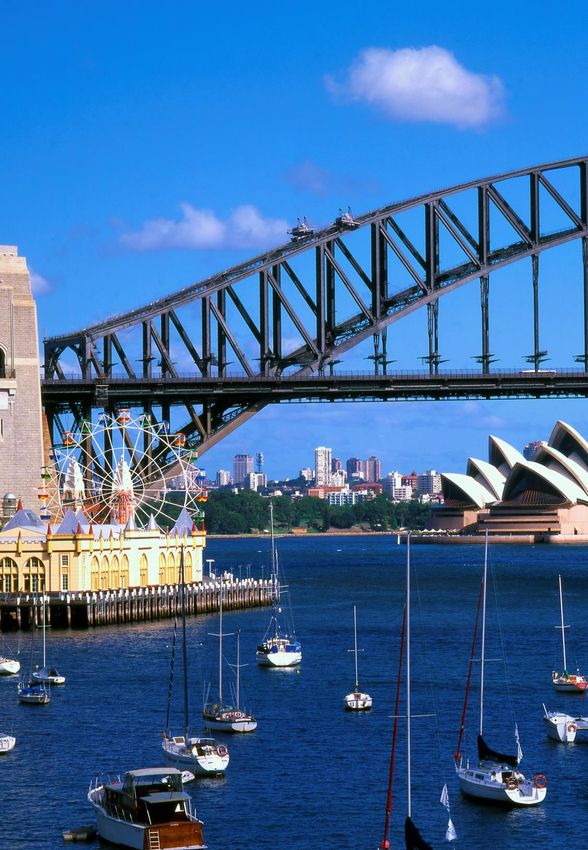
Sydney
  Destination of the quarter

 Sydney City, the capital city of New South
   Wales in Australia, was one of the most
    affected accommodation markets in
 Australia in 2020, behind only Melbourne
City in terms of Revenue per Available Room
   (RevPAR) declines. This was due to the
extensive lockdown measures put in place to
        stop the spread of COVID-19.

                                              6
The data below is sourced from the National and International
Visitors Surveys by Tourism Research Australia and shows the
trends in visitation to Sydney over the past four years and
highlights the significant drop in visitors in 2020 (36% decline in
domestic visitor nights, and a 53% decline in International
visitor nights).

Sydney tourism region visitation 2017 to 2020

                               YE Sept YE Sept YE Sept YE Sept               YoY Chg (YE
 Sydney overall
                                  2017    2018    2019    2020                Sept 19-20)

 Dom                 (000’ )

 Daytrip visitors                 20,383   21,951    26,097       21,099               -19%

 Overnight visitors                9,760   10,673    12,348         7,358              -40%

 Visitor Nights                   27,031   28,560    33,572       21,574               -36%

 I               o      (000’ )

 Overnight visitors                3,880    4,059      4,110        1,933          -53.00%

 Visitor nights                   79,190   80,926    83,061       38,917           -53.10%

Source: Colliers; National Visitors Survey; International Vistors Survey Tourism Research
Australia

Sydney Airport, prior to the effects of COVID-19, w                                         ’
primary international gateway and the busiest airport in
Australia.
In 2019, the airport handled 44.4 million passenger movements,
of which 16.9 million were international passengers.
Passenger movements through Sydney Airport, along with all
airports across Australia, recorded significantly lower passenger
movements in 2020. However, due to COVID-19 and the related
travel restrictions, passenger movements in total for 2020 were
just 11.2 million.

Sydney airport passenger movements

                                   Domestic & Regional        International          Total
              50,000,000

              40,000,000
 Passengers

              30,000,000

              20,000,000

              10,000,000

                         0
                               2001
                               2002
                               2003
                               2004
                               2005
                               2006
                               2007
                               2008
                               2009
                               2010
                               2011
                               2012
                               2013
                               2014
                               2015
                               2016
                               2017
                               2018
                               2019
                               2020

                                                                                                7
Sydney City Hotel Performance
Prior to the effects of COVID-19, demand for       uplift in 2018, but experienced a decline of 3% in
hotels in Sydney City came from a wide variety     2019 with ARR recording A$252.55 by year end.
of sources, from both domestic and                 The resultant RevPAR in 2019 was A$215.74.
international leisure guests; corporate,
                                                   The results for the full 2020 year were
conference and events demand; as well as
                                                   significantly down in comparison to the same
from those people visiting friends and
                                                   period of 2019 as the restrictions on travel due to
relatives (VFR).
                                                   COVID-19 were realised. Occupancy levels were
The demand profile for hotels in 2020,             at a historical low of 43% and average room rates
however, was different, with demand                down by 20% to A$198.59. This resulted in
predominantly from those undertaking the           RevPAR declines of over 60% for the year and
mandatory quarantine period in hotels and a        recording RevPAR of A$86.49 for the full year.
small proportion of intrastate leisure demand.
                                                   The first three months of 2021 were significantly
This demand profile is unlikely to change until
                                                   down from the same period in 2020 as the
international borders reopen and people can
                                                   effects of COVID-19 did not take hold until March
start to gather more readily in groups for
                                                   last year, so the first two months of 2020 were
events and larger conferences.
                                                   considered to be at normal levels.
In 2019, the accommodation properties in
                                                   In the month of March 2021, Sydney City hotels
Sydney City achieved year-round occupancy
                                                   recorded a higher occupancy compared to March
levels of 85.4%. Occupancy levels have
                                                   2020, where occupancy levels were 48.8%,
decreased slightly year-on-year since 2018.
                                                   compared to 47% in March 2020. This may signal
Average room rates (ARR) experienced a 0.6%
                                                   that the market is starting to recover.

Sydney City – March 2016 to March 2021 Monthly Hotel Performance

                                         ADR ($)    Occupancy (%)
       $320                                                                                100%
       $300                                                                                90%
       $280                                                                                80%
       $260
                                                                                           70%
       $240
                                                                                           60%
                                                                                                  Occupancy

       $220
 ADR

                                                                                           50%
       $200
                                                                                           40%
       $180
                                                                                           30%
       $160
       $140                                                                                20%

       $120                                                                                10%

       $100                                                                                0%
              Nov-16

              Nov-17

              Nov-18

              Nov-19

              Nov-20
              May-16
                Jul-16
              Sep-16

              May-17
                Jul-17
              Sep-17

              May-18
                Jul-18
              Sep-18

              May-19
                Jul-19
              Sep-19

              May-20
                Jul-20
              Sep-20
              Mar-16

               Jan-17
              Mar-17

               Jan-18
              Mar-18

               Jan-19
              Mar-19

               Jan-20
              Mar-20

               Jan-21
              Mar-21

Source: STR

                                                                                                          8
Concluding comments
                                                  In 2019, Sydney City hotels performed at high
                                                  levels, recording year-round occupancy levels
                                                  of 85.4%, the highest of all capital cities across
                                                  Australia.
New and Proposed Hotel Supply in
Sydney City                                       In 2020, however, in line with the rest of
                                                  Australia, the performance was
Sydney City currently has seven hotels under
                                                  unprecedentedly affected by COVID-19, with
construction totalling over 1,416 new rooms
                                                  hotels operating at half the occupancy levels
(four hotels of which are due to open in 2021).
                                                  of h p v o y         ’ f
This is in a current market of 152 hotels with
approximately 24,000 rooms. Hotel projects        Recent hotel performance figures for March
under construction, for example, include the      2021 do show some improvement and as
Aiden Darling Harbour, Ibis Budget Sydney         interstate travel builds, this performance is
and W Hotel & Apartments at Darling               anticipated to improve over the course of the
Harbour, which are all going ahead; however,      year. The absence of any real international
feasibility of any project not yet under          visitation to Sydney, however, will hinder
construction is anticipated to be strained.       overall performance improvements.

                                                                                                       9
Japan
  Destination of the quarter

In our latest analysis of conditions in the 23
   wards of Tokyo, Kyoto City, Osaka City,
     Fukuoka City and Sapporo City, we
    understand that the room rate and the
 occupancy index both fell in February 2020
at both inner-city hotels and business hotels
  due to the effects of COVID-19, reaching a
       trough period in May and June.
   However, with the lifting of the second
emergency declaration, the implementation
   of the “Go To” Travel campaign, other
public policies that were advantageous to the
 accommodation market, and initiatives by
    travel agencies to pivot towards micro
tourism, the occupancy index improved and
   trended upwards toward recovery until
                 October 2020.

                                                 10
Business conditions at hotels
After dropping to around 5% to 20% in all cities, the occupancy
index recovered to around 49% in October 2020. However, as
occupancy picked up to circa 55% in November 2020, there was
a surge in COVID-19 cases, particularly in the Greater Tokyo
area (Tokyo and 3 prefectures), Osaka City and Sapporo City,
fo ow pp fo h “Go To” T v mp ob
reviewed and for the operating hours of eating and drinking
establishments to be shortened. As at March 2021, we note that
room occupancy has slipped back to approximately 32%, as the
Japanese government has declared its third state of emergency
with new restrictions imposed in Tokyo, Osaka, Kyoto and
Hyogo prefectures.
Tokyo room occupancy (2018 – 2021 YTD March)
2018 2019 2020 2021
100%
75%
50%
25%
0%
Jan Feb Mar Apr May Jun Jul Aug Sep Oct Nov Dec
Source: STR
In contrast, although room rates are down from the previous
year, both inner city hotels and business hotels maintained
their room rates at almost constant levels from February 2020
through March 2021. The magnitude of the downturn in the
occupancy index likely had some effect on the room rate;
however, it is noted that if the room rate can be maintained
regardless of the occupancy index, the recovery period for the
room rate will likely be shorter when the accommodation
market enters a recovery phase.
Previously in 2018 and 2019, hotel room occupancy was at the
75% and above range. However, at the onset of COVID-19, the
Japanese government soon declared a state of emergency in
March, following a strict travel ban for visitors from 73 countries
in April last year. This led to a significant drop in room
occupancy to 33% in March and to 14% in April last year – the
lowest in record for the city since 1996. Japanese hotel
developers and operators had been relying on a surge in
demand for accommodation in the run-up to the Tokyo 2020
Olympic Games, ramping up construction projects. However,
11the spread of COVID-19 has derailed business occupancy. In May 2020, average room rate in
hopes, while the Games have been postponed Tokyo was recorded at a low of ¥8,213, a
for a year. Nevertheless, occupancy picked up decline of circa 46% when compared to the
from May till November, with the recovery p vo y ’ f Th w m y
underpinned by tourism demand buoyed by attributed to a fall in room rates from business
factors such as the lifting of the emergency hotels, due to the strict travel bans imposed
d o o M y 25 d h “Go To” by the government to curb the spread of the
Campaign that started on July 22 created to virus. Nonetheless, we note that average room
incentivise domestic travel. rates have rebounded from June till the end of
2020, as it closes the gap with room rates
Due to the second wave of COVID-19 cases in
registered in 2019.
November 2020, hotel occupancy experienced
a dip in the following months to 25% in In 2021, we note that average room rates have
January 2021. As at March 2021, despite the once again dropped to the ¥9,500 to ¥10,500
third state of emergency issued by the range over the first three months of the year.
Japanese government in four prefectures This was a decrease of approximately 25% to
including Tokyo, room occupancy in the city is 31.5% from ¥13,885 recorded in November
trending upwards. This was put in place so as 2020, the highest room rate achieved last year.
to reduce the flow of people during Golden
The reduction in room rates is a result of the
Week, an array of holidays marked by significant
third wave of surging COVID-19 cases in Tokyo,
travel around the country and abroad.
as the government urged people over 65 and
On the other hand, despite the effects of those with pre-existing health conditions to
COVID-19, hotel room rates in Tokyo have held f f om h “Go To” v d “Go
up relatively well compared to room To” ov m d o
Tokyo Hotel Room Rates (2018 - 2021 YTD March)
2018 2019 2020 2021
¥18,000
¥16,000
¥14,000
¥12,000
¥10,000
¥8,000
¥6,000
¥4,000
¥2,000
¥0
Jan Feb Mar Apr May Jun Jul Aug Sep Oct Nov Dec
Source: STR
12Nevertheless, we note that Ryokan
accommodation in tourist destinations that
have achieved performance levels close to the
results posted in the previous year are small
scale establishments priced around ¥20,000 to after past natural disasters, economic
¥40,000 that have good online reviews and recessions, etc., it is surmised that it will take
have implemented COVID-19 measures across approximately two to three years for
the establishment, including their dining accommodation facilities to recover close to
rooms and reception areas. In addition, large the levels posted in 2019, with some variation
serviced apartments in central Tokyo were between hotel types and regions.
able to maintain room rates comparable with
It is possible that accommodation demand
the previous year.
from international visitors will recover after
Looking ahead beyond 2021, the immigration restrictions on sightseeing tours
accommodation market will be supported are relaxed and COVID-19 is resolved through
mostly by domestic demand, with little the provision of vaccines and various other
accommodation demand from international policy measures. However, considering that
visitors. It is also important to consider that for the movement of people in enclosed spaces
performance to recover, there will need to be such as in aircrafts will likely be restricted and
an upswing in 2021, with trends at newly changes in travel style will have an effect, it is
developed accommodation facilities and in the likely that the number of incoming
willingness to travel among potential international visitors will not recover to 30
travellers. Based on the performance recovery million annually until after domestic
period required by accommodation facilities accommodation demand has recovered.
13Hotel investment
Capital markets insights
Compared to other commercial real estate
classes in Asia Pacific, deals in the hospitality
industry remain few and far between, as the
hotel sector, unsurprisingly, continues to be the
weakest asset class for deal activity. Volume of
transactions over the last 12 months was
registered at US$7.5 billion, which was a 55%
decrease year-on-year. Since the start of 2020,
we note that circa US$1.5 billion of hotel deals
have fallen through. Nevertheless, hotel deals
have picked up slightly in Q1 2021 by 14.3% to
US$1.6 billion as compared to the last quarter.
The most liquid markets were China, Japan and
South Korea, while markets such as Malaysia and
Thailand saw little investment sales during the
quarter.
While COVID-19 has forced companies to
reassess the necessity of business travel, it still
appears to be the biggest lifeline for hotel
owners in the region. Investors have placed more
faith in hotels in urban areas, with transactions of
limited-service hotels still higher than 2017
levels. In addition, we note that some hotels have
managed to break even with the trickle of
business arrivals, while others have signed up as
quarantine facilities.
Although green lanes for business travel have
emerged, the development of travel bubbles has
been slow. And with government aid drying up,
deals in areas such as South Pacific and
Southeast Asia have been limited, with owners
adopting a wait-and-see approach given the
evolving COVID-19 situation.
14Asia hotel investment
Asia Hotel Quarterly Volume ($) Asia Hotel Cross-Border Volume ($)
6000
5000
4000
Millions (US$)
3000
2000
1000
0
Mar 07
Dec 07
Dec 19
Jun 09
Mar 10
Dec 10
Jun 12
Mar 13
Dec 13
Jun 15
Mar 16
Dec 16
Jun 18
Mar 19
Sep 08
Sep 11
Sep 14
Sep 17
Source: Real Capital Analytics Sep 20
Recent notable transactions
In this quarter, a considerable number of the transactions across Asia were
in gateway cities, where investors remained very active.
Value per
Hotel Location room (US$)
Ascott Guangzhou Guangzhou, China 577,104
Four Seasons and Capella Bangkok Bangkok 454,381
Hotel Indigo Hsinchu Science Park Hsinchu City, Taiwan 338,054
Byron Bay - Holiday Village Byron Bay, Australia 337,929
Minimal Hotel Midtown Hong Kong, SAR 298,640
Kinki-Tokai & Fukuoka portfolio of eight hotels Japan 245,423
Source: Colliers Research
Note: US$ conversions are at time of transaction and represent approx. values.
15Cruise
update
A note on the cruise
industry amidst the effects
of COVID-19
The cruise industry has faced its toughest
year in 2020, as COVID-19 brought the
global cruise industry to a standstill and
major cruise lines were forced to temporarily
suspend new sailings and repatriate
customers and crew around the world.
16In Asia, nearly all major cruises have been suspended since
March 2020 and have altered future bookings until COVID-19
eases. Beyond cruise suspensions, most ports in Asia have
banned any cruise ships that have been left at sea from
docking.
However, with pent-up demand for overseas travel, along with
an increasing number of vaccinated citizens across various
countries, the cruise sector in Asia has been picking up steam
over the last six months. In Singapore, for example, more than
120,000 people have set sail on cruises, with no COVID-19 cases
on board since a pilot programme to reboot the cruise industry
began last November. Due to the overwhelming demand for
h “ o owh ” , bo h Roy C bb d
Genting Cruise lines have recently extended sailing till October
2021. Beyond Singapore, Malaysia is also set to resume cruises
in May from Penang, with Star Cruises under Genting Cruise
Lines offering Langkawi and Malacca itineraries, as these
domestic sailings are expected to revitalise the travel agent
sector which has been adversely affected by COVID-19 and
provide employment opportunities for its citizens.
Meanwhile, we note that the Chinese government has approved
the restarting of cruise operations aboard the Piano Land, the
country's first domestically operated luxury cruise ship, with its
first sailing from Sanya. With the handover of Carnival
Co po o ’ S P ( ow m d Ch m ) o
new Chinese owners, Sanya International Cruise Development
Co., China is preparing to launch its second domestic cruise
operation with the newly acquired cruise ship in May 2021.
Currently, cruise operators are working alongside various
governments and local health and tourism authorities to ensure
that strict protocols and safe management measures are met,
with regular inspections conducted onboard to ensure
compliance.
In addition, as all passengers have to undergo COVID-19 tests
prior to cruise embarkation, some cruise operators have
absorbed the testing costs to assure the public that cruising
remains a value-for-money experience. This is particularly seen
in the Asian market, which has become a very important market
for cruise companies in recent years.
Recovery
We anticipate any recovery to continue to be directly linked to
the removal of quarantine restrictions in both source and
destination markets, as demand for cruises continues to ramp
up with the rollout of vaccines in Asia and around the world.
This will bode well for both home and destination ports, with
Asia poised to become the largest source market for cruises
globally over the next decade.
17About
Colliers Hotels
Whether you are a start-up or well-established We provide timely, relevant and forward-
owner, developer or investor, we will help you looking advice. This global division has
go through the business life cycle by providing exceptional relationships with investors
specialised, value-added advice that is tailored worldwide, required for the timely and
to your specific needs: ff v of
• Market and feasibility studies Our specialised sector expertise includes:
• Property and business valuation • Hotels and resorts
• Capital markets and investment services • Theme parks
• Internal business reviews • Travel trade
• Operator search and selection • Golf
• Due diligence • Spas and wellness facilities
• Transaction advisory, IPO and REITs listing • Casinos
• Management agreements and lease • Conference and convention centres
reviews (MICE venues)
• Extensions, refurbishments • Racecourses
• Benchmarking and forecasting • Sports stadiums
• Tourism strategy and master planning • Integrated and mixed-use
• Asset management • Destination consulting
• Needs analysis / economic impact studies
• Litigation support and dispute resolution
• Business restructuring – opco / propco
• Highest and best-use / concept designs
• Project management and leasing
18Next quarter
Opinion Destinations of
Branded residences the quarter
• Beijing
• Perth
Theme parks
update
19For further information, contact our Service Experts: Govinda Singh Executive Director | Valuation & Advisory Services | Asia +65 6531 8566 govinda.singh@colliers.com Christopher Milou Head of Hotels | Valuation & Advisory Services | Australia Hotels | Student Accommodation | Australia +61 2 9017 6919 christopher.milou@colliers.com Gus Moors Head of Hotels | Australia +61 2 9257 0369 gus.moors@colliers.com Shaman Chellaram Senior Director | Valuation & Advisory Services | Asia +852 2822 0646 shaman.chellaram@colliers.com Kazutaka Hinoshita Senior Director | Valuation & Advisory Services | Japan +81 3 4572 1024 kazutaka.hinoshita@colliers.com About Colliers Colliers (NASDAQ, TSX: CIGI) is a leading diversified professional services and investment management company. With operations in 67 countries, our more than 15,000 enterprising professionals work collaboratively to provide expert advice to real estate occupiers, owners and investors. For more than 25 years, our experienced leadership with significant insider ownership has delivered compound annual investment returns of almost 20% for shareholders. With annualized revenues of $3.0 billion ($3.3 billion including affiliates) and $40 billion of assets under management, we maximize the potential of property and accelerate the success of our clients and our people. Learn more at corporate.colliers.com, Twitter @Colliers or LinkedIn. Legal Disclaimer This document has been prepared by Colliers for advertising and general information only. Colliers makes no guarantees, representations or warranties of any kind, expressed or implied, regarding the information including, but not limited to, warranties of content, accuracy and reliability. Any interested party should undertake their own inquiries as to the accuracy of the information. Colliers excludes unequivocally all inferred or implied terms, conditions and warranties arising out of this document and excludes all liability for loss and damages arising there from. This publication is the copyrighted property of Colliers and /or its licensor(s). © 2021. All rights reserved. This communication is not intended to cause or induce breach of an existing listing agreement.
You can also read