DETERMINATION OF QUALITY CHARACTERISTICS, PHENOLIC COMPOUNDS AND ANTIOXIDANT ACTIVITY OF PROPOLIS FROM SOUTHEASTERN MEXICO - Sciendo
←
→
Page content transcription
If your browser does not render page correctly, please read the page content below
DOI: 10.2478/JAS-2021-0008 J. APIC. SCI. VOL. 65 NO. 1 2021
                                                        J. APIC. SCI. Vol. 65 No. 1 2021
    Original Article

DETERMINATION OF QUALITY CHARACTERISTICS, PHENOLIC
COMPOUNDS AND ANTIOXIDANT ACTIVITY OF PROPOLIS FROM
SOUTHEASTERN MEXICO
    Enrique Sauri-Duch1
    Cesia Gutiérrez-Canul2
    Luis F. Cuevas-Glory1
    Lorena Ramón-Canul3
    Emilio Pérez-Pacheco2
    Víctor M. Moo-Huchin1*
    1
     Tecnológico Nacional de México/IT de Mérida, Mérida, Yucatán, México
    2
     Tecnológico Nacional de México/ITS de Calkiní, Calkiní, Campeche, México
    3
     Universidad de la Sierra Sur, Miahuatlan de Porfirio Díaz, Oaxaca, México
    *corresponding author: vmmoo@yahoo.com
    Received: 12 May 2020; accepted: 30 December 2020

                                                    Abstract
            The objective of this work was to investigate the variability of physicochemical parameters,
            phenolic compounds and in vitro antioxidant activity of propolis collected from different
            apiaries in southeastern Mexico. A high variability was found in the moisture content (1.96-
            8.26%), ash (0.66-5.50%) and sensory characteristics of raw propolis from southeastern
            Mexico, but the raw propolis samples met the requirements of the quality regulations. In
            the same way, most of the ethanolic extracts also complied with the quality regulations.
            Of all the extracts, PE2 obtained from Santa Cruz showed the highest values for dry
            extract, content of total phenolic compounds (TPC), total flavonoids (TF) and antioxidant
            activity (DPPH and ABTS). The content of the individual phenolic compounds varied
            according to the geographical location of the apiary, but the PE2 extract resulted in the
            highest pinocembrin and chrysin content. A positive correlation was obtained between
            TPC and TF with antioxidant activity. Propolis extracts were classified into two groups
            through principal component analysis (PCA). These results indicate that the apiary
            location in southeastern Mexico influenced the characteristics of propolis.

            Keywords: antioxidant activity, phenolic compounds, propolis, quality

INTRODUCTION                                               industries and as a popular alternative medicine.
                                                           More than 300 chemical compounds have been
Propolis is made from resinous material                    reported in propolis made from different plant
of various plant species that bees (Apis                   species and residues, including phenolic acids
mellifera L.) collect and transport to the hive.           and their esters, flavonoids, terpenes, aromatic
It is processed to seal cracks and prevent the             aldehydes, alcohols, fatty acids, stilbenes, amino
entrance of invaders and pathogenic microor-               acids, lignans and sugars (Trusheva et al., 2011;
ganisms. Previous research has demonstrated                Piccinelli et al., 2013). The chemical composi-
that propolis possesses antibacterial, antifungal,         tion of propolis varies qualitatively and quan-
antiviral, anti-inflammatory, and anti-tumor               titatively due to the diversity of plant resins
properties. Furthermore, the high antioxidant              from which it is made in addition to the various
activity of propolis is attributed to the presence         geographic and climatic characteristics of its
of phenolic compounds, especially the flavonoid            place of harvest (Gardana et al., 2007; Reis et
group (Jerković et al., 2016). For these reasons,          al., 2019; Xu et al., 2019). Thus, its chemical com-
this natural product has gained scientific and             position varies according to its country of origin
commercial interest in the food and cosmetics              (Europe, China, Argentina and USA) or region (as

                                                                                                           109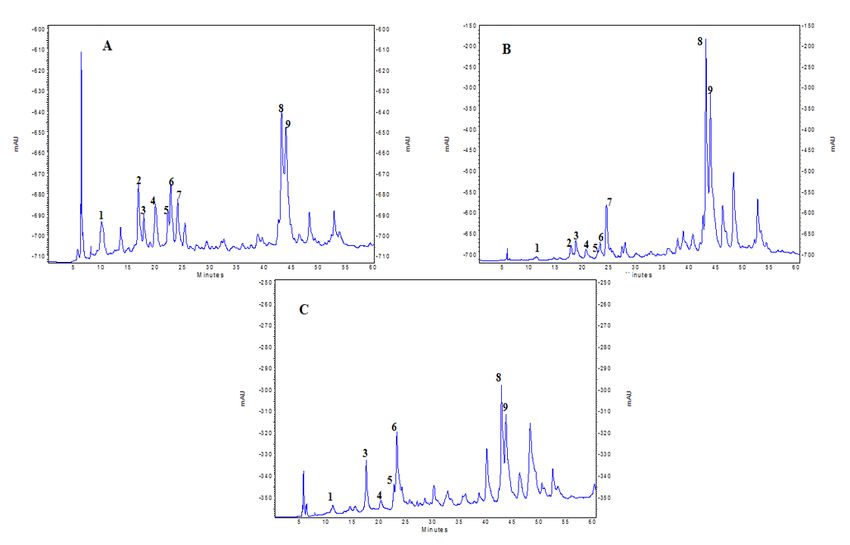
Sauri-Duch et AL.                              Yucatan propolis composition
in the case of Brazil).                                   physicochemical characteristics, antioxidant
However, few studies have investigated propolis           activity and composition of phenolic compounds
samples collected from areas with particular              and flavonoids using spectrophotometry and
territorial and climatic characteristics, such as         high-performance liquid chromatography.
those of the Yucatan Peninsula in southeastern
Mexico. In this region, research on propolis has          MATERIAL AND METHODS
been mainly focused on studying the volatile
constituents, triterpenoids, resorcinolic lipids          Raw propolis samples
and antimicrobial and antioxidant activity of             Raw propolis samples (850 g) of A. mellifera
samples collected from the same area (Pino et             were collected in January-February 2019 from
al., 2006; Boisard et al., 2015; Herrera-López et         nine different apiaries (RP1-RP9) in south-
al., 2019). Few studies have aimed to evaluate            eastern Mexico (Fig. 1). This collection period
the quality of propolis collected from different          coincided with the main flow of nectar and
sites in southeastern Mexican or the variability          flowering season of Viguiera dentata, the main
in its content of phenolic compounds and anti-            flower visited by bees. This region is the main
oxidant activity.                                         honey-producing area in Mexico, corresponds
Thus, in the present study, the varied quality            with the karst region and has a sub-humid
and composition of propolis collected from                warm climate (Aw0) with rain in the summer.
different apiaries in the Yucatan Peninsula               The main vegetation is low-medium deciduous
was evaluated according to some of its                    and sub-deciduous forest, and the minimum and

Fig. 1. Map of the location of apiaries in the southeast region of Mexico.

RP= raw propolis. RP1: Maxcanú (N 20° 34’ 52.932’’, W 89° 59’ 15.827’’), RP2: Santa Cruz (N 20° 35’ 6.324’’,
W 89° 57’ 39.563’’), RP3: Hecelchakán (N 20° 10’ 44.364’’, W 90° 7’ 28.055’’), RP4: Nunkiní (N 20° 23’
28.356’’,W 90° 8’ 58.38’’), RP5: Halachó (N 20° 28’ 16.464’’, W 90° 4’ 55.92’’), RP6: Maxcanú (N 20° 35’
11.724’’, W 90° 0’ 27.792’’), RP7: Pomuch (N 20° 08’ 16.00’’, W 90° 10’ 28.0’’), RP8: Calkiní (N 20° 22’ 10.524’’,
W 90° 3’ 6.804’’), RP9: Cuch Holoch (N 20° 26’ 7.98’’, W 90° 5’ 53.052’’).

 110
J. APIC. SCI. Vol. 65 No. 1 2021
maximum distance between the apiaries was 4        (100 rpm) for 12 days at 25.0±1.0°C in darkness.
and 56 km, respectively.                           These extraction conditions had been estab-
The samples were collected by scraping the         lished in preliminary studies; a higher total
internal parts of the hive. The impurities were    phenolic content (TPC) was recovered using this
first removed, and the samples were then stored    method. The extract was centrifuged (Changsha
at -20°C in darkness in an inert atmosphere (N2)   X-centrifuge, TGL-16M) at 2500 rpm for 10 min
to avoid material degradation. Before use, the     at 4°C, and the supernatant was filtered with
raw propolis was broken into small pieces and      Whatman™ no. 4 paper. The resulting ethanolic
ground with a coffee bean grinder (Hamilton        propolis extracts were stored at -20°C overnight
Beach 80350).                                      and then filtered to remove waxes. They were
                                                   then evaporated at reduced pressure to obtain
Characterization of raw propolis                   the dry ethanolic extracts, and the percentage
The moisture content was determined through yield was determined based on the dry weight
gravimetry. Two grams of finely ground raw of the extracts and original weight of the raw
propolis were heated in a convection oven propolis. The dry extracts were redissolved
at 105°C for 5 h until a constant weight was in ethanol (10 mL, 96%, v/v) and labeled as
reached. The ash content was determined ethanolic extracts of propolis (PE1-PE9) and
through incineration. Two grams of finely kept at 4°C in dark containers until analysis.
ground raw propolis were heated to 550°C for
8 h and then desiccated until a constant weight Characterization of propolis extracts
was reached (Martínez et al., 2012).               The oxidation index (s) and solubility were
The raw propolis was also sampled by a tasting determined in the lead acetate and sodium
panel of twenty individuals between the ages hydroxide of the ethanolic extracts with the
of 18 and 45 who had been selected through an procedures described by Tagliacollo & Orsi (2011).
interview. They performed discriminatory tests The TPC and TF contents, the Folin-Ciocalteu
(triangular, duo-trio, basic flavors). The samples and aluminum chloride were determined with
were evaluated using the check-all-that-apply colorimetric methods, respectively, as described
(CATA) technique: Each panelist evaluated each by Moo-Huchin et al. (2015). First, the ethanolic
sample, selecting the attributes they considered extract was diluted 20-fold to determine the
to be present in the samples. Each sample TPC content. A calibration curve of standard
weighed 20 g and was coded with three random solutions of gallic acid (100 to 1000 ppm)
digits. They were randomly given to the panelists was used, and the linear regression equation
in a monadic sequential manner according to a was Y=0.0008x + 0.0158, with R2=0.998. To
Latin square experimental design (Ramón-Canul determine the TF content, the ethanolic extract
et al., 2020). The evaluated sensory attributes was diluted 100-fold. A calibration curve of
were color (dark greenish brown, reddish yellow standard solutions of quercetin (25 to 500 ppm)
or brown), aroma (resinous soft, resinous, was used, and the linear regression equation
odorless or resinous aromatic), taste (insipid, was Y=0.0014x + 0.0082, with R2=0.997. In
piquant or bitter), and consistency (malleable both cases, the final results were calculated
or rigid) (NOM-003-SAG/GAN-2017, 2017). The according to the weight of the dry extracts,
color was evaluated against a white light, the the volume of the extracts, and the TPC and
aroma nasally, the taste retronasally and the TF concentrations obtained from the calibration
consistency by placing the sample between the curves. The TPC was expressed as mg equiva-
fingers.                                           lents of gallic acid/g of dry propolis extract (mg
                                                   GAE/g) and the TF content as mg equivalents of
Preparation of propolis extracts                   quercetin/g of dry propolis extract (mg QE/g).
Powdered propolis (6 g) was extracted in 20 ml The DPPH antioxidant activity (mM Trolox/g of
of ethanol (96%, v/v) during constant stirring dry propolis extract) of the ethanolic extract

                                                                                                 111
Sauri-Duch et AL. Yucatan propolis composition
diluted 20-fold and the ABTS antioxidant component analysis (PCA) was carried out to
activity (mM Trolox/g of dry propolis extract) characterize the propolis extracts.
of the ethanolic extract diluted 125-fold
were determined according to the procedure RESULTS
described by Moo-Huchin et al. (2015). Trolox
was used as a standard in both trials, and the Quality of raw propolis
absorbance of the samples was measured at 515 The quality characteristics of the raw propolis
nm for DPPH (Y=0.018x + 0.0062, R2=0.999) samples collected from apiaries in southeastern
and at 734 nm for ABTS (Y=0.0346x − 0.7895, Mexico varied significantly (p≤0.05), as shown
R2=0.997). The final results were calculated in Tab. 1. The moisture content of the samples
according the weight of the dry extracts, the ranged from 1.96% (RP6) to 8.26% (RP8) and
volume of the extracts, and the antioxidant the ash content from 0.66% (RP5) to 5.50%
activity obtained from the calibration curves. (RP8), respectively. The moisture and ash
The phenolic compounds in the propolis extracts content of RP8 (from Calkiní) was significantly
were quantified through high-performance higher (p≤0.05) than the other propolis samples.
liquid chromatography (HPLC). The dry ethanolic Based on the moisture values reported herein,
extract of propolis (60 mg) was dissolved samples RP3, RP4, and RP6 can be classified as
with HPLC-grade methanol (4 ml), centrifuged having a low moisture level (7%). Based
It was then injected into an HPLC-1220 infinity on the ash values, samples RP5 and RP7 are
system (Agilent Technologies, Palo Alto, CA, classified as having a low amount of ash (4%).
described by Can-Cauich et al. (2017) using the The raw propolis samples also had heteroge-
same column, composition, mobile phase flow, neous sensory characteristics. In regard to
wavelength and injection volume. To identify the appearance, RP1 and RP3 had irregular shiny
compounds, the retention time was compared pieces. RP2 had irregular pieces with little
between samples and standards. The quantifi- brightness, and RP8 was grainy. The remaining
cation of compounds was based on the calibra- RP4, RP5, RP6, RP7 and RP9 had opaque,
tion curves at six concentrations ranging from irregular pieces. In regard to aroma, the samples
20 to 200 ppm. The linearity of all compounds RP1 and RP8 had a mild resinous aroma, RP2, RP4
was satisfactory with R2 values >0.995. The and RP6 a resinous aroma, and RP7 a aromatic
results were expressed as mg of phenolic resinous aroma. The others- RP3, RP5, and RP9
compound/100 g of dry propolis extract. were odorless. In regard to color, RP1, RP2, RP3,
RP7 and RP9, slightly over half (55.5%) of the
Statistical analysis samples, had a dark greenish brown color, RP4
Data were expressed as the averages ± standard and RP5 (22.2%) a reddish yellow color, and RP6
deviations of the two experiments performed in and RP8, 22.2%, a brown color. In regard to taste,
triplicate. The data were analyzed by a one-way RP4 and RP7 had a piquant taste, whereas RP5
ANOVA (p≤0.05), and the significant differences and RP9 were bitter. The rest of the samples
between the treatments were established were characterized by a lack of taste (insipid).
by Tukey’s range test in the Statgraphics Plus Finally, most samples had a malleable consist-
version 5.1 software (Statistical Graphics Corp, ency (RP1, RP3, RP5, RP6, RP7, and RP9) rather
U.S.A). Pearson’s correlation coefficients were than rigid (RP2, RP4, and RP8).
calculated to evaluate the relationship between
the studied variables. Lastly, a principal
112J. APIC. SCI. Vol. 65 No. 1 2021
Table 1.
Moisture content, ash and sensory characteristics of raw propolis
Moisture
Samples Ash (%) Appearance Aroma Color Taste Consistency
(%)
Bright
Dark
irregular Resinous
RP1 6.63±0.11e 3.73±0.11e greenish Insipid Malleable
pieces soft
brown
Low
brightness Dark
RP2 6.30±0.00e 4.06±0.11f irregular Resinous greenish Insipid Rigid
pieces brown
Bright
Dark
irregular
RP3 4.63±0.11c 2.26±0.11c Odorless greenish Insipid Malleable
pieces
brown
Opaque
irregular Reddish
RP4 3.90±0.08b 4.03±0.05f Resinous Piquant Rigid
pieces yellow
Opaque
irregular Reddish
RP5 6.66±0.05e 0.66±0.05a Odorless Bitter Malleable
pieces yellow
Opaque
irregular
RP6 1.96±0.05a 2.86±0.05d Resinous Brown Insipid Malleable
pieces
Opaque
Dark
irregular Resinous
RP7 6.53±0.30e 1.83±0.05b greenish Piquant Malleable
pieces aromatic
brown
Powder or
Resinous
RP8 8.26±0.28f 5.50±0.17g Granules Brown Insipid Rigid
soft
Opaque Dark
RP9 5.50±0.17d 2.03±0.05bc irregular Odorless greenish Bitter Malleable
pieces brown
Different letters within a column denote significant differences according to Tukey test (n = 6, p≤0.05).
Values are means ± standard deviation.
Quality of propolis extracts varied widely from 2.30% (PE9) to 11.52% (PE2).
The chemical quality characteristics of the The TPC and TF values ranged from 4.17 (PE5)
propolis ethanolic extracts varied significantly to 97.02 mg GAE g (PE2) and from 1.79 (PE3) to
(p≤0.05), as shown in Tab. 2. The amount of 42.68 mg QE/g (PE2), respectively.
dry extract (soluble solids extracted in ethanol)
113114
Propolis Dry extract Solubility Solubility Oxidation index DPPH ABTS
TPC (mg GAE/g) TF (mg QE/g)
extract (%) in Pb in NaOH (s) mM Trolox/g mM Trolox/g
PE1 7.85±0.00d + + 16.16±0.55c 33.66±0.48e 11.93±0.00e 0.61±0.01b 2.29±0.13c
PE2 11.52±0.04h + + 6.00±0.00a 97.02±5.40g 42.68±1.79g 2.71±0.01d 4.64±0.30g
PE3 9.62±0.00f + + 12.03±0.55b 28.28±1.55de 1.79±0.00a 1.60±0.03b 2.50±0.00cd
PE4 6.02±0.03c + + 30.66±0.45e 51.90±1.78f 3.35±0.10ab 0.66±0.04b 2.88±0.04ef
Sauri-Duch et AL.
PE5 11.24±0.14g + + 43.06±0.75f 4.17±0.00a 2.62±0.04ab 0.20±0.01a 1.35±0.10b
PE6 6.05±0.18c + + 17.56±0.89cd 14.43±0.00b 5.56±0.12c 0.65±0.00b 2.50±0.02cd
PE7 8.67±0.01e + + 42.56±0.75f 19.32±0.52bc 3.88±0.05bc 0.26±0.00a 0.92±0.00a
PE8 5.19±0.00b + + 13.36±0.63b 23.31±0.04cd 10.15±0.09d 0.25±0.00a 3.10±0.08f
PE9 2.30±0.00a + + 18.46±0.65d 27.42±0.08d 23.03±0.41f 1.55±0.08c 2.68±0.10de
Chemical quality of propolis extracts
Yucatan propolis composition
from Calkiní; PE9: propolis extracts from Cuch-holoch.
Maxcanú; PE2: propolis extracts from Santa Cruz; PE3:
Values are means ± standard deviation. The symbol
Different letters within a column denote significant
differences according to Tukey test (n = 6, p≤0.05).
Table 2.
propolis extracts from Pomuch; PE8: propolis extracts
Halachó; PE6: propolis extracts from Maxcanú; PE7:
extracts from Nunkiní; PE5: propolis extracts from
(+) means positive result. PE1: propolis extracts from
propolis extracts from Hecelchakán; PE4: propolisJ. APIC. SCI. Vol. 65 No. 1 2021
Table 3.
Pearson´s correlation between different parameters
Parameters ABTS DPPH TF TPC
DPPH 0.78* -
TF 0.76 0.94 -
TPC 0.83 0.84 0.78 -
Oxidation index -0.81 -0.57 -0.57 -0.52
* All correlations are significant with a value of p≤0.05
All of the propolis extracts passed the lead yield, TPC, TF, and DPPH and ABTS activity and
acetate and sodium hydroxide solubility test. a lower value (p≤0.05) on the oxidation index.
In the calculation of the oxidation index, the Furthermore, the correlation between in vitro
time required for the violet color of the oxidizing antioxidant activity (DPPH and ABTS) and TPC,
agent (potassium permanganate) to disappear TF, and the oxidation index was also analyzed
ranged from 6.0 s (PE2) to 43.06 s (PE5). In (Tab. 3). The antioxidant measures, DPPH and
regard to in vitro antioxidant activity, the DPPH ABTS, had a strong positive relationship (r=0.78,
values ranged from 0.20 (PE5) to 2.71 mM p≤0.05). The antioxidant activity, DPPH and
Trolox/g (PE2), and the ABTS values ranged ABTS, had a strong linear relationship with TF
from 0.92 (PE7) to 4.64 mM Trolox/g (PE2). The (r=0.94 and r=0.76, respectively, p≤0.05) and
antioxidant activity of the extracts quantified TPC (r=0.84 and r=0.83, respectively, p≤0.05)
with the use of the ABTS assay was higher than whereas a negative relationship with the
with the use of the DPPH assay. A comparison of oxidation index (r=-0.57 and r=-0.81, respec-
the extracts showed that PE2 (from Santa Cruz) tively, p≤0.05). Furthermore, TF (r=0.78, p≤0.05)
had a significantly higher (p≤0.05) dry extract was positively associated with TPC, and the TPC
Fig. 2. A typical chromatogram of the phenolic compounds detected in extracts PE1 (A), PE2 (B) and PE7 (C).
115116
Samples 1 2 3 4 5 6 7 8 9
PE1 122.32±4.56 229.13±6.79 235.87±4.87 72.99±0.82 72.26±3.39 62.40±0.82 18.56±0.98 23.09±2.03 55.55±1.50
PE2 41.63±0.30 106.86±1.28 215.24±1.31 62.48±1.37 53.90±0.20 172.36±5.62 3.10±0.19 153.75±0.00 388.26±25.46
PE3 22.17±0.46 145.51±2.31 207.09±4.66 38.53±1.07 55.19±0.47 12.57±0.62 3.23±0.05 28.72±0.00 22.05±0.41
PE4 51.07±2.13 140.60±0.98 nd 4.04±0.12 74.35±3.42 nd nd 5.62±0.00 13.61±0.33
Sauri-Duch et AL.
PE5 10.30±0.03 nd 47.28±1.06 10.30±0.45 54.28±0.47 7.23±0.19 nd 2.35±0.00 20.98±0.17
PE6 215.01±8.64 48.62±1.55 0.88±0.12 79.45±0.54 8.86±0.11 2.26±0.07 nd 2.15±0.05
PE7 24.64±0.40 nd 273.28±1.73 9.42±0.29 80.60±3.11 62.21±0.00 nd 44.74±0.00 53.02±2.29
PE8 31.12±0.68 nd 61.89±3.24 16.59±0.07 40.91±0.21 26.05±0.85 4.19±0.07 38.03±0.00 60.36±1.92
PE9 nd 91.36±0.37 nd 50.51±2.21 76.80±1.42 19.66±0.19 16.97±0.56 22.46±0.00 29.95±1.03
nd: not detected.
Yucatan propolis composition
Content of individual phenolic compounds (mg/100 g of dry propolis extract)
Maxcanú; PE7: Pomuch; PE8: Calkiní; PE9: Cuch Holoch.
brin and 9: Chrysin. Different letters within a column
1: Gallic acid, 2: Chlorogenic acid, 3: Catechin, 4: Vanillin,
denote significant differences according to Tukey test
5: Ellagic acid, 6: Sinapic acid, 7: Ferulic acid, 8: Pinocem-
Table 4.
PE3: Hecelchakán; PE4: Nunkiní; PE5: Halachó; PE6:
PE= propolis extracts. PE1: Maxcanú; PE2: Santa Cruz;
(n = 6, p≤0.05). Values are means ± standard deviation.J. APIC. SCI. Vol. 65 No. 1 2021
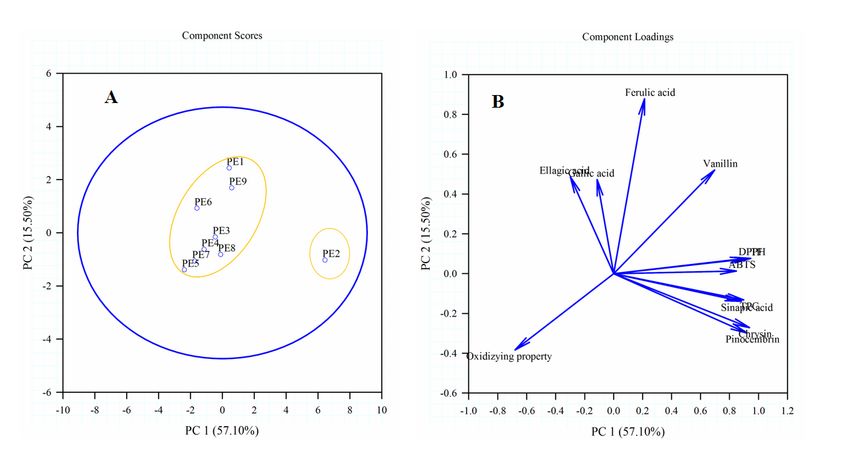
Fig. 3. PC1 vs. PC2 scatter plot; A) distinction between the samples (scores); (B) based on chemical quality
(loadings).
and TF contents were negatively correlated 1 were extracted. Fig. 3 (A and B) shows the
with the oxidation index (r=-0.52 and r=-0.57, two-way loadings and score plots. The first
p≤0.05, respectively). two components explained 72.6% of the total
The content of individual phenolic compounds in variability of the data. The first component was
the propolis extracts varied widely, as shown in positively correlated with TPC, TF, DPPH, sinapic
Tab. 4. Nine phenolic compounds were identified acid, pinocembrin and chrysin. The second
and quantified in the propolis extracts, including component was positively correlated with ferulic
three hydroxycinnamic acids (ferulic, sinapic, acid and negatively correlated with pinocembrin,
and chlorogenic acid), one flavone (chrysin), chrysin and the oxidation index (Fig. 3B). Fig. 3A
one flavanol (catechin), three hydroxybenzoic shows the classification of the propolis extracts
acids (gallic and ellagic acid and vanillin) and one in two groups: Group 1 contains PE2 and group
flavanone (pinocembrin) (Fig. 2). In particular, 2 contains the rest of the extracts. The single
gallic acid and catechin were the most abundant extract in group 1 was separated for its high TF,
phenolic compounds in PE6. Chlorogenic acid TPC, pinocembrin, sinapic acid, chrysin contents
and vanillin were the most abundant phenolic and high antioxidant activity (DPPH and ABTS).
compounds in PE1, and PE1, PE4, PE6, PE7 and The samples in group 2 were rich in ferulic acid
PE9 were rich in ellagic acid. PE1 (18.56 mg/100 but had a low pinocembrin and chrysin content
g) and PE9 (16.97 mg/100 g) were compared and high values on the oxidation index.
and stood out for their high ferulic acid content.
Also, sinapic acid, pinocembrin and chrysin were DISCUSSION
the predominant compounds in the PE2 extract
with the highest TPC, TF, and antioxidant Quality of raw propolis
activity. The moisture content of the raw propolis
samples is within the limits established by the
PCA Argentine standard (maximum 10%) (IRAM-INTA
In the principal component analysis, two main 15935-1, 2008). It is important to control the
components with eigenvalues greater than moisture in raw propolis since a high moisture
117Sauri-Duch et AL. Yucatan propolis composition
content creates optimal conditions for the 2001; IRAM-INTA 15935-1, 2008). The low dry
growth of fungi and or possibly lead to fer- extract content of PE9 can be attributed to the
mentation during storage. The moisture values type of plant species near the hive, which may
obtained herein are similar to those reported for
not have a high amount of resin, in addition to
brown, green, and red propolis from different the collection season or improper handling by
regions in Brazil (Machado et al., 2016). beekeepers during harvest (Viloria et al., 2012).
The ash content of propolis (except RP8) is within
The dry extract content herein was comparable
the limits established by Brazilian legislation to that reported for extracts of propolis collected
(maximum 5%) (TRPIQ , 2001) and is comparable in several localities in Brazil (Tagliacollo & Orsi,
to that obtained by Machado et al. (2016) for 2011). The extracts passed the lead acetate
Brazilian propolis. This quality parameter is and sodium hydroxide solubility test, complying
important because it indicates the existence of with the Brazilian and Argentine standards es-
tablished for propolis extracts (TRPIQ , 2001;
mechanical impurities including wood, soil, plant
remains, insects and dead bees. IRAM-INTA 15935-1, 2008). In regard to the
In regard to the sensory characteristics, most of
oxidation index, the Brazilian and Mexican
the samples presented irregular opaque pieces. standards suggest a maximum reaction time of
22 s (TRPIQ , 2001; NOM-003-SAG/GAN-2017,
According to Viloria et al. (2012), the brightness
of raw propolis may be related to the phytoge- 2017). Herein, 66.66% of the extracts passed
ography or external oxidation. These authors this test, similar to Brazilian propolis (Tagliacollo
also indicate that raw propolis obtained through& Orsi, 2011).
the scraping method can contain irregular and Minimum values for the TPC (0.5% or 5 mg/g)
opaque pieces, as found herein. Based on the and TF (0.25% or 2.5 mg/g) of propolis extracts
present results, it can also be inferred that the
were established by Brazilian legislation. Most
raw propolis with the highest ash content is of the extracts herein met these require-
the most rigid. In addition, the samples showed ments, except for PE5 and PE3 with respect
high variability in the aroma, color, taste, andto TPC and TF, respectively. However, the TPC
consistency, similar to raw propolis samples and TF reported herein were lower than those
from Colombia and Brazil (Viloria et al., 2012; reported by Xu et al. (2019) for propolis extracts
Machado et al., 2016). The lack of aroma in RP3,from China and the United States. These differ-
RP5 and RP9 could result from their low content ences can mainly be attributed to the influence
of essential oils. and diversity of the botanical origin of resin,
The high variability in the moisture and ash which differs among each region of the world
content and sensory characteristics are (Palomino et al., 2009).
attributed to the apiaries’ geographical location,
The antioxidant activity found herein was
type of propolis, collection period, handling ofhigher than that reported for propolis extracts
hives, and surrounding vegetation (much of from Colombia and Tunisia according to both the
which is endemic). Given the high variation in ABTS and DPPH assays (Palomino et al., 2009;
the quality and sensory characteristics, future Gargouri et al., 2019). These results confirm
studies should apply palynological methods to the potential of propolis from southeastern
determine the specific flora visited by bees to Mexico for use in the pharmaceutical and food
collect materials (e.g., resin) to make propolis.
industries. However, the antioxidant activity of
the propolis extracts was higher according to
Quality of propolis extract the ABTS assay than the DPPH assay. There
Around one-fifth (22.2%) of the ethanolic are several possible explanations for this
propolis extracts complied with the Brazilian phenomenon (Cerretani & Bendini, 2010; Gulcin,
and Argentine standards for minimum dry 2020):
extract content (11 and 10 g of dry extract/100 A) The ABTS assay is known to be less
mL of ethanolic extract, respectively) (TRPIQ , selective than the DPPH assay in reacting with
118J. APIC. SCI. Vol. 65 No. 1 2021 donors of hydrogen atoms because it is reduced where the population is small (
Sauri-Duch et AL.                                  Yucatan propolis composition
REFERENCES                                                   Journal of Pharmaceutical and Biomedical
                                                             Analysis, 45(3), 390-399. https://doi.org/10.1016/j.
Bankova, V., Bertelli, D., Borba, R., Conti, B. J., da Silva jpba.2007.06.022
Cunha, I. B., Danert, C., ... Papotti, G. (2019). Standard
methods for Apis mellifera propolis research. Journal Gargouri, W., Osés, S. M., Fernández-Muiño, M. A.,
of Apicultural Research, 58(2), 1-49. https://doi.org/ Sancho, M. T., Kechaou, N. (2019). Evaluation of
10.1080/00218839.2016.1222661                                bioactive compounds and biological activities of
                                                             Tunisian propolis. LWT, 111, 328-336. https://doi.
Boisard, S., Huynh, T. H. T., Escalante-Erosa, F., org/10.1016/j.lwt.2019.05.044
Hernández-Chavez, L. I., Peña-Rodríguez, L. M.,
Richomme, P. (2015). Unusual chemical composition Gulcin, İ. (2020). Antioxidants and antioxidant
of a Mexican propolis collected in Quintana Roo, methods: an updated overview. Archives of
Mexico. Journal of Apicultural Research, 54(4), 350- Toxicology, 94, 651-715. https://doi.org/10.1007/
357. https://doi.org/10.1080/00218839.2016.11696 s00204-020-02689-3
51
                                                             Herrera-López, M. G., Rubio-Hernández, E. I., Leyte-
Can-Cauich, C. A., Sauri-Duch, E., Betancur-Ancona, Lugo, M. A., Schinkovitz, A., Richomme, P., Calvo-
D., Chel-Guerrero, L., González-Aguilar, G. A., Cuevas- Irabién, L. M., Peña-Rodríguez, L. M. (2019). Botanical
Glory, L. F., Pérez-Pacheco, E., Moo-Huchin, V. M. origin of triterpenoids from Yucatecan propolis.
(2017). Tropical fruit peel powders as functional Phytochemistry Letters, 29, 25-29. https://doi.
ingredients: Evaluation of their bioactive compounds org/10.1016/j.phytol.2018.10.015
and antioxidant activity. Journal of Functional
Foods, 37, 501-506. https://doi.org/10.1016/j. Instituto Argentino de Normalización y Certificación.
jff.2017.08.028                                              Productos del NOA (noroeste argentino). Propóleos.
                                                             Parte 1—Propóleos en bruto. (2008). https://
Cerretani, L., & Bendini, A. (2010). Rapid Assays to catalogo.iram.org.ar/#/normas/detalles/9314
Evaluate the Antioxidant Capacity of Phenols in
Virgin Olive Oil. In Olives and Olive Oil in Health and Jerković, I., Marijanović, Z., Kuś, P. M., Tuberoso, C. I.
Disease Prevention (pp. 625-635). Elsevier. https:// G. (2016). Comprehensive Study of Mediterranean
doi.org/10.1016/B978-0-12-374420-3.00067-X                   (Croatian) Propolis Peculiarity: Headspace, Volatiles,
                                                             Anti- Varroa-Treatment Residue, Phenolics, and
Chaillou, L. L., & Nazareno, M. A. (2009). Chemical Antioxidant Properties. Chemistry & Biodiversity,
variability in propolis from Santiago del Estero, 13(2),                    210-218.           https://doi.org/10.1002/
Argentina, related to the arboreal environment cbdv.201500053
as the sources of resins. Journal of the Science of
Food and Agriculture, 89(6), 978-983. https://doi. Machado, B. A. S., Silva, R. P. D., Barreto, G. de A.,
org/10.1002/jsfa.3542                                        Costa, S. S., Silva, D. F. da, Brandão, H. N., ... Padilha, F. F.
                                                             (2016). Chemical Composition and Biological Activity
Diario Oficial de la Federación (DOF). (6 of Extracts Obtained by Supercritical Extraction
deoctubre de 2017).Norma Oficial Mexicana: and Ethanolic Extraction of Brown, Green and Red
Propóleos, producción y especificaciones para su Propolis Derived from Different Geographic Regions
procesamiento. (2017). http://dof.gob.mx/nota_ in Brazil. PLoS ONE, 11(1), e0145954. https://doi.
detalle.php?codigo=5500103&fecha=06/10/2017                  org/10.1371/journal.pone.0145954

Gardana, C., Scaglianti, M., Pietta, P., Simonetti,             Martínez G, J., Garcia P, C., Durango R, D., Gil G, J.
P. (2007). Analysis of the polyphenolic fraction                (2012). Caracterización de propóleos provenientes
of propolis from different sources by liquid                    del municipio de Caldas obtenido por dos métodos
chromatography-tandem mass spectrometry.                        de recolección. Revista MVZ Córdoba, 2861-2869.

 120
J. APIC. SCI. Vol. 65 No. 1 2021
https://doi.org/10.21897/rmvz.254 Instrução normativa no 3. (2001). http://extranet.
agricultura.gov.br/sislegis-consulta/ser vlet /
Moguel-Ordoñez, Y., Echazarreta, C. M., Mora- VisualizarAnexo?id=2193
Escobedo, R. (2005). δ13 C isotopic index of honeys
produced in the Yucatan peninsula, Mexico. Journal Reis, J. H. de O., Barreto, G. de A., Cerqueira, J. C., Anjos,
of Apicultural Research, 44(2), 49-53. https://doi.org J. P. dos, Andrade, L. N., Padilha, F. F., Druzian, J. I.,
/10.1080/00218839.2005.11101147 Machado, B. A. S. (2019). Evaluation of the antioxidant
profile and cytotoxic activity of red propolis extracts
Moo-Huchin, V. M., Moo-Huchin, M. I., Estrada-León, R. from different regions of northeastern Brazil
J., Cuevas-Glory, L., Estrada-Mota, I. A., Ortiz-Vázquez, obtained by conventional and ultrasound-assisted
E., ... Sauri-Duch, E. (2015). Antioxidant compounds, extraction. PLoS ONE, 14(7), e0219063. https://doi.
antioxidant activity and phenolic content in peel org/10.1371/journal.pone.0219063
from three tropical fruits from Yucatan, Mexico. Food
Chemistry, 166, 17-22. https://doi.org/10.1016/j. Ristivojević, P., Trifković, J., Andrić, F., Milojković-
foodchem.2014.05.127 Opsenica, D. (2015). Poplar-type propolis:
chemical composition, botanical origin
Palomino G, Lady, García P, C., Gil G, J., Rojano, B., and biological activity. Natural Product
Durango R, D. (2009). Determinación Del Contenido Communications, 10(11), 1869-1876. https://doi.
De Fenoles Y Evaluación De La Actividad Antioxidante org/10.1177/1934578X1501001117
De Propóleos Recolectados En El Departamento De
Antioquia (Colombia). VITAE, 16(3), 388-395. Tagliacollo, V. A., & Orsi, R. de O. (2011). Quality
of propolis commercialized in the informal
Piccinelli, A. L., Mencherini, T., Celano, R., Mouhoubi, market. Ciência e Tecnologia de Alimentos,
Z., Tamendjari, A., Aquino, R. P., Rastrelli, L. (2013). 31(3), 752-757. https://doi.org/10.1590/S0101-
Chemical Composition and Antioxidant Activity 20612011000300031
of Algerian Propolis. Journal of Agricultural and
Food Chemistry, 61(21), 5080-5088. https://doi. Trusheva, B., Popova, M., Koendhori, E. B., Tsvetkova,
org/10.1021/jf400779w I., Naydenski, C., Bankova, V. (2011). Indonesian
propolis: Chemical composition, biological activity
Pino, J. A., Marbot, R., Delgado, A., Zumárraga, C., and botanical origin. Natural Product Research,
Sauri, E. (2006). Volatile Constituents of Propolis 25(6), 606-613. https://doi.org/10.1080/14786419.
from Honey Bees and Stingless Bees from Yucatán. 2010.488235
Journal of Essential Oil Research, 18(1), 53-56.
https://doi.org/10.1080/10412905.2006.9699384 Viloria B., J. D., Gil G., J. H., Durango R., D. L., García P., C.
M. (2012). Caracterización Fisicoquímica Del Propóleo
Ramón-Canul, L. G., Margarito-Carrizal, D. L., Limón- De La Región Del Bajo Cauca Antioqueño (Antioquia,
Rivera, R., Morales-Carrrera, U. A., Rodríguez-Buenfil, Colombia). Biotecnología En El Sector Agropecuario
I. M., Ramírez-Sucre, M. O., ... Ramírez-Rivera, E. D. y Agroindustrial, 10(1), 77-86.
J. (2020). Technique for order of preference by
similarity to ideal solution (TOPSIS) method for the Woźniak, M., Mrówczyńska, L., Waśkiewicz, A.,
generation of external preference mapping using Rogoziński, T., Ratajczak, I. (2019). Phenolic Profile
rapid sensometric techniques. Journal of the Science and Antioxidant Activity of Propolis Extracts
of Food and Agriculture. https://doi.org/10.1002/ From Poland. Natural Product Communications,
jsfa.10959 14(5), 1934578X1984977. https://doi.
org/10.1177/1934578X19849777
Regulamento Técnico Para Fixação De Identidade
E Qualidade De Própolis. Normative Instruction n° Xu, X., Pu, R., Li, Y., Wu, Z., Li, C., Miao, X., Yang,
3. Ministério de Agricultura e do Abastecimento. W. (2019). Chemical Compositions of Propolis
121Sauri-Duch et AL. Yucatan propolis composition from China and the United States and their Antimicrobial Activities Against Penicillium notatum. Molecules, 24(19), 3576. https://doi.org/10.3390/ molecules24193576 122
You can also read