EFFECTIVE AND SCALABLE CLUSTERING OF SARS-COV-2 SEQUENCES
←
→
Page content transcription
If your browser does not render page correctly, please read the page content below
Effective and scalable clustering of SARS-CoV-2 sequences

 SARWAN ALI, Georgia State University, Atlanta GA, USA
 TAMKANAT E ALI, Lahore University of Management Sciences, Lahore, Pakistan
 MUHAMMAD ASAD KHAN, Hazara University, Mansehra, Pakistan
 IMDADULLAH KHAN, Lahore University of Management Sciences, Lahore, Pakistan
 MURRAY PATTERSON, Georgia State University, Atlanta GA, USA
arXiv:2108.08143v2 [q-bio.PE] 25 Aug 2021

 SARS-CoV-2, like any other virus, continues to mutate as it spreads, according to an evolutionary process. Unlike any other
 virus, the number of currently available sequences of SARS-CoV-2 in public databases such as GISAID is already several
 million. This amount of data has the potential to uncover the evolutionary dynamics of a virus like never before. However,
 a million is already several orders of magnitude beyond what can be processed by the traditional methods designed to
 reconstruct a virus’s evolutionary history, such as those that build a phylogenetic tree. Hence, new and scalable methods will
 need to be devised in order to make use of the ever increasing number of viral sequences being collected.
 Since identifying variants is an important part of understanding the evolution of a virus, in this paper, we propose an
 approach based on clustering sequences to identify the current major SARS-CoV-2 variants. Using a -mer based feature
 vector generation and efficient feature selection methods, our approach is effective in identifying variants, as well as being
 efficient and scalable to millions of sequences. Such a clustering method allows us to show the relative proportion of each
 variant over time, giving the rate of spread of each variant in different locations — something which is important for vaccine
 development and distribution. We also compute the importance of each amino acid position of the spike protein in identifying
 a given variant in terms of information gain. Positions of high variant-specific importance tend to agree with those reported
 by the USA’s Centers for Disease Control and Prevention (CDC), further demonstrating our approach.
 Additional Key Words and Phrases: SARS-CoV-2, Spike Protein, k-mers, Feature Selection, Clustering, k-means
 ACM Reference Format:
 Sarwan Ali, Tamkanat E Ali, Muhammad Asad Khan, Imdadullah Khan, and Murray Patterson. . Effective and scalable
 clustering of SARS-CoV-2 sequences. In Proceedings of ICBDR. ACM, New York, NY, USA, 12 pages.

 1 INTRODUCTION
 The current global COVID-19 pandemic is caused by SARS-CoV-2 (severe acute respiratory syndrome coronavirus
 2) and its variants. SARS-CoV-2 was first detected in Wuhan, China by the end of 2019 (12 December 2019) [42].
 Because SARS-CoV-2 is easily transmitted from one person to another, it spread (exponentially) quickly throughout
 the globe, developing variants such as Alpha and now Delta, which have greatly accelerated this spread. As
 of July 2021, more than 200 million COVID-19 cases have been reported in 221 countries, with over 4 million
 deaths [14].
 From the perspective of molecular evolution, SARS-CoV-2 continues to diverge as it spreads, developing new
 variants, like any other virus. Hence, methods for building phylogentic trees [21] — which have been successful for
 Ebola, Zika and the Avian Flu — seem apt, because they provide a very complete and detailed evolutionary history
 Permission to make digital or hard copies of all or part of this work for personal or classroom use is granted without fee provided that
 copies are not made or distributed for profit or commercial advantage and that copies bear this notice and the full citation on the first
 page. Copyrights for components of this work owned by others than ACM must be honored. Abstracting with credit is permitted. To copy
 otherwise, or republish, to post on servers or to redistribute to lists, requires prior specific permission and/or a fee. Request permissions from
 permissions@acm.org.
 ICBDR, 2021
 © Association for Computing Machinery.
 ACM ISBN 978-x-xxxx-xxxx-x/YY/MM. . . $15.00

 1
ICBDR, 2021 S. Ali et al.

of a virus based on molecular sequencing data. The only problem is that such tree building methods can typically
process thousands of sequences, while the number of sequences of SARS-CoV-2, available in public databases such
as GISAID [20], is already several million. Approaches which first divide the dataset into smaller subsets [16], or
use parallelization [29], have allowed the building of trees to scale to tens of thousands of SARS-CoV-2 sequences,
however this is still far from closing the gap.
 The number of available SARS-CoV-2 sequences forces us to rethink the current methodology used to study the
evolutionary dynamics of viruses, and this number will only increase in the coming decades [37]. While building
a phylogenetic tree directly on the millions of SARS-CoV-2 sequences seems out of reach, variants of the virus
would appear as major clades of the hypothetical SARS-CoV-2 phylogenetic tree. Since the major clades form
natural clusters of the sequences, a completely orthogonal approach based on clustering the sequences directly
could shed light on this important part of the evolutionary dynamics of SARS-CoV-2 (or viruses in general).
Identifying variants has many practical application as well, guiding vaccine design and distribution decisions, as
well as informing strategies on how to monitor and prevent future outbreaks. A major advantage of clustering is
that it is a widely studied field for which there are techniques which can scale to millions and billions of objects.
It remains to decide which (parts of) SARS-CoV-2 sequences to choose, and the best feature vector representation
to use for the downstream clustering, which we describe below.
 It is common knowledge that the majority of the variation in the SARS-CoV-2 genome takes place in the spike
region [25]. Part of this is because the spike region encodes an important function of the virus, namely the spike
protein. For this reason, we focus not only on the spike region of the genome, but on the amino acid (protein)
sequence encoded by this region (see Figure 1). This allows us to work with a much more compact representation
(avoiding the curse of dimensionality). Most of the machine learning (ML) based methods (classification, clustering,
etc.) take numerical (real-valued) vectors as an input. Therefore, we cannot work directly with these amino
acid sequences if we want to make use of ML based algorithms. Since the order of the amino acids within each
sequence also matters, we cannot simply convert the alphabets (amino acids) into numeric characters and apply
ML algorithms. A popular approach to preserve the order of the sequences in converting the alphabets vector into
numeric vector is to use the one-hot encoding approach [25]. In theory, while the one-hot encoding preserves the
order of amino acid sequences, the preserved order is of no use while computing pairwise distance (e.g., euclidean
distance) [8]. To deal with this problem, each sequence is first converted into length substrings (called -mers).
These -mers successfully preserve the order of each sequence, that can be crucial to the performance of the
classification/clustering tasks [8, 18].

 266 13, 468 21, 563 25, 384 29, 674
 50 Spike Protein(s) 30

 Non-structural Proteins (ORF1ab) Structural Proteins (S, E, M, and N)

Fig. 1. The SARS-CoV-2 genome is around 29–30kb encoding structural and non-structural proteins. The four structural
proteins include spike, envelope, membrane, and nucleocapsid. The spike region comprises 25, 384 − 21, 563 = 3821
nucleotides, which code for a sequence of 3821 (+ 1 stop codon *) /3 = 1274 amino acids.

 In this paper, we propose a method to quickly and effectively cluster the spike amino acid sequences of
SARS-CoV-2. We show that our method performs substantially better than the baseline approach, and successfully
clusters the variants into unique clusters with high F1 score. Our contributions in this paper are the following:
 (1) We propose a method based on -mers for efficient sequence clustering, and show that the quality of
 clusters as a result of our methods is very high.
 (2) We use this to analyze the spread pattern of different variants over time, which can guide vaccination
 design and distribution strategies.

 2
Effective and scalable clustering of SARS-CoV-2 sequences ICBDR, 2021

 (3) We compute the importance of each amino acid position in distinguishing a variant, and show that this
 corresponds to previous studies.

 The rest of the paper is organized as follows: Section 2 contains related work. Our proposed approach is
detailed in Section 3. A description of the datasets used are given in Section 4. We provide a detailed discussion
about the results in Section 5 and then we finally conclude our paper in Section 6.

2 RELATED WORK
Sequence classification and clustering are popular approaches [8, 23], most methods requiring the sequences to
be aligned [17]. Such aligned sequences are used to design fixed-length feature vector representations that can be
input to classical machine learning (ML) based algorithms. Authors in [13] compute pairwise local and global
alignment similarity scores between sequences so that different types of analysis can be performed. Another
approach to analyzing the sequences is using heuristic methods. However, these methods require a number of
ad-hoc settings (e.g., a penalty for gaps and substitutions). Moreover, these methods may not perform well on
specific regions of the genome with high variance. Feature vector based representation has been successfully used
in literature for other applications such as missing values prediction in graphs [9], sequence analysis in texts [34–
36], biology [18, 24, 26], classification of electroencephalography and electromyography sequences [10, 40],
detecting security attacks in networks [5], and electricity consumption in smart grids [6, 7]. It is also important
to study the conditional dependencies between variables so that their importance can be analysed [4]. Studying
the relationships between amino acid positions (attributes) and the class labels (variants) can help us understand
which amino acids play a key role in developing specific COVID-19 variants. Information related to mutations
and variants could also help the relevant public health departments to study the transmission patterns of different
variants, which could help to prevent rapid spread of the underlying virus [1–3, 38].
 To address problems that arise in the alignment-based approaches, various alignment-free methods have been
proposed [12, 18]. One such method uses -mers, which preserve the order of the sequences without relying on
alignment. Authors in [11] use frequency vectors generated from the -mers for phylogenetic applications. These
methods are successful in constructing accurate phylogenetic trees from several (coding and non-coding) DNA
sequences. To measure the (pairwise) similarity between these frequency vectors, different distance measures are
used [45]. A recent article [28] proposes a clustering approach for SARS-CoV-2 subtypes identification, however
they cluster full-length nucleotide sequences, and use a very different representation and clustering technique.

3 PROPOSED APPROACH
In this section, we first detail the computation of -mers and the generation of their frequency vectors. We then
show how we apply feature selection methods on these frequency vectors, followed by clustering.

3.1 k-mers Computation
The first step of our pipeline is to compute all -mers of each sequence to map it to a fixed length vector, while
allowing its order to be preserved. Given a sequence, the total number of -mers that can be generated is − + 1,
where is the total number of elements in the sequence (1274 amino acids in our case), and is a user-defined
parameter for the size of each mer. See Figure 2 for an example. In our experiments we use = 3 — decided using
a standard validation set approach [15].
 After computing the -mers for each sequence, the next step is to generate the numerical representation
of these vectors. For this purpose, we design frequency vectors that contain the counts of each -mer in the
corresponding sequence.

 3
ICBDR, 2021 S. Ali et al.

 Fig. 2. Example of 4-mers of the amino acid sequence “VLPLVFVFVFM”.

3.2 Frequency Vectors Generation
Each sequence is over an alphabet Σ (amino acids in our case). Since each frequency vector Φ ( ) must have
the same fixed length, this length is |Σ| , the number of possible -mers of . In our experiments, the length of
each frequency vector is 4977.

3.3 Feature Selection
After generating the -mers based frequency vector Φ ( ) for each sequence , the next step is to select the
most important features in the feature vectors. For this purpose, we use the following two supervised feature
selection methods.

3.3.1 Ridge Regression [22]. Ridge Regression (RR) is a popular method for feature selection, which is used to
address the colinearity problem that often arises in multiple linear regression [27]. RR works by introducing
a bias term to increase the bias and hence improve the variance (i.e., generalization capability of the model).
RR changes the slope of the (regression) line and tries to make it more horizontal. RR is beneficial for feature
selection because it gives insights on which independent variables are not informative (can reduce the slope close
to zero). We can eliminate some of these useless independent variables (hence reduce the dimensions of the data).
The objective function of RR is (Sum of square residuals + × slope2 ), where × 2 is a penalty term.
After applying RR, we selected 1242 features out of 4977.

3.3.2 Lasso Regression [39]. The Lasso Regression (LR) is another supervised feature selection algorithm similar
to RR [31]. The only difference is that it can reduce the slope exactly (i.e., = 0) rather than close to zero (as
is done by RR). The objective function of LR is (Sum of square residuals + × |slope|), where the penalty
term × |slope| is now in terms of the cardinality of the slope. This helps to reduce the slope of useless variables
exactly to zero. After applying lasso regression, we selected 964 features of 4977.

3.4 Clustering using K-means
After generating -mers, frequency vectors, and feature selection, we use the -means clustering algorithm (with
default parameters) to cluster the data. Since we have 5 variants in our data, we used = 5 for in -means (see
Section 5.1 for more details regarding the optimal number of clusters).

 4
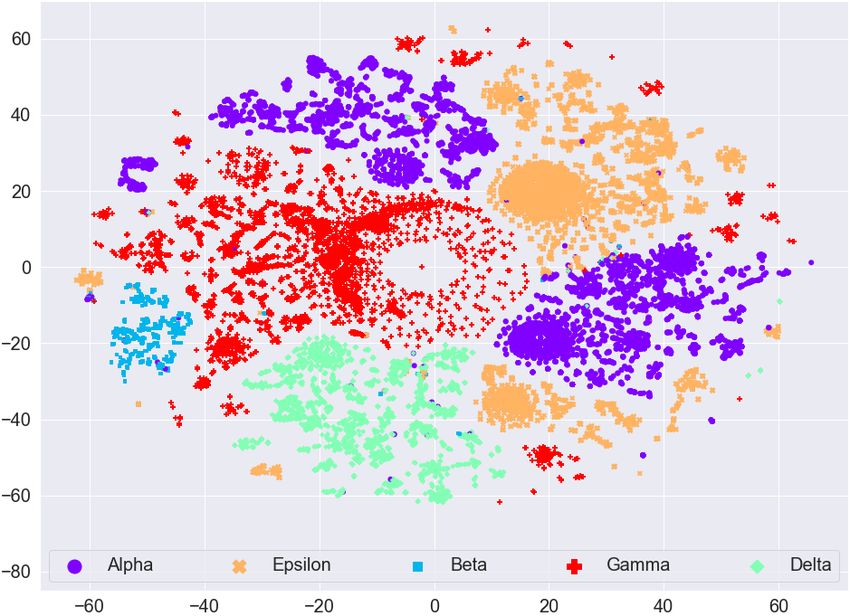
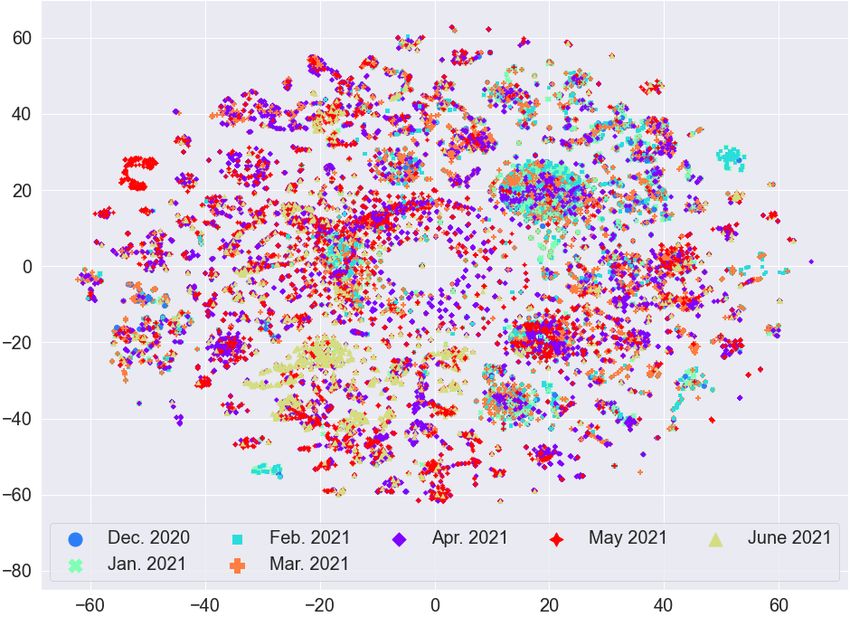
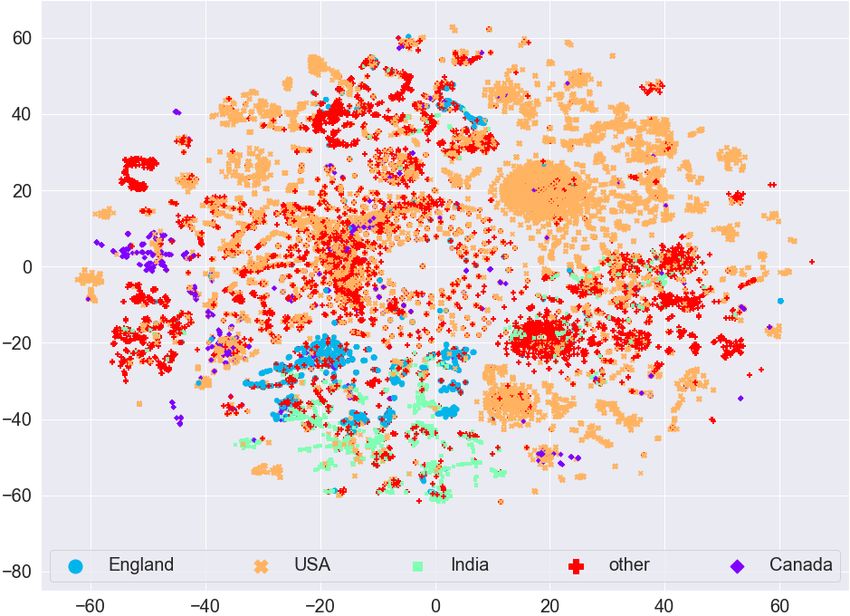
Effective and scalable clustering of SARS-CoV-2 sequences ICBDR, 2021

4 EXPERIMENTAL SETUP
In this section, we first report information related to the dataset. Then we try to find any natural (hidden)
clustering in the data by using the t-distributed stochastic neighbor embedding (t-SNE) approach [41]. For
the baseline, we use simple -means clustering algorithm without first applying any feature selection on the
frequency vectors. To measure the quality of clustering (without and with feature selection methods), we use the
weighted F1 score. All experiments are performed on a Core i5 system running the Windows operating system,
32GB memory, and a 2.4 GHz processor. Implementation of the algorithms is done in Python, and the code is
available online1 .

4.1 Dataset Statistics
We used the (aligned) amino acid sequences corresponding to the spike protein from the largest known database
of SARS-CoV-2 sequences, GISAID2 . In our dataset, we have 5 most common variants known to date. More
information related to the dataset is given in Table 1. After preprocessing (removing missing values and truncated
sequences), we end up with 62, 657 amino acid sequences.

 Pango Region Labels
 Num. Mutations Num. of
 Lineage S-gene/Genome sequences
 B.1.1.7 UK [19] Alpha 8/17 13966
 B.1.351 South Africa [19] Beta 9/21 1727
 B.1.617.2 India [43] Delta 8/17 7551
 P.1 Brazil [30] Gamma 10/21 26629
 B.1.427 California [44] Epsilon 3/5 12784
Table 1. Variants information and distribution in the dataset. The S/Gen. column represents number of mutations on the S
gene / entire genome. Total number of amino acid sequences in our dataset is 62, 657.

4.2 Data Visualization
To see if there is any (hidden) clustering in the data, we mapped the data to 2D real vectors using the t-SNE
approach. The visualization using t-SNE for the GISAID dataset (before applying Lasso Regression for feature
selection) is given in Figure 3 (a). We can see that different variants are scattered everywhere. Although there are
small clusters for different variants, we cannot see a clear (complete) cluster for any variant. This analysis shows
that any clustering algorithm (like -means) will not work on such type of data directly. We need to perform
some preprocessing on the data to cluster the variants effectively.
 The visualization using t-SNE for the GISAID dataset (after applying Lasso Regression for feature selection) is
given in Figure 3 (b). We can observe that the clusters are more clearly visible after applying feature selection as
compared to clustering on frequency vectors without (as given in Figure 3 (a)). For example, the Epsilon variant
(orange color dots) in Figure 3 (a) is scattered everywhere, however, it is concentrated to one place (top right
side) in Figure 3 (b). The same behavior can be observed for the Beta variant (blue color dots). The Delta variant
(green color) is concentrated on bottom left side in Figure 3 (b) forming a single cluster.
 We also evaluate if there is any (hidden) clustering in the data corresponding to different countries. We took
the countries with the most COVID-19 infected patients and show the t-SNE plots in Figure 4. We can observe
that there is no clear cluster for any country. Since the mutations in the spike protein take place for different
1 https://github.com/sarwanpasha/Visualization_covid_data
2 https://www.gisaid.org/

 5
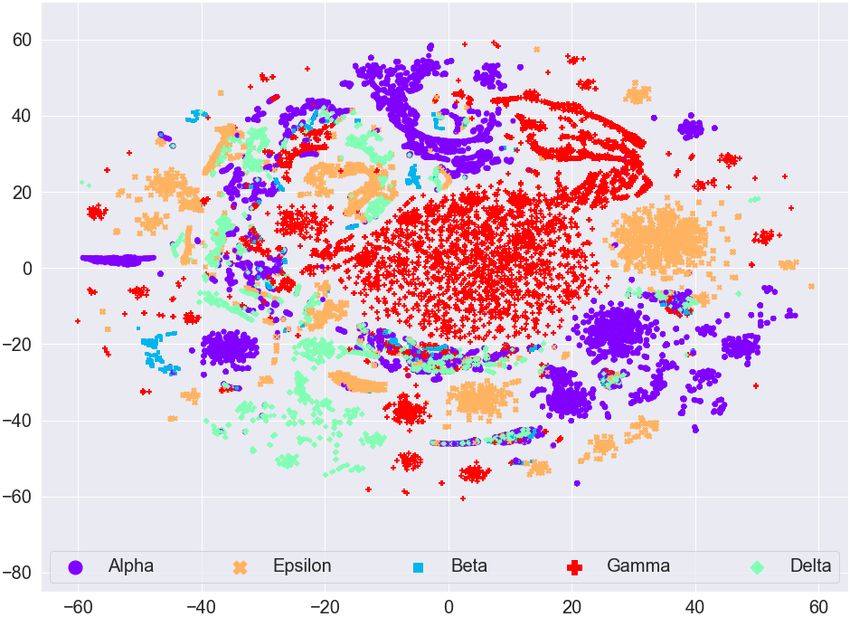
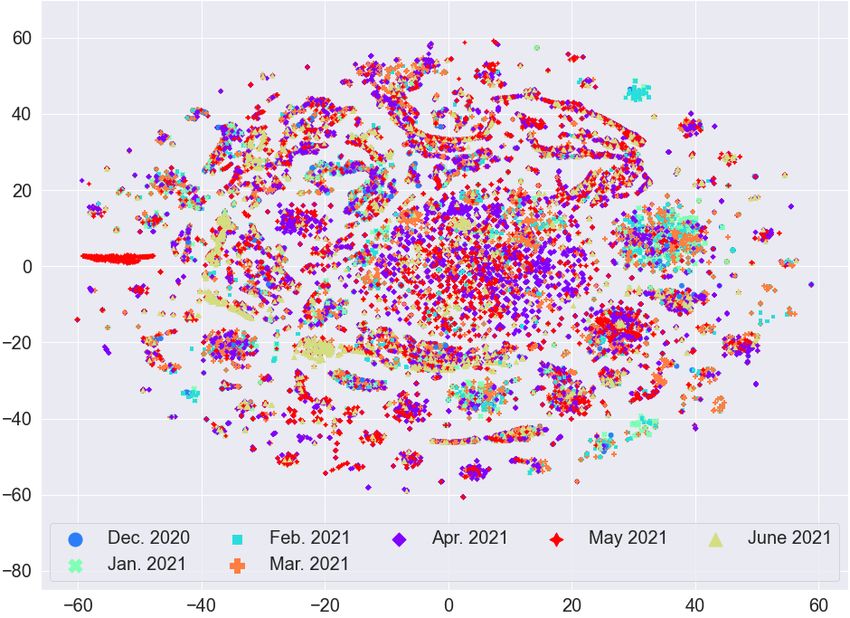
ICBDR, 2021 S. Ali et al.

 (a) Before Lasso Regression (b) After Lasso Regression

 Fig. 3. t-SNE plot for the frequency vectors of GISAID dataset along with the variant information.

variants, and a country can have patients affected by different variants of the coronavirus, we cannot expect any
sort of clustering in this case. Based on these analyses, we evaluate the quality of our clusters using variants
information rather than country information.

 (a) Before Lasso Regression (b) After Lasso Regression

 Fig. 4. t-SNE plot for the frequency vectors of GISAID dataset along with the country information.

 The t-SNE plots for feature vectors (with and without feature selection using Lasso Regression) with month
information are given in Figure 5. We can again observe that there is no clear clustering for any month in the data
(even after the feature selection method). Therefore, since we are unable to find any useful pattern in the data
with respect to month information, we can say that the spread of coronavirus has nothing to do with different
seasons over the years (e.g., summer, spring, winter, etc.).

 6
Effective and scalable clustering of SARS-CoV-2 sequences ICBDR, 2021

 (a) Before Lasso Regression (b) After Lasso Regression

 Fig. 5. t-SNE plot for the frequency vectors of GISAID dataset along with the months information.

5 RESULTS AND DISCUSSION
To compute the quality of a clustering, we use the (weighted) F1 score. We label each cluster using the variant
which labels the majority of sequences in the cluster (e.g., if the majority of the sequences in a cluster belongs to
Alpha variant, we assign the label ‘Alpha’ to that cluster). Now, using these assigned labels, we compute the F1
score for each variant separately. The (weighted) F1 scores for different methods are given in Table 2. We can
see that the F1 scores for -means + Ridge are better than simple -means (the baseline), however, they are not
better than -means + Lasso for the majority of the variants. One behavior that we can observe for all methods
is a low F1 score for the Beta variant. This is due to the much smaller number of sequences available for the Beta
variant (see Table 1).

 F1 Score (Weighted) for Different Variants
 Methods Alpha Beta Delta Gamma Epsilon
 K-means 0.3598 0.1070 0.6110 0.6908 0.6527
 K-means + Ridge 0.9992 0.0058 0.8643 0.9998 0.7748
 K-means + Lasso 0.9987 0.2705 0.9991 0.9998 0.9704
 Table 2. Variant-wise F1 (weighted) score for different clustering methods with = 5 for K-means.

 The contingency tables of variants versus clusters for -means only, -means + Ridge Regression, and -means
+ Lasso Regression are given in Table 3. We can see that the variants are not clearly clustered into separate groups
if we only use -means without any feature selection method. However, with the feature selection methods
(Ridge and Lasso Regression), we can clearly observe that different variants are grouped into their respective
clusters. We can also observe that Lasso Regression based feature selection gives us more accurate clusters
than Ridge Regression based feature selection. Although Lasso Regression gave us 964 features out of 4977 as
compared to 1242 features given by Ridge Regression, those 964 features are a more accurate representation of
the original data (as observed in Table 3).

 7
ICBDR, 2021 S. Ali et al.

 K-means (Clust. IDs) K-means + Ridge (Clust. IDs) K-means + Lasso (Clust. IDs)
 Variants 0 1 2 3 4 0 1 2 3 4 0 1 2 3 4
 Alpha 1512 8762 86 680 2926 6 11415 310 344 1891 6 74 13622 258 6
 Beta 295 601 33 172 626 1 4 1596 109 17 4 37 10 1673 3
 Epsilon 956 7848 187 638 3155 0 1 8688 654 3441 0 4076 1 8705 2
 Delta 2706 2605 30 868 1342 0 0 3126 3996 429 0 111 0 45 7395
 Gamma 682 22140 50 741 3016 26426 13 16 147 27 26566 26 24 12 1
 Table 3. Contingency tables of variants vs clusters.

5.1 Optimal value of K for K-means
We use the elbow method to determine the optimal number of clusters (value of for -means) by fitting the
model with values of ranging from 2 to 14. The quality measure that we use for this analysis is ‘distortion’ that
computes the sum of squared distances from each point to its assigned center. Figure 6 shows the distortion score
for different values of . To observe the trade-off between the runtime and distortion score, we also plot the
(fit/training) runtime (in seconds) in Figure 6 (dashed green line). To determine the optimal value for , we use
“knee point detection algorithm (KPDA)" [33]. We can see in Figure 6 that the ideal number of clusters is 4.
 Since we know that we have 5 variants in our data, we take = 5 throughout the experiments. It is good,
however, to have this independent way of discovering the optimal , and that it is close to the true number. The
most likely reason why KPDA selected 4 as the ideal number of clusters is because the Beta variant is not well
represented in our data (see Table 1). Moreover, the -means algorithm is not very successful in clustering the
Beta variant (as can be seen from its F1 score in Table 2).

Fig. 6. Sum of squared distances (distortion score) for different numbers of clusters using -means. The blue line shows the
distortion score, while the dashed green line shows the runtime (in sec.) for different number of clusters (on the x-axis). The
dashed black line shows the optimal number of clusters computed using Elbow method [33].

 8
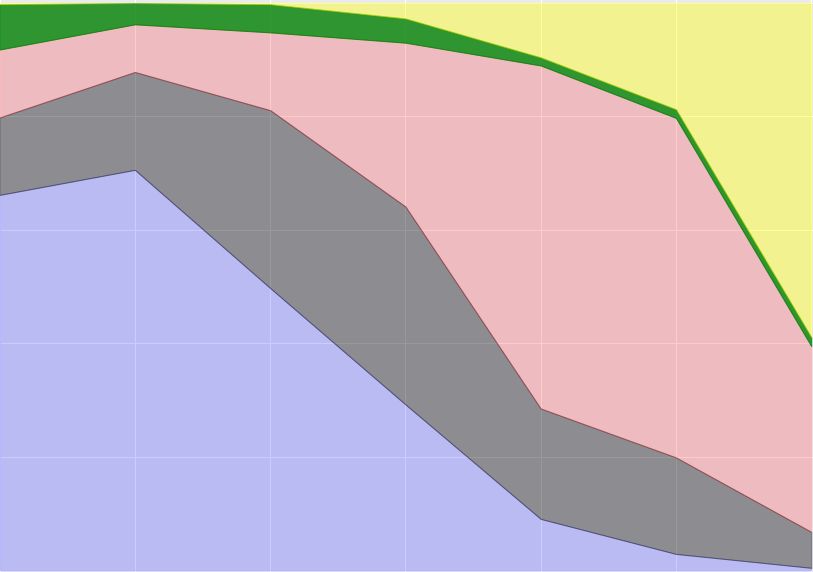
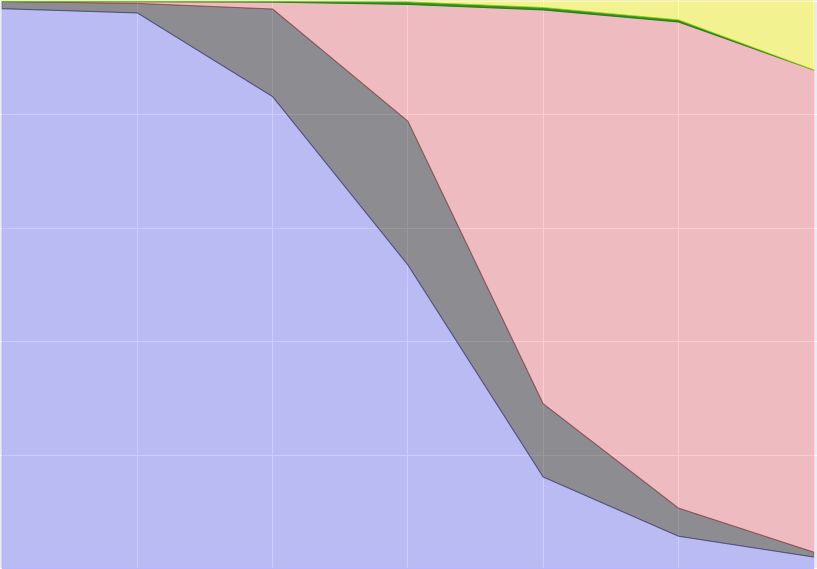
Effective and scalable clustering of SARS-CoV-2 sequences ICBDR, 2021

5.2 The Spread of Variants Over Time
In this section, we analyze the behavior of each variant by considering time as the changing factor. More precisely,
we show how the rate of spread of each variant is changing as time passes (from December 2020 to June 2021).
Figure 7 (a) shows the relative frequencies of different variants corresponding to different months (for all countries
in the data). We applied Lasso + -means clustering on the whole data and computed the relative frequencies of
each variant for different months separately. This study helps us analyze which variants are increasing in number
and which ones are waning over time. We can observe that initially, the Delta variant was very rare (in December
2019). However, in the middle of the year 2021 (from April to June), we can see that the Delta variant is spreading
very quickly. The behavior of the Epsilon variant is opposite to the Delta variant. We can also observe that the
Beta variant is not spreading at an alarming rate, hence there is no threat of the spread of that variant in the near
future.

 1.0
Relative Frequency

 0.8

 0.6

 0.4

 0.2

 0.0
 Dec. Jan. Feb. Mar. Apr. May Jun. Dec. Jan. Feb. Mar. Apr. May Jun. Dec. Jan. Feb. Mar. Apr. May Jun.
 (a) All Countries (b) USA (c) India

Fig. 7. Month-wise relative frequency of each variant based on K-means + Lasso clustering algorithm. After performing
clustering on all data once, we observed the relative frequencies of variants for different months separately (from December
2020 to June 2021).

 Figure 7 (b) and Figure 7 (c) shows the relative frequency of different variants in USA and India, respectively,
from December 2020 to June 2021. We can observe that the Epsilon variant (California variant) was initially
present in high numbers in the USA. However, as time passes (and the vaccination process speeds up), we can
see the drop in the Epsilon variant. We can also observe that from February 2021 onward, the Gamma variant is
spreading at an alarming rate. In the case of India, we can see that, initially, the Alpha variant was the variant of
concern. However, after January 2021, Delta becomes the dominantly spreading variant.

5.3 Importance of Each Amino Acid
We compute Information Gain (IG) between each attribute (amino acid position) Í and the class (variant). The IG
is defined as ( , ) = ( ) − ( | ), where = ∈ − log is the entropy,
and is the probability of the class . The IG values for each attribute are shown in Figure 8 (a higher value is
better). The USA’s Centers for Disease Control and Prevention (CDC) declared mutations at certain positions
from one variant to the other [32]. We use their mutation information to compare them with the attributes having
high IG values in Figure 8. We note that the our high IG value attributes are the same as given by CDC. For

 9
ICBDR, 2021 S. Ali et al.

example, R452L is present in Epsilon, Delta, and Kappa lineages and sub-lineages. Similarly, K417N, E484K, and
N501Y substitutions are present in Beta variant while K417T, E484K, and N501Y substitutions are present in
Gamma variant [32] (see Figure 8). The IG values for each attribute are available online for further analysis3 .

 1

 0.8
 Information Gain

 417 655 1027 1176
 18
 26
 20 484
 0.6
 138190 452501570 681 1118
 13 69 716 982
 0.4

 0.2

 0
 0 300 600 900 1,273

Fig. 8. Information gain each amino acid position with respect to variants. -axis corresponds to amino acid positions in the
spike sequences.

6 CONCLUSION
We propose a clustering-based approach to effectively cluster the variants of SARS-CoV-2 using amino acid
sequences corresponding to the spike region. Our results show that efficient feature selection methods such as
Ridge Regression and Lasso Regression greatly help improve the performance of -means clustering. We also
show the rate of spread of each variant with time in different countries. Finally, we show the importance of each
amino acid position by computing information gain and compare them with the CDC’s provided information for
these same positions.
 In the future, we will work towards using more SARS-CoV-2 sequences with more variants, as the data continues
to accumulate. The idea of using un-supervised feature selection methods would be another interesting future
work.

REFERENCES
 [1] M. Ahmad, S. Ali, J. Tariq, I. Khan, M. Shabbir, and A. Zaman. 2020. Combinatorial trace method for network immunization. Information
 Sciences 519 (2020), 215 – 228.
 [2] M. Ahmad, J. Tariq, M. Farhan, M. Shabbir, and I. Khan. 2016. Who should receive the vaccine?. In Australasian Data Mining Conference
 (AusDM). 137–145.
 [3] M. Ahmad, J. Tariq, M. Shabbir, and I. Khan. 2017. Spectral Methods for Immunization of Large Networks. Australasian Journal of
 Information Systems 21 (2017).
 [4] S. Ali. 2021. Cache Replacement Algorithm. arXiv preprint arXiv:2107.14646 (2021).
 [5] S. Ali, M. Alvi, S. Faizullah, M. Khan, A. Alshanqiti, and I. Khan. 2020. Detecting DDoS Attack on SDN Due to Vulnerabilities in
 OpenFlow. In International Conference on Advances in the Emerging Computing Technologies (AECT). 1–6.
 [6] S. Ali, H. Mansoor, N. Arshad, and I. Khan. 2019. Short term load forecasting using smart meter data. In International Conference on
 Future Energy Systems (e-Energy). 419–421.
 [7] S. Ali, H. Mansoor, I. Khan, N. Arshad, M. Khan, and S. Faizullah. 2020. Short-Term Load Forecasting Using AMI Data. CoRR abs/1912.12479
 (2020).
3 https://github.com/sarwanpasha/Visualization_covid_data/blob/main/correlation_data.csv

 10
Effective and scalable clustering of SARS-CoV-2 sequences ICBDR, 2021

 [8] S. Ali, B. Sahoo, N. Ullah, A. Zelikovskiy, M. Patterson, and I. Khan. 2021. A k-mer Based Approach for SARS-CoV-2 Variant Identification.
 arXiv preprint arXiv:2108.03465 (2021).
 [9] S. Ali, M. Shakeel, I. Khan, S. Faizullah, and M. Khan. 2021. Predicting attributes of nodes using network structure. ACM Transactions on
 Intelligent Systems and Technology (TIST) 12, 2 (2021), 1–23.
[10] M. Atzori et al. 2014. Electromyography data for non-invasive naturally-controlled robotic hand prostheses. Scientific data 1, 1 (2014),
 1–13.
[11] B. Blaisdell. 1986. A measure of the similarity of sets of sequences not requiring sequence alignment. Proceedings of the National
 Academy of Sciences 83 (1986), 5155–5159.
[12] G. Chang et al. 2014. A novel alignment-free method for genome analysis:HIV-1 subtyping and HEV genotyping. Information Sciences
 279 (2014), 776–784.
[13] B. Chowdhury and G. Garai. 2017. A review on multiple sequence alignment from the perspective of genetic algorithm. Genomics 1
 (2017), 419–431.
[14] CNN Health, Tracking Covid-19 global spread. Accessed: 08-12-2021. . https:// edition.cnn.com/ interactive/ 2020/ health/ coronavirus-
 maps-and-cases/ (Accessed: 08-12-2021).
[15] P. Devijver and J. Kittler. 1982. Pattern Recognition: A Statistical Approach. In London, GB: Prentice-Hall. 1–448.
[16] L. du Plessis et al. 2021. Establishment and lineage dynamics of the SARS-CoV-2 epidemic in the UK. Science 371, 6530 (2021), 708–712.
[17] S. K. Dwivedi and S. Sengupta. 2012. Classification of HIV-1 Sequences Using Profile Hidden Markov Models. PLoS ONE 7 (2012).
[18] M. Farhan, J. Tariq, A. Zaman, M. Shabbir, and I. Khan. 2017. Efficient Approximation Algorithms for Strings Kernel Based Sequence
 Classification. In Advances in neural information processing systems (NeurIPS). ., 6935–6945.
[19] S. Galloway et al. 2021. Emergence of SARS-CoV-2 b. 1.1. 7 lineage. Morbidity and Mortality Weekly Report 70, 3 (2021), 95.
[20] GISAID Website. Accessed: 08-04-2021. . https:// www.gisaid.org/ (Accessed: 08-04-2021).
[21] J. Hadfield, C. Megill, S.M. Bell, J. Huddleston, B. Potter, C. Callender, P. Sagulenko, T. Bedford, and R.A. Neher. 2018. Nextstrain:
 real-time tracking of pathogen evolution. Bioinformatics 34 (2018), 4121–4123.
[22] Arthur E Hoerl, Robert W Kannard, and Kent F Baldwin. 1975. Ridge regression: some simulations. Communications in Statistics-Theory
 and Methods 4, 2 (1975), 105–123.
[23] G. Krishnan, S. Kamath, and V. Sugumaran. 2021. Predicting Vaccine Hesitancy and Vaccine Sentiment Using Topic Modeling and
 Evolutionary Optimization. In International Conference on Applications of Natural Language to Information Systems (NLDB). 255–263.
[24] P. Kuksa, I. Khan, and V. Pavlovic. 2012. Generalized Similarity Kernels for Efficient Sequence Classification. In SIAM International
 Conference on Data Mining (SDM). 873–882.
[25] K. Kuzmin et al. 2020. Machine learning methods accurately predict host specificity of coronaviruses based on spike sequences alone.
 Biochemical and Biophysical Research Communications 533 (2020), 553–558.
[26] C. Leslie, E. Eskin, J. Weston, and W. Noble. 2003. Mismatch string kernels for SVM protein classification. In Advances in neural
 information processing systems (NeurIPS). 1441–1448.
[27] Gary C McDonald. 2009. Ridge regression. Wiley Interdisciplinary Reviews: Computational Statistics 1, 1 (2009), 93–100.
[28] A. Melnyk et al. 2020. Clustering based identification of SARS-CoV-2 subtypes. In International Conference on Computational Advances
 in Bio and Medical Sciences. Springer, 127–141.
[29] Bui Quang Minh, Heiko A Schmidt, Olga Chernomor, Dominik Schrempf, Michael D Woodhams, Arndt von Haeseler, and Robert
 Lanfear. 2020. IQ-TREE 2: New Models and Efficient Methods for Phylogenetic Inference in the Genomic Era. Molecular Biology and
 Evolution 37, 5 (2020), 1530–1534. https://doi.org/10.1093/molbev/msaa015
[30] F. Naveca et al. 2021. Phylogenetic relationship of SARS-CoV-2 sequences from Amazonas with emerging Brazilian variants harboring
 mutations E484K and N501Y in the Spike protein. Virological. org 1 (2021).
[31] J Ranstam and JA Cook. 2018. LASSO regression. Journal of British Surgery 105, 10 (2018), 1348–1348.
[32] SARS-CoV-2 Variant Classifications and Definitions. Accessed: 08-01-2021. . https:// www.cdc.gov/ coronavirus/ 2019-ncov/ variants/ variant-
 info.html (Accessed: 08-01-2021).
[33] Ville Satopaa, Jeannie Albrecht, David Irwin, and Barath Raghavan. 2011. Finding a" kneedle" in a haystack: Detecting knee points in
 system behavior. In International conference on distributed computing systems workshops. IEEE, 166–171.
[34] M. Shakeel., A. Karim, and I. Khan. 2019. A Multi-cascaded Deep Model for Bilingual SMS Classification. In International Conference on
 Neural Information Processing (ICONIP). 287–298.
[35] M. Shakeel, A. Karim, and I. Khan. 2020. A Multi-Cascaded Model with Data Augmentation for Enhanced Paraphrase Detection in Short
 Texts. Information Processing & Management 57 (2020), 1–19.
[36] M. H. Shakeel, S. Faizullah, T. Alghamidi, and I. Khan. 2020. Language independent sentiment analysis. In International Conference on
 Advances in the Emerging Computing Technologies (AECT). 1–5.
[37] Z. D. Stephens et al. 2015. Big Data: Astronomical or Genomical? PLoS Biology (2015). https://doi.org/10.1371/journal.pbio.1002195
[38] J. Tariq, M. Ahmad, I. Khan, and M. Shabbir. 2017. Scalable Approximation Algorithm for Network Immunization. In Pacific Asia
 Conference on Information Systems (PACIS). 200.

 11
ICBDR, 2021 S. Ali et al.

[39] Robert Tibshirani. 1996. Regression shrinkage and selection via the lasso. Journal of the Royal Statistical Society: Series B (Methodological)
 58, 1 (1996), 267–288.
[40] A. Ullah, S. Ali, I. Khan, M.A. Khan, and S. Faizullah. 2020. Effect of Analysis Window and Feature Selection on Classification of Hand
 Movements Using EMG Signal. In SAI Intelligent Systems Conference (IntelliSys). 400–415.
[41] L. Van der M. and G. Hinton. 2008. Visualizing data using t-SNE. Journal of Machine Learning Research (JMLR) 9, 11 (2008).
[42] Fan Wu, Su Zhao, Bin Yu, Yan-Mei Chen, Wen Wang, Zhi-Gang Song, Yi Hu, Zhao-Wu Tao, Jun-Hua Tian, Yuan-Yuan Pei, et al. 2020. A
 new coronavirus associated with human respiratory disease in China. Nature 579, 7798 (2020), 265–269.
[43] P. Yadav et al. 2021. Neutralization potential of Covishield vaccinated individuals sera against B. 1.617. 1. bioRxiv 1 (2021).
[44] W. Zhang et al. 2021. Emergence of a novel SARS-CoV-2 variant in Southern California. Jama 325, 13 (2021), 1324–1326.
[45] A. Zielezinski, S. Vinga, J. Almeida, and W. Karlowski. 2017. Alignment-free sequence comparison. Genome Biology 18 (2017).

 12
You can also read