A K-MER BASED APPROACH FOR SARS-COV-2 VARIANT IDENTIFICATION
←
→
Page content transcription
If your browser does not render page correctly, please read the page content below
A k-mer Based Approach for SARS-CoV-2
                                                          Variant Identification

                                            Sarwan Ali1 , Bikram Sahoo1 , Naimat Ullah2 , Alexander Zelikovskiy1 , Murray
                                                                 Patterson1 , and Imdadullah Khan2
arXiv:2108.03465v3 [q-bio.QM] 25 Aug 2021

                                                                1
                                                                  Georgia State University, Atlanta GA, USA
                                                             {sali85,bsahoo1,alexz,mpatterson30}@gsu.edu
                                                      2
                                                          Lahore University of Management Sciences, Lahore, Pakistan
                                                                   {18030048,imdad.khan}@lums.edu.pk

                                                  Abstract. With the rapid spread of the novel coronavirus (COVID-19)
                                                  across the globe and its continuous mutation, it is of pivotal importance
                                                  to design a system to identify different known (and unknown) variants
                                                  of SARS-CoV-2. Identifying particular variants helps to understand and
                                                  model their spread patterns, design effective mitigation strategies, and
                                                  prevent future outbreaks. It also plays a crucial role in studying the efficacy
                                                  of known vaccines against each variant and modeling the likelihood of
                                                  breakthrough infections. It is well known that the spike protein contains
                                                  most of the information/variation pertaining to coronavirus variants.
                                                  In this paper, we use spike sequences to classify different variants of
                                                  the coronavirus in humans. We show that preserving the order of the
                                                  amino acids helps the underlying classifiers to achieve better performance.
                                                  We also show that we can train our model to outperform the baseline
                                                  algorithms using only a small number of training samples (1% of the data).
                                                  Finally, we show the importance of the different amino acids which play a
                                                  key role in identifying variants and how they coincide with those reported
                                                  by the USA’s Centers for Disease Control and Prevention (CDC).

                                            1   Introduction
                                            The novel coronavirus, severe acute respiratory syndrome coronavirus 2 (SARS-
                                            CoV-2), that emerged in late 2019 belongs to the coronaviridae family. SARS-CoV-
                                            2 has an unparalleled capacity for human-to-human transmission and became
                                            the reason for the COVID-19 pandemic. Having witnessed two recent pandemics
                                            caused by coronaviridae, namely SARS-CoV in 2002 and MERS-CoV in 2012,
                                            there was an immediate research interest in studying the zoonotic origin, trans-
                                            missibility, mutation and variants of SARS-COV-2 [24, 25]. SARS-CoV-2 has
                                            a positive-strand RNA genome of about 30Kb and encodes two categories of
                                            proteins: structural and non-structural (see Figure 1). The spike protein is one of
                                            the substantial structural proteins of the virus, having 1160 to 1542 amino acids.
                                            The spike protein’s primary function is to serve as a mechanism for the virus to
                                            enter inside the human cell by binding the ACE2 receptor.
                                               Detailed study of the structure of spike glycoprotein unveils the molecular
                                            mechanism behind host cell recognition, attachment, and admission. Notably,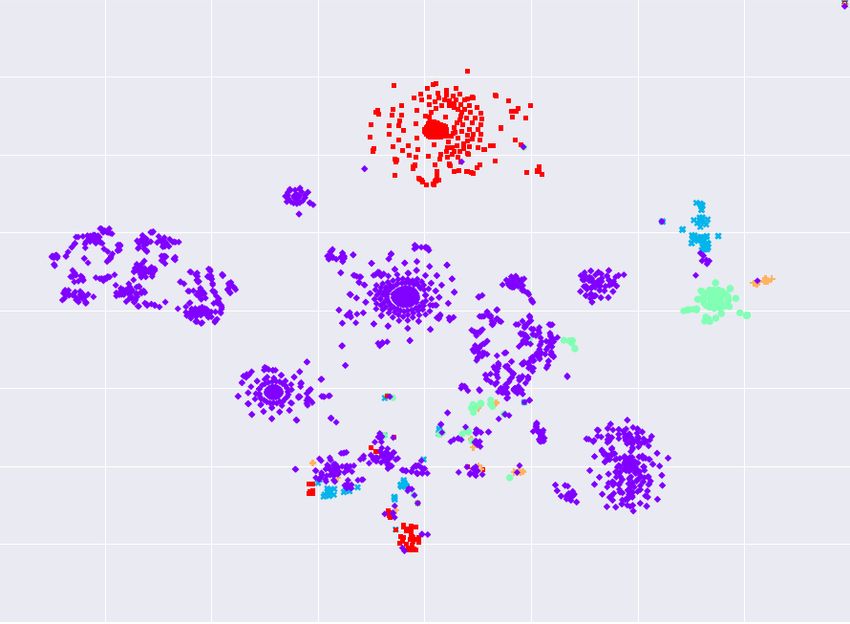
2          S. Ali et al.

the spike glycoprotein of SARS-CoV-2 has two subunits, S1 and S2 , belonging to
the N and C terminals, respectively [18, 24]. The receptor binding domain (RBD)
(≈ 220 amino acids) of the S1 subunit helps the virus attach to the host cell by
binding the ACE2 receptor protein, and the S2 subunit helps to insert into the
cell. SARS-CoV-2 continues to mutate over time, resulting in changes in its amino
acid sequences. The change in the spike protein’s amino acids, specifically in the
RBD, makes the virus more transmissible and adaptable to the human immune
system. In the language of phylogenetics and virology, the virus is creating new
variants and strains by accruing new amino acid changes in the spike protein
and its genome [18, 30, 38, 39]. The state-of-the-art mRNA vaccines train the
host immune system to create specific antibodies that can bind to spike protein,
which leads to preventing the virus from entering inside the host cell. Therefore,
changing amino acids in the spike protein generates new variants which could
potentially be more contagious and more resistant to vaccines [22].

                  266               13, 468                21, 563          25, 384         29, 674
                 50                                                                                  30

                        Non-structural Proteins (ORF1ab)      Structural Proteins (S, E, M, and N)

                                                               Spike Protein(s)

Fig. 1: The SARS-CoV-2 genome is around 29–30kb encoding structural and
non-structural proteins. ORF1ab encodes the non-structural proteins and the
four structural proteins: spike, envelope, membrane, and nucleocapsid encoded
by their respective genes. The spike protein has 1160 to 1542 amino acids.

    In-depth studies of alterations in the spike protein to classify and predict
amino acid changes in SARS-CoV-2 are crucial in understanding the immune
invasion and host-to-host transmission properties of SARS-CoV-2 and its variants.
Knowledge of mutations and variants will help identify transmission patterns
of each variant that will help devise appropriate public health interventions
to prevent rapid spread [2, 3, 36, 1]. This will also help in vaccine design and
efficacy. A massive amount of genomic sequences of SARS-CoV-2 are available
from different parts of the globe, with various clinical, epidemiological, and
pathological information from the GISAID open source database3 . In this study,
we design sophisticated machine learning models which will leverage the open-
source genomic data and metadata to understand, classify and predict the changes
in amino acid in SARS-CoV-2, most notably in its spike protein [22, 25, 27].
    When sequences have the same length and they are aligned, i.e., a one-to-
one correspondence between positions or indices of the sequences is established,
machine learning methods devised for vectors in metric spaces can be employed
for sequence analysis. This approach treats sequences as vectors, considering
each character (e.g., amino acid or nucleotide) as the value of the vector at a
coordinate, e.g., using one-hot encoding [24]. In this case, the order of positions
    3
        https://www.gisaid.org/
A k-mer Based Approach for SARS-CoV-2 Variant Identification 3
loses its significance, however. Since the order of indices in sequences is a defining
factor, ignoring it may result in performance degradation of the underlying
machine learning models.
In representation based data analysis, on the other hand, each data object
is first mapped to a vector in a fixed-dimensional vector space, taking into
account important structure in the data (such as order). Vector space machine
learning algorithms are then used on the vector representations of sequences.
This approach has been highly successful in the analysis of data from various
domains such as graphs [20, 19], nodes in graphs [7], electricity consumption [5, 6]
and images [11]. This approach yields significant success in sequence analysis,
since the features representation takes into account the sequential nature of the
data, such as texts [33, 32, 31], electroencephalography and electromyography
sequences [9, 37], Networks [4], and biological sequences [26, 17, 23, 8]. For
biological sequences (DNA and protein), a feature vector based on counts of
all length k substrings (called k-mers) occurring exactly or inexactly up to m
mismatches (mimicking biological mutations) is proposed in [26]. The kernel value
between two sequences — the dot product between the corresponding feature
vectors — serves as a pairwise proximity measure and is the basis of kernel based
machine learning. We provide the technical definition of feature maps and the
computational aspects of kernel computation in Section 3.
In this paper, our contributions are the following:
1. We propose a method based on k-mers (for feature vector generation) and
kernel approximation (to compute pairwise similarity between spike sequences)
that classify the variants with very high accuracy.
2. We show that spike sequences alone can be used to efficiently classify different
COVID-19 variants.
3. We show that the proposed method outperforms the baseline in terms of
accuracy, precision, recall, F1-measure, and ROC-AUC.
4. We show that with only 1% of the data for training, we can achieve high
prediction accuracy.
The rest of the paper is organised as follow: Section 2 contains the previous
work related to our problem. Section 3 contains the proposed approach of this
paper in detail along with the description of baseline model. Section 4 contains
the information related to different datasets. We show our results in Section 5.
Finally, we conclude the paper in Section 6.
2 Related Work
Phylogeny based inference of disease transmission [14] and sequence homology
(shared ancestry) detection between a pair of proteins are important tasks in
bioinformatics and biotechnology. Sequence classification is a widely studied
problem in both of these domains [22]. Most sequence classification methods for
viruses require the alignment of the input sequence to fixed length predefined
vectors, which enables the machine learning algorithm to compare homologous4 S. Ali et al.
feature vectors [15]. Pairwise local and global alignment similarity scores between
sequences were used traditionally for sequence analysis [13]. Alignment-based
methods are computationally expensive, especially for long sequences, while
heuristic methods require a number of ad-hoc settings such as the penalty
of gaps and substitutions, and alignment methods may not perform well on
highly divergent regions of the genome. To address these limitations, various
alignment-free classification methods have been proposed [17, 12]. The use of
k-mer (substrings of length k) frequencies for phylogenetic applications started
with [10], who reported success in constructing accurate phylogenetic trees from
several coding and non-coding nDNA sequences. Typically, k-mer frequency
vectors are paired together with a distance function to measure the quantitative
similarity score between any pair of sequences [40]. However, the basic bottleneck
for these techniques is the quadratic (in the lengths of the sequences) runtime of
kernel evaluation. Farhan et al. [17] proposed an algorithm for kernel computation
efficiently (see Theorem 1). They provide an approach to compute the approximate
pairwise proximity matrix that can be used for various machine learning tasks
like classification through kernel PCA [21].
With the global outbreak of Covid-19 in 2020, different mutations of its
variants were discovered by the genomics community. Massive testing and large-
scale sequencing produced a huge amount of data, creating ample opportunity
for the bioinformatics community. Researchers started exploring the evolution
of SARS-CoV-2 [16] to vaccine landscapes [34] and long-term effects of covid
to patients [35]. In [25], the authors indicate how the coronavirus spike protein
is fine-tuned towards the temperature and protease conditions of the airways,
to enhance virus transmission and pathology. After the global spread of the
coronavirus, researchers started exploring ways to identify new variants and
measuring vaccine effectiveness. In [29], the authors study genome structures
of SARS-CoV-2 and its previous versions, while [27] explores the genomics and
proteomic variants of the SARS-CoV-2 spike glycoprotein. It is also important
to study the conditional dependencies between the attributes (amino acids) and
the class label (if any such dependency exist). Studying these dependencies can
help finding any (hidden) relationships/dependencies, which in turn can help in
the analysis of the protein sequences.
3 Proposed Approach
Given a set of spike sequences, our goal is to find the similarity score between each
pair of sequences (kernel matrix). The resultant kernel matrix is given as input to
the kernel PCA method for dimensionality reduction. The reduced dimensional
principal components-based feature vector representation is given as input to the
classical machine learning models. We discuss each step in detail below.
3.1 k-mers Computation
For mapping protein sequences to fixed-length vectors, it is important to preserve
the order of the amino acids within a sequence. To preserve the order, we useA k-mer Based Approach for SARS-CoV-2 Variant Identification 5
substrings (called mers) of length k. For each spike sequence, the total number
of k-mers are following:
Total number of k-mers = N − k + 1 (1)
where N is the total number of amino acids in the spike sequence (1274), and
k is a user-defined parameter for the size of each mer. An example of k-mers
(where k = 4) is given in Figure 2.
Fig. 2: Example of k-mers (where k = 4) in a spike sequence "MFVFVFVLPLV".
However, since we do not know the total unique k-mers in all spike sequences,
we need to consider all possible pairs of k-mers to design a general purpose
feature vector representation for spike sequences in a given dataset. In this way,
given an alphabet Σ (a finite set of symbols), we know that a spike sequence
X ∈ Σ (X contains a list of “ordered” amino acids from Σ). Similarly, we can
extract sub-strings (mers) from X of length k, which we called k-mers.
Given X, k, and Σ, we have to design a frequency feature vector Φk (X)
of length |Σ|k , which will contain the exact number of occurrences of each
possible k-mer in X. The distance between two sequences X and Y is then
simply the hamming distance dH (count the number of mismatched values). After
computing the feature vector, a kernel function is defined that measures the
pairwise similarity between pairs of feature vectors (usually using dot product).
The problem we consider so far is the huge dimensionality of the feature vector
|Σ|k that can make kernel computation very expensive. Therefore, in the so-called
kernel trick, kernel values are directly evaluated instead of comparing indices.
The algorithm proposed in [17] takes the feature vectors (containing a count
of each k-mers) as input and returns a real-valued similarity score between each
pair of vectors. Given two feature vectors A and B, the kernel value for these
vectors is simply the dot product of A and B. For example, given a k-mer, if6 S. Ali et al.
the frequency of that k-mer in A is 2 and B is 3, its contribution towards the
kernel value of A and B is simply 2 · 3. The process of kernel value computation
is repeated for each pair of sequences and hence we get a (symmetric) matrix
(kernel matrix) containing a similarity score between each pair of sequences.
Theorem 1. The runtime of the kernel computation is bounded above by O(k 2 n log n)
[17], where k is the length of k-mers and n is the length of sequences
Note that k is a user-defined parameter — in our experiments we use k = 9.
3.2 Kernel PCA
Due to a high-dimensional kernel matrix, we use Kernel PCA (K-PCA) [21] to
select a subset of principal components. These extracted principal components
corresponding to each spike sequence act as the feature vector representations for
the spike sequences (we selected 50 principal components for our experiments).
3.3 Machine Learning Classifiers
Various machine learning algorithms have been utilized for the classification task.
K-PCA output, which is 50 components fed to different classifiers for prediction
purposes. We use Support Vector Machine (SVM), Naive Bayes (NB), Multi-
Layer Perceptron (MLP), K-Nearest Neighbour (KNN) (with K = 5), Random
Forest (RF), Logistic Regression (LR), and Decision Tree (DT) classifiers. For
the training of classifiers, default parameters are used from the literature. All
experiments are done on Core i5 system with Windows 10 OS and 32 GB RAM.
Implementation of our algorithm is done in Python. Our code and pre-processed
datasets are available online 4 . For evaluation of the results, we use Weka software5 .
The evaluation metrics that we are using to measure the goodness of the classifiers
are average accuracy, precision, recall, F1 (weighted), F1 (macro), and receiver
operator curve (ROC) area under the curve (AUC).
3.4 Baseline Model
We consider the approach of [24] as a baseline model. The authors of [24] convert
spike sequences into one-hot encoding vectors that are used to classify the viral
hosts. We have the 21 amino acids “ACDEFGHIKLMNPQRSTVWXY " (unique
alphabets forming Σ). The length of each spike sequence is 1273 (with ∗ at the
1274th location). After converting sequences into one-hot encoding vectors we
will get a 26, 733 dimensional vector (21 × 1273 = 26, 733). Principal Component
Analysis (PCA) on these vectors is applied to reduce dimensionality for the
underlying classifiers. For reference, we use the name “One-Hot” for this baseline
approach in the rest of the paper. For PCA, we select 100 principal components
(see Figure 3).
4
https://github.com/sarwanpasha/covid_variant_classification
5
https://www.cs.waikato.ac.nz/ml/weka/A k-mer Based Approach for SARS-CoV-2 Variant Identification 7
Explained Variance
1
0.8
0.6
0.4
0 50 100 150 200
Fig. 3: Explained variance of principal components for GISAID 1 dataset.
4 Dataset Description and Preprocessing
We sampled three subsets of spike sequences from the largest known database
of Covid-19 in humans, GISAID 6 . We refer to those 3 subsets as GISAID
1, GISAID 2, and GISAID 3, having 7000, 7000, and 3029 spike sequences
(aligned), respectively, each of length 1274 from 5 variants. For GISAID 1 and
GISAID 2 datasets, we preserve the proportion of each variant as given in the
original GISAID database. For GISAID 3 dataset, we use comparatively different
proportion of variants to analyse the behavior of our algorithm. See Table 1 for
more information.
Pango Num mutations Num sequences in
Region Labels
Lineage S-gene/Genome GISAID 1 GISAID 2 GISAID 3
B.1.1.7 UK [18] Alpha 8/17 5979 5979 2055
B.1.351 South Africa [18] Beta 9/21 124 124 133
B.1.617.2 India [38] Delta 8/17 596 596 44
P.1 Brazil [30] Gamma 10/21 202 202 625
B.1.427 California [39] Epsilon 3/5 99 99 182
Table 1: Variants information and distribution in the three datasets. The S/Gen.
column represents number of mutations on the S gene / entire genome.
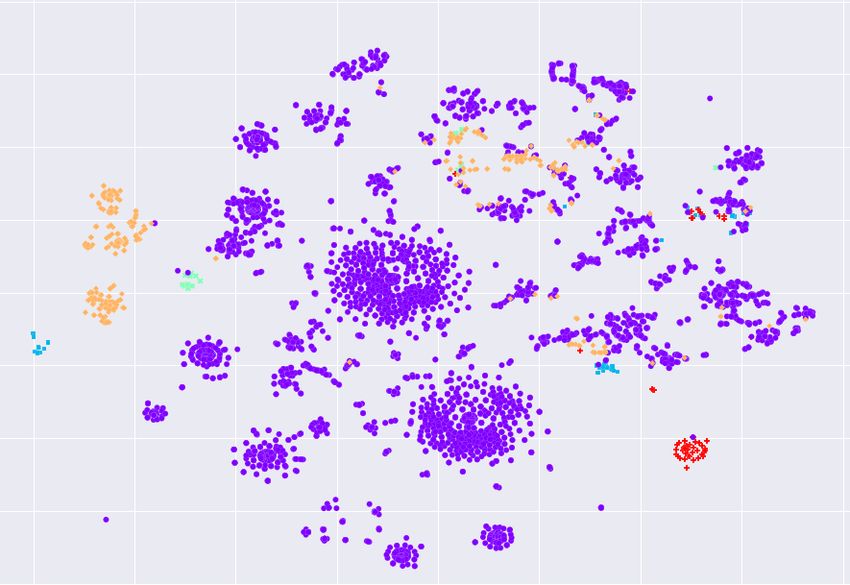
To visualize the local structure of spike sequences, we use t-distributed stochastic
neighbor embedding (t-SNE) [28] that maps input sequences to 2d real vectors.
The t-SNE helps to visualize (hidden) clusters in the data. The visualization
results are shown in Figure 4, revealing that variants are not well separated;
making variant classification a challenging task. It is clear from Figure 4 that the
dominant Alpha variant is not in a single cluster and smaller variants are scattered
around (e.g. the least frequent variant, B.1.427, appears in most clusters).
5 Experimental Evaluation
In this section, we first report the performance of different classifiers using
multiple performance metrics. Then we analyze the importance of the positions
6
https://www.gisaid.org/8 S. Ali et al.
80
60
40
20
0
-20
-40
-60
-80
-80 -60 -40 -20 0 20 40 60 80 -80 -60 -40 -20 0 20 40 60 80 -80 -60 -40 -20 0 20 40 60 80
(a) GISAID 1 (b) GISAID 2 (c) GISAID 3
Fig. 4: t-SNE embeddings of spike sequences.
of each amino acid in the spike sequence using information gain. Results for
the GISAID 1, 2 and 3 datasets are given in Tables 2–4. We present results
for each classifier separately for the baseline method and compare it with our
proposed method. We can observe that for most of the classifiers, our proposed
method is better than the baseline. For example, in the case of SVM classifier,
the one-hot method got 0.962 F1-Macro score for the GISAID 1 dataset while
our proposed model got 0.973, which is a significant improvement considering
that all values are on the higher side. Similar behavior is observed for other
classifiers also. For all of these results, we use 1% data for training and 99% for
testing purposes. Since we are getting such a higher accuracies, we can conclude
that with a minimum amount of available data, we can train a classifier that
can classify different variants very efficiently. Also, we can observe that the SVM
classifier is consistently performing best for all the datasets. Note that results in
Tables 2–4 are averaged over all variants.
We also show the variant-wise performance of our best classifier (SVM).
Table 5 contains the resulting confusion matrices using the kernel based and
One-Hot approaches for GISAID 1. Clearly, the kernel-based approach performs
better than the One-Hot approach for most of the variants.
5.1 Importance of Amino Acid Positions
To evaluate importance positions in spike sequences, we find the subset of positions
contributing the most towards predicting a variant. We use the correlation-based
feature selection (CFS) that evaluates a subset of positions by considering the
individual predictive ability of each feature along with the degree of redundancy
between them. Using the step-wise forward greedy search (SFGS), we select a
subset of features, which are highly correlated with the class (variants) while
having low inter-dependency. SFGS may start with no/all amino acids or from
an arbitrary point in the space and it stops when the addition/deletion of any
remaining amino acids results in a decrease in evaluation. SFGS can also produce
a ranked list of amino acids by traversing the space from one side to the otherA k-mer Based Approach for SARS-CoV-2 Variant Identification 9
Approach ML Acc. Prec. Recall F1 (weighted) F1 (Macro) ROC-AUC
Algo.
SVM 0.990 0.990 0.990 0.990 0.962 0.973
NB 0.957 0.964 0.951 0.952 0.803 0.881
MLP 0.972 0.971 0.975 0.974 0.881 0.923
One-Hot [24] KNN 0.978 0.964 0.977 0.965 0.881 0.900
RF 0.964 0.962 0.961 0.963 0.867 0.878
LR 0.985 0.981 0.983 0.984 0.935 0.950
DT 0.941 0.945 0.947 0.944 0.793 0.886
SVM 0.994 0.994 0.995 0.995 0.973 0.988
NB 0.987 0.985 0.985 0.986 0.901 0.912
MLP 0.975 0.977 0.976 0.978 0.921 0.935
Kernel Approx. KNN 0.979 0.967 0.979 0.967 0.887 0.904
RF 0.981 0.987 0.988 0.980 0.944 0.945
LR 0.992 0.990 0.993 0.992 0.991 0.990
DT 0.985 0.981 0.985 0.987 0.898 0.944
Table 2: Variants Classification Results (1% training set and 99% testing set) for
GISAID 1 Dataset. Best values are shown in bold
Approach ML Acc. Prec. Recall F1 (weighted) F1 (Macro) ROC-AUC
Algo.
SVM 0.994 0.994 0.993 0.992 0.975 0.983
NB 0.912 0.936 0.912 0.920 0.794 0.913
MLP 0.970 0.970 0.970 0.969 0.880 0.921
One-Hot [24] KNN 0.960 0.960 0.960 0.958 0.841 0.863
RF 0.966 0.967 0.966 0.964 0.888 0.885
LR 0.993 0.993 0.993 0.993 0.968 0.973
DT 0.956 0.957 0.956 0.956 0.848 0.913
SVM 0.998 0.997 0.997 0.998 0.998 0.997
NB 0.985 0.988 0.985 0.984 0.946 0.967
MLP 0.973 0.971 0.972 0.970 0.889 0.925
Kernel Approx. KNN 0.965 0.962 0.963 0.967 0.845 0.867
RF 0.990 0.992 0.991 0.996 0.978 0.977
LR 0.997 0.994 0.996 0.997 0.991 0.993
DT 0.991 0.990 0.994 0.996 0.952 0.963
Table 3: Variants Classification Results (1% training set and 99% testing set) for
GISAID 2 Dataset. Best values are shown in bold
and recording the order of amino acids that are selected. The subset of features
selected for each dataset are given in Table 6.
To evaluate individual positions, we measure the Information Gain (IG)
for each position with respect to the variantP defined as IG(Class, position) =
H(Class) − H(Class|position), where H = i∈Class −pi log pi is the entropy,
and pi is the probability of the class i. Figure 5 depicts how informative a position
is to determine variants (higher value is better). We observe that, as in Table 610 S. Ali et al.
Approach ML Acc. Prec. Recall F1 (weighted) F1 (Macro) ROC-AUC
Algo.
SVM 0.988 0.986 0.987 0.982 0.924 0.961
NB 0.764 0.782 0.761 0.754 0.583 0.747
MLP 0.947 0.941 0.944 0.942 0.813 0.898
One-Hot [24] KNN 0.920 0.901 0.924 0.901 0.632 0.773
RF 0.928 0.935 0.922 0.913 0.741 0.804
LR 0.982 0.981 0.983 0.984 0.862 0.921
DT 0.891 0.891 0.890 0.895 0.679 0.807
SVM 0.991 0.993 0.995 0.991 0.989 0.997
NB 0.864 0.922 0.861 0.884 0.783 0.887
MLP 0.926 0.922 0.921 0.923 0.805 0.909
Kernel Approx. KNN 0.947 0.921 0.942 0.934 0.701 0.826
RF 0.975 0.971 0.971 0.972 0.904 0.918
LR 0.991 0.990 0.994 0.990 0.983 0.992
DT 0.960 0.969 0.964 0.967 0.812 0.891
Table 4: Variants Classification Results (1% training set and 99% testing set) for
GISAID 3 Dataset. Best values are shown in bold
Variant Alpha Beta Delta Gamma Epsi. Alpha Beta Delta Gamma Epsi.
Alpha 5373 3 7 0 5 5371 9 5 0 3
Beta 6 110 0 0 0 13 103 0 0 0
Delta 6 0 523 0 0 8 0 521 0 0
Gamma 0 0 0 176 0 0 0 0 176 0
Epsilon 2 0 0 0 89 7 0 3 0 81
Table 5: Confusion matrices for SVM classifiers using kernel approximation
approach(left) and using One-Hot approach(right) for GISAID 1 dataset.
Dataset Total Amino Acids Selected Amino Acids Positions
GISAID 1 10 19, 152, 417, 452, 570, 681, 950, 982, 1118, 1176
GISAID 2 10 19, 152, 417, 452, 570, 681, 950, 982, 1118, 1176
GISAID 3 10 13, 258, 417, 452, 570, 681, 701, 1027, 1118, 1176
Table 6: Subset of positions that contributed the most in variant prediction
positions such as 452, 570 and 681 are more informative across all datasets. The
USA’s CDC also declared mutations at these positions from one variant to the
other, which validates our feature selection algorithm. For instance, R452L is
present in B.1.427(Epsilon) and B.1.617 (Kappa, Delta) lineages and sub-lineages.
The combination of K417N, E484K, and N501Y substitutions are present in
B.1.351 (Beta). Similarly, K417T, E484K, and N501Y substitutions are present
in P.1(Gamma)7 (they can be seen having higher IG in Figure 5).
7
https://www.cdc.gov/coronavirus/2019-ncov/variants/variant-info.htmlA k-mer Based Approach for SARS-CoV-2 Variant Identification 11
1
information gain
0.8
0.6
0.4
0.2
0
0 300 600 900 1,200 0 300 600 900 1,200 0 300 600 900 1,200
GISAID 1 GISAID 2 GISAID 3
Fig. 5: Information gain of each amino acid position with respect to variants.
x-axis corresponds to amino acid positions in the spike sequences.
6 Conclusion and Future Directions
We propose an approach to efficiently classify COVID-19 variants using spike
sequences. Results show that the k-mer based sequence representation outperforms
the typical one-hot encoding approach since it preserves the actual order of amino
acids. We showed the importance of specific amino acids and demonstrate that it
agrees with the CDC definitions of variants. In the future, we will work towards
detecting new (unknown) variants based on the whole genome sequences. Another
exciting future work is considering other attributes like countries, cities, and
dates to design richer feature vector representations for spike sequences.
Bibliography
[1] Ahmad, M., Ali, S., Tariq, J., Khan, I., Shabbir, M., Zaman, A.: Combina-
torial trace method for network immunization. Information Sciences 519,
215 – 228 (2020)
[2] Ahmad, M., Tariq, J., Farhan, M., Shabbir, M., Khan, I.: Who should
receive the vaccine? In: Australasian Data Mining Conference (AusDM). pp.
137–145 (2016)
[3] Ahmad, M., Tariq, J., Shabbir, M., Khan, I.: Spectral methods for immu-
nization of large networks. Australasian Journal of Information Systems 21
(2017)
[4] Ali, S., Alvi, M., Faizullah, S., Khan, M., Alshanqiti, A., Khan, I.: Detecting
ddos attack on sdn due to vulnerabilities in openflow. In: International
Conference on Advances in the Emerging Computing Technologies (AECT).
pp. 1–6 (2020)
[5] Ali, S., Mansoor, H., Arshad, N., Khan, I.: Short term load forecasting using
smart meter data. In: International Conference on Future Energy Systems
(e-Energy). pp. 419–421 (2019)
[6] Ali, S., Mansoor, H., Khan, I., Arshad, N., Khan, M., Faizullah, S.: Short-
term load forecasting using ami data. CoRR abs/1912.12479 (2020)12 S. Ali et al.
[7] Ali, S., Shakeel, M., Khan, I., Faizullah, S., Khan, M.: Predicting attributes
of nodes using network structure. ACM Transactions on Intelligent Systems
and Technology (TIST) 12(2), 1–23 (2021)
[8] Ali, S., Khan, M.A., Khan, I., Patterson, M., et al.: Effective and scalable
clustering of sars-cov-2 sequences. arXiv preprint arXiv:2108.08143 (2021)
[9] Atzori, M., et al.: Electromyography data for non-invasive naturally-
controlled robotic hand prostheses. Scientific data 1(1), 1–13 (2014)
[10] Blaisdell, B.: A measure of the similarity of sets of sequences not requiring
sequence alignment. Proceedings of the National Academy of Sciences 83,
5155–5159 (1986)
[11] Bo, L., Ren, X., Fox, D.: Kernel descriptors for visual recognition. In:
Advances in neural information processing systems (NeurIPS). pp. 244–252
(2010)
[12] Chang, G., et al.: A novel alignment-free method for genome analysis:hiv-1
subtyping and hev genotyping. Information Sciences 279, 776–784 (2014)
[13] Chowdhury, B., Garai, G.: A review on multiple sequence alignment from
the perspective of genetic algorithm. Genomics 1, 419–431 (2017)
[14] Dhar, S., et al.: Tnet: Phylogeny-based inference of disease transmission
networks using within-host strain diversity. In: International Symposium on
Bioinformatics Research and Applications (ISBRA). pp. 203–216 (2020)
[15] Dwivedi, S.K., Sengupta, S.: Classification of hiv-1 sequences using profile
hidden markov models. PLoS ONE 7 (2012)
[16] Ewen, N., Khan, N.: Targeted self supervision for classification on a small
covid-19 ct scan dataset. In: International Symposium on Biomedical Imaging
(ISBI). pp. 1481–1485 (2021)
[17] Farhan, M., Tariq, J., Zaman, A., Shabbir, M., Khan, I.: Efficient approxima-
tion algorithms for strings kernel based sequence classification. In: Advances
in neural information processing systems (NeurIPS). pp. 6935–6945. . (2017)
[18] Galloway, S., et al.: Emergence of sars-cov-2 b. 1.1. 7 lineage. Morbidity and
Mortality Weekly Report 70(3), 95 (2021)
[19] Hassan, Z., Khan, I., Shabbir, M., Abbas, W.: Computing graph descrip-
tors on edge streams (2021), https://www.researchgate.net/publication/
353671195_Computing_Graph_Descriptors_on_Edge_Streams
[20] Hassan, Z., Shabbir, M., Khan, I., Abbas, W.: Estimating descriptors for
large graphs. In: Pacific-Asia Conference on Knowledge Discovery and Data
Mining (PAKDD). pp. 779–791 (2020)
[21] Hoffmann, H.: Kernel pca for novelty detection. Pattern recognition 40(3),
863–874 (2007)
[22] Krishnan, G., Kamath, S., Sugumaran, V.: Predicting vaccine hesitancy and
vaccine sentiment using topic modeling and evolutionary optimization. In:
International Conference on Applications of Natural Language to Information
Systems (NLDB). pp. 255–263 (2021)
[23] Kuksa, P., Khan, I., Pavlovic, V.: Generalized similarity kernels for efficient
sequence classification. In: SIAM International Conference on Data Mining
(SDM). pp. 873–882 (2012)A k-mer Based Approach for SARS-CoV-2 Variant Identification 13
[24] Kuzmin, K., et al.: Machine learning methods accurately predict host speci-
ficity of coronaviruses based on spike sequences alone. Biochemical and
Biophysical Research Communications 533, 553–558 (2020)
[25] Laporte, M., et al.: The sars-cov-2 and other human coronavirus spike
proteins are fine-tuned towards temperature and proteases of the human
airways. bioRxiv (2020)
[26] Leslie, C., Eskin, E., Weston, J., Noble, W.: Mismatch string kernels for svm
protein classification. In: Advances in neural information processing systems
(NeurIPS). pp. 1441–1448 (2003)
[27] Lokman, S., et al.: Exploring the genomic and proteomic variations of
sars-cov-2 spike glycoprotein: A computational biology approach. Infection,
Genetics and Evolution 84, 104389–104389 (2020)
[28] Van der M., L., Hinton, G.: Visualizing data using t-sne. Journal of Machine
Learning Research (JMLR) 9(11) (2008)
[29] Mousavizadeh, L., Ghasemi, S.: Genotype and phenotype of covid-19: Their
roles in pathogenesis. Journal of Microbiology, Immunology and Infection
54, 159–163 (2021)
[30] Naveca, F., et al.: Phylogenetic relationship of sars-cov-2 sequences from
amazonas with emerging brazilian variants harboring mutations e484k and
n501y in the spike protein. Virological. org 1 (2021)
[31] Shakeel., M., Karim, A., Khan, I.: A multi-cascaded deep model for bilin-
gual sms classification. In: International Conference on Neural Information
Processing (ICONIP). pp. 287–298 (2019)
[32] Shakeel, M., Karim, A., Khan, I.: A multi-cascaded model with data aug-
mentation for enhanced paraphrase detection in short texts. Information
Processing & Management 57, 1–19 (2020)
[33] Shakeel, M.H., Faizullah, S., Alghamidi, T., Khan, I.: Language independent
sentiment analysis. In: International Conference on Advances in the Emerging
Computing Technologies (AECT). pp. 1–5 (2020)
[34] Su, S., Du, L., Jiang, S.: Learning from the past: development of safe and
effective covid-19 vaccines. Nature Reviews Microbiology 19(3), 211–219
(2021)
[35] Tankisi, H., et al.: Critical illness myopathy as a consequence of covid-19
infection. Clinical Neurophysiology 131(8), 1931 (2020)
[36] Tariq, J., Ahmad, M., Khan, I., Shabbir, M.: Scalable approximation algo-
rithm for network immunization. In: Pacific Asia Conference on Information
Systems (PACIS). p. 200 (2017)
[37] Ullah, A., Ali, S., Khan, I., Khan, M., Faizullah, S.: Effect of analysis window
and feature selection on classification of hand movements using emg signal.
In: SAI Intelligent Systems Conference (IntelliSys). pp. 400–415 (2020)
[38] Yadav, P., et al.: Neutralization potential of covishield vaccinated individuals
sera against b. 1.617. 1. bioRxiv 1 (2021)
[39] Zhang, W., et al.: Emergence of a novel sars-cov-2 variant in southern
california. Jama 325(13), 1324–1326 (2021)
[40] Zielezinski, A., Vinga, S., Almeida, J., Karlowski, W.: Alignment-free se-
quence comparison. Genome Biology 18 (2017)You can also read