COVID 19 patients with hypertension are at potential risk of worsened organ injury - Nature
←
→
Page content transcription
If your browser does not render page correctly, please read the page content below
www.nature.com/scientificreports
OPEN COVID‑19 patients
with hypertension are at potential
risk of worsened organ injury
Fei Xia 1,5*, Mingwei Zhang 1,5, Bo Cui 2,5, Wei An1, Min Chen1, Ping Yang1, Tao Qin1,
Xiaoyang Zhou2, Yaling Liao1, Xin Xu1, Shiguo Liu1, Kuangyu Li1, Qin Zhou1, Keke Wang3,
Guangxu Hu1, Ming Du1, Songrui Chen1, Yafang Zhang1, Wei Wei1, Ming Xiang 4 &
Jianjun Zhang1*
In less than 6 months, COVID-19 spread rapidly around the world and became a global health concern.
Hypertension is the most common chronic disease in COVID-19 patients, but its impact on these
patients has not been well described. In this retrospective study, 82 patients diagnosed with COVID-
19 were enrolled, and epidemiological, demographic, clinical, laboratory, radiological and therapy-
related data were analyzed and compared between COVID-19 patients with (29 cases) or without
(53 cases) hypertension. The median age of the included patients was 60.5 years, and the cohort
included 49 women (59.8%) and 33 (40.2%) men. Hypertension (31 [28.2%]) was the most common
chronic illness, followed by diabetes (16 [19.5%]) and cardiovascular disease (15 [18.3%]). The most
common symptoms were fatigue (55 [67.1%]), dry cough (46 [56.1%]) and fever ≥ 37.3 °C (46 [56.1%]).
The median time from illness onset to positive RT-PCR test was 13.0 days (range 3–25 days). There
were 6 deaths (20.7%) in the hypertension group and 5 deaths (9.4%) in the nonhypertension group,
and more hypertensive patients with COVID-19 (8 [27.6%]) than nonhypertensive patients (2 [3.8%])
(P = 0.002) had at least one comorbid disease. Compared with nonhypertensive patients, hypertensive
patients exhibited higher neutrophil counts, serum amyloid A, C-reactive protein, and NT-proBNP and
lower lymphocyte counts and eGFR. Dynamic observations indicated more severe disease and poorer
outcomes after hospital admission in the hypertension group. COVID-19 patients with hypertension
have increased risks of severe inflammatory reactions, serious internal organ injury, and disease
progression and deterioration.
In 2020, COVID-19 spread rapidly around the globe, and the disease remains an international public health
concern1. As a betacoronavirus in the 2β lineage, SARS-CoV-2 shares 79.5% sequence identity with SARS-CoV
and 96% identity to a bat coronavirus at the whole-genome level2. By September 2020, the virus had spread to
nearly 200 countries and regions, infecting more than 28 million people and killing nearly 1 million.
SARS-CoV-2 can infect multiple systems and organs through the binding of its spike protein to angioten-
sin converting enzyme II (ACE2); the SARS-CoV-2 spike has a higher affinity than the SARS-CoV spike for
ACE2. As a functional receptor, the ACE2 protein is abundantly expressed in the epithelia of the human lung
and small intestine3. Thus, the clinical spectrum of SARS-CoV-2 infection is broad, including fever, cough,
dyspnea, decreased leukocyte counts or white blood cell counts, mild upper respiratory tract illness, and severe
viral pneumonia4. System or organ malfunction, including shock, acute respiratory distress syndrome (ARDS),
acute cardiac injury, and even death, can also occur in severe cases5. It is worth nothing that variations in the
ACE system, including in ACE1 and ACE2, also contribute to the occurrence of h ypertension6. However, the
specific effects of SARS-CoV-2 infection on individuals with hypertension are unknown, and it is unclear whether
hypertensive individuals with COVID-19 are at greater risk of serious outcomes4,7,8. In this study, we aimed to
describe the epidemiology, clinical features, and pharmacotherapy response of COVID-19 inpatients and to
1
Department of Clinical Pharmacy, Hubei No. 3 People’s Hospital of Jianghan University (the Third People’s
Hospital of Hubei Province), Wuhan, China. 2Department of Cardiology, Renmin Hospital of Wuhan University,
Cardiovascular Research Institute of Wuhan University, Wuhan, China. 3Department of Pharmacy, The First
Affiliated Hospital of China Medical University, Shenyang, Liaoning, China. 4Department of Pharmacology, School
of Pharmacy, Tongji Medical College, Huazhong University of Science and Technology, Wuhan, China. 5These
authors contributed equally: Fei Xia, Mingwei Zhang, and Bo Cui. *email: 53042940@qq.com; 2858147149@
qq.com
Scientific Reports | (2021) 11:3779 | https://doi.org/10.1038/s41598-021-83295-w 1
Vol.:(0123456789)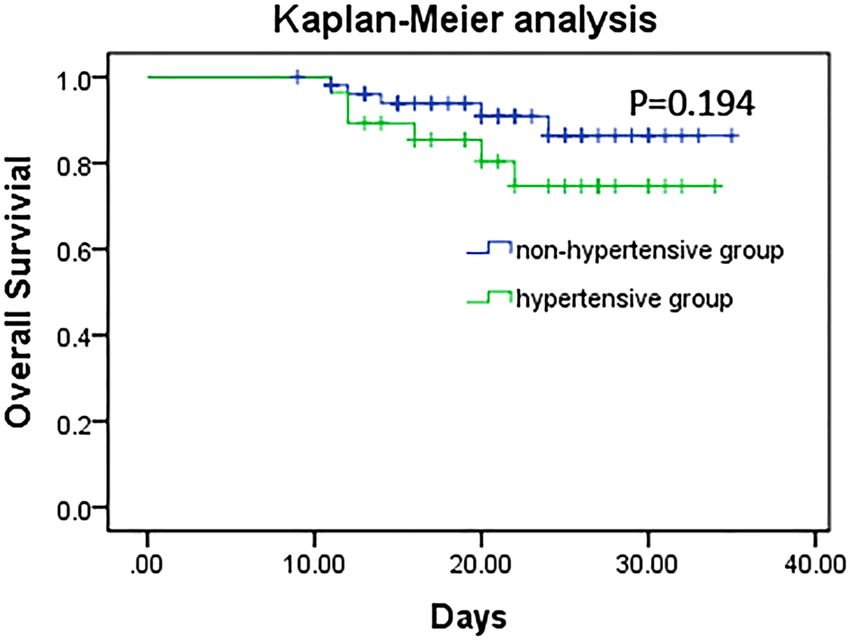
www.nature.com/scientificreports/
further compare the available data between hypertensive and nonhypertensive patients admitted to Hubei No.
3 People’s Hospital of Jianghan University (the Third People’s Hospital of Hubei Province).
Methods
Study design and participants. This retrospective, single-center, observational study was conducted at
Hubei No. 3 People’s Hospital of Jianghan University, Wuhan, China. Patients were hospitalized from Dec 31,
2019, to Feb 01, 2020, and the final date of follow-up was February 08, 2020. Hubei No. 3 People’s Hospital of
Jianghan University is a designated COVID-19 hospital with more than 1500 beds. The diagnosis of COVID-19
was made based on the current New Coronavirus Pneumonia Prevention and Control Program (6th edition,
in Chinese) released by the National Health Commission of China9 and was indicated by suspected symptoms,
chest CT results and SARS-CoV-2 positivity on quantitative RT-PCR. Throat-swab specimens from all patients
were collected at admission and kept in virus transport medium. Briefly, SARS-CoV-2 detection in respiratory
specimens was conducted by the Chinese Center for Disease Control and Prevention, the Chinese Academy
of Medical Science, the Academy of Military Medical Sciences, and the Wuhan Institute of Virology, the Chi-
nese Academy of Sciences using real-time RT-PCR or next-generation sequencing technology. Other respira-
tory viruses, including influenza A virus (H1N1, H3N2, H7N9), influenza B virus, respiratory syncytial virus,
parainfluenza virus, adenovirus, SARS coronavirus (SARS-CoV), and MERS coronavirus (MERS-CoV), were
also detected by real-time RT-PCR. Sputum or endotracheal aspirates were also examined to identify potential
pathogenic bacteria or fungi. Chest computed tomographic (CT) scans were carried out at least twice for each
patient.
Patients hospitalized with COVID-19 are clinically classified as having mild, moderate, or severe disease,
defined as follows: mild cases: mild clinical symptoms, no manifestations of pneumonia on imaging; moderate
cases: symptoms such as fever and respiratory tract symptoms and imaging showing signs of pneumonia; severe
cases: respiratory distress, respiratory rate ≥ 30 breaths/min, SpO2 ≤ 93% at rest, or PaO2/FIO2 ratio ≤ 300. In
addition, cases with > 50% lesions progressing within 24 to 48 h on pulmonary imaging are considered severe.
Ethical approval. The research protocol was reviewed and approved by the Ethics Committee of Hubei
No. 3 People’s Hospital of Jianghan University (202004). All procedures were carried out in accordance with the
ethical standards of the institutional and/or national research committee and the 1964 Declaration of Helsinki.
All patients had completed treatment at the beginning of the study, and the study did not interfere with diag-
nosis or treatment in any case. Therefore, the need for informed consent was waived by the Ethics Committee
of Hubei No. 3 People’s Hospital of Jianghan University. In addition, all patient privacy and data were respected
and protected.
Data collection. Eighty-two patients hospitalized with COVID-19 were included in this retrospective study,
and 29 of these patients also had hypertension. Epidemiological, demographic, clinical, laboratory, X-ray and
chest CT scan, treatment, and outcome data were extracted from electronic medical records with data collection
forms. Eight researchers, including physicians and clinical pharmacists, reviewed the data collection forms and
examined the data independently three times. COVID-19 patients were divided into two groups according to
the presence or absence of hypertension. Hypertension was defined as clinic systolic blood pressure ≥ 140 mmHg
and/or diastolic blood pressure ≥ 90 mmHg without the use of antihypertensive medications. Subjects with a
blood pressure < 140/90 mmHg but with a history of hypertension and who were taking antihypertensive medi-
cation at the time of admission were also included in the hypertension g roup10.
Statistical analysis. Categorical variables are reported as frequencies and percentages. Continuous vari-
ables are reported as mean (SD), median, and interquartile range (IQR) values. Comparisons of quantitative
variables between groups were performed by the Wilcoxon rank sum test. Categorical variables are expressed as
numbers (%) and were compared between groups using χ2 or Fisher’s exact tests. A two-sided p-value less than
0.05 was considered statistically significant. Statistical analysis was performed in SPSS (version 21.0).
Results
Baseline characteristics of hospitalized COVID‑19 patients on admission. Figure 1 shows the
flow chart for participant inclusion. Briefly, 295 cases with dates from Dec 31, 2019, to Feb 28, 2020, in the medi-
cal record system were initially screened, of which 213 were considered ineligible, including 73 cases admitted
after 01 Feb, 23 cases without confirmed COVID-19 diagnosis, 22 duplicate records, 43 cases without avail-
able medical information, and 52 cases with missing core examination or therapy information. Ultimately, 82
patients were included in this study. The median age of the included patients was 60.5 years, and 49 (59.8%) were
women (Table 1). The median time from first symptom to hospital admission was 7.0 days. Hypertension (29
[35.4%]) was the most common coexisting chronic illness, followed by diabetes (16 [19.5%]) and cardiovascular
disease (15 [18.3%]). Fatigue (55 [67.1%]), dry cough (46 [56.1%]), and fever ≥ 37.3 °C (46 [56.1%]) were the
most common symptoms. The median time from illness onset to positive RT-PCR test was 13.0 days (range
3–25 days). A significant difference in clinical types on admission was observed (P < 0.001) between the two
groups. There was no significant difference in mortality rate between the hypertension group (6 [20.7%]) and the
nonhypertension group (5 [9.4%]). Furthermore, no significant difference between the two groups was observed
in the survival analysis (Fig. 2).
Scientific Reports | (2021) 11:3779 | https://doi.org/10.1038/s41598-021-83295-w 2
Vol:.(1234567890)www.nature.com/scientificreports/
Figure 1. Flow chart for participant inclusion.
Laboratory markers in patients with or without hypertension. Major laboratory markers were
recorded at hospital admission for all patients (Table 2). There were no significant differences in routine blood
analysis parameters between the hypertension and nonhypertension groups. However, the hypertension group
exhibited higher white blood cell counts (4.9 × 10⁹/L), neutrophil counts (3.9 × 10⁹/L), and neutrophil percent-
ages (79.3%) and lower lymphocyte counts (0.72 × 10⁹/L) and lymphocyte percentages (12.5%). Moreover, the
median SAA in the hypertension group reached 630.1 mg/L, which was approximately double that (373.5 mg/L)
in the nonhypertension group. Similarly, the median CRP level (79.2 mg/L) also exceeded that of the non-
hypertension group (57.8 mg/L). In blood chemistry assays, no significant changes were found in AST (32.4
U/L vs 34.1 U/L), ALT (23.0 U/L vs 26.3 U/L), and GGT (29.0 U/L vs 30.3 U/L) between the two groups, and
all medians were within the normal ranges. For renal injury, eGFR in hypertension group with COVID-19
was significantly decreased compared with that of nonhypertensive group (77.0 mL/min/1.73 m2 vs 113.0 mL/
min/1.73 m2) (P = 0.017), while higher levels of urea nitrogen (4.7 mmol/L vs 4.2 mmol/L) and serum creatinine
(70.5 μmol/L vs 57.0 μmol/L) were observed in the hypertension group. There were also elevated levels of NT-
proBNP (166 ng/L vs 26 ng/L), lactate dehydrogenase (263.0 U/L vs 240.0 mU/L), and creatine kinase (143.0 U/L
vs 64.0 U/L), with a significant increase in NT-proBNP in the hypertension group with COVID-19.
Imaging findings. Of all 82 nonmedical COVID-19 patients on admission (Table 3), 14 (17.1%) patients
showed unilateral pneumonia, and 64 (78.3%) developed bilateral pneumonia. Twenty-eight (34.2%) patients
showed patchy shadows, while 22 (26.8%) patients showed multiple patchy shadows. Twenty-two (26.8%)
patients also displayed ground glass opacities. In addition, hydrothorax occurred in 9 (11.0%) patients.
Organ injuries and main treatments. On admission, common complications among 82 patients
included ARDS (9 [11.0%]), sepsis (3 [3.7%]), acute renal injury (1 [1.2%]), and acute respiratory injury (1
[1.2%]) (Table 4). Although the differences between the two groups failed to reach statistical significance on
hospital admission, the laboratory outcomes suggested that patients with hypertension had higher risks of mul-
tiple organ injuries in the kidney, heart, and lung. For COVID-19 treatment, 63 (76.8%) patients received anti-
viral therapy, including oseltamivir (56 [50.9%]), arbidol (46 [41.8%]), lopinavir/ritonavir (42 [38.2%]), and
ganciclovir (28 [25.4%]). Many patients received glucocorticoid therapy (73 [89.0%]) and antibacterial therapy
(55 [67.1]), including carbapenems (22 [20.0%]), quinolones (33 [30.0%]), and cephalosporins (14 [12.7%]).
Fifty-five (67.1%) patients received both antiviral and antibacterial therapies. Oxygen therapy (24 [29.3%]) and
immune globulin γ treatment (42 [51.3%]) were also applied.
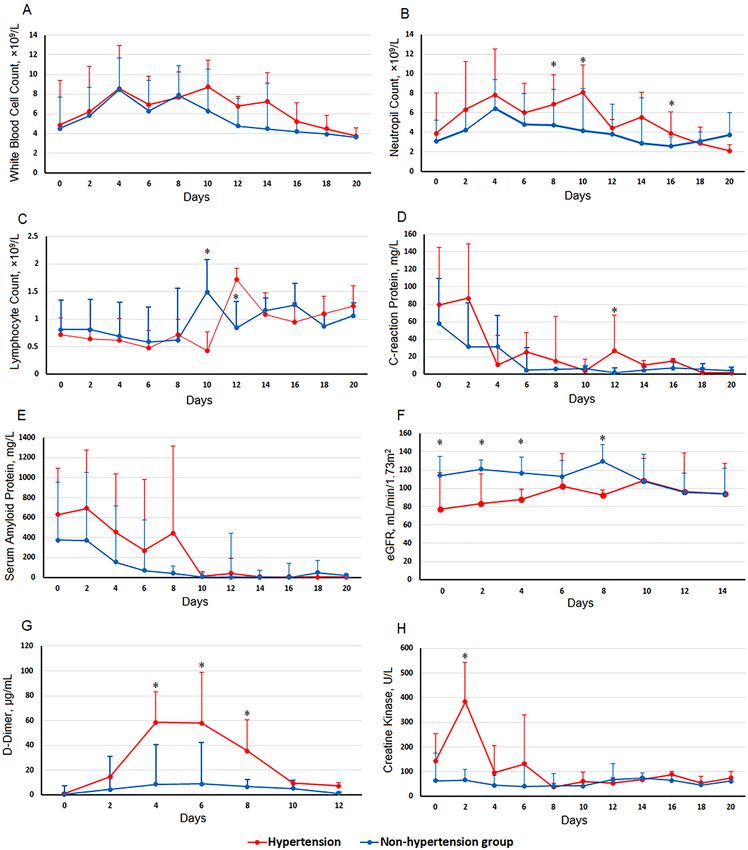
Dynamic characteristics of laboratory parameters in COVID‑19 patients with or without hyper-
tension. The dynamic laboratory features of COVID-19 patients, including 8 clinical parameters related to
hematology, infection, coagulation function, and internal organ injury, were traced from hospital admission to
20 days in the hospital at a 2-day interval on the basis of no significant difference observed at hospital admission
between the two groups (Table 1). As shown in Fig. 3A and B, white blood cell and neutrophil counts were higher
in the hypertension group than in the nonhypertension group for almost the whole duration of hospitalization.
Most patients had notable lymphopenia, with a 2-day delay in lymphocyte count increasing to the normal range
compared to the nonhypertension group (Fig. 3C). Both CRP and SAA were higher in the hypertension group
until 10 days after admission (Fig. 3D and E). The eGFR of patients with hypertension was markedly lower than
that of nonhypertensive patients, maintaining an overall slow increase from the day of admission but a slight
decrease from its peak on day 10; by contrast, there was a reduction of approximately 30 mL/min/1.73 m2 in the
Scientific Reports | (2021) 11:3779 | https://doi.org/10.1038/s41598-021-83295-w 3
Vol.:(0123456789)www.nature.com/scientificreports/
Nonhypertension group
All patients (n = 82) Hypertension group (n = 29) (n = 53) χ2/Z P
Age, years 60.5 (46.8–69.0) 66.0 (56.5–69.0) 57.0 (40–68.5) − 10.61 < 0.001
Female age 60.0 (44.0–69.0) 66.5 (57.8–71.5) 63.5 (56.8–70.3) − 14.798 < 0.001
male age 61.0 (46.5–69) 63.0 (53.0–69.0) 57.5 (44.0–71.5) − 0.967 0.334
Sex
Female 49 (59.8) 14 (48.3) 19 (35.8)
1.204 0.273
Male 33 (40.2) 15 (51.7) 34 (64.2)
Clinical type on admission
Mild 3 (3.7) 0 (0.0) 3 (5.7)
Moderate 68 (82.9) 23 (79.3) 45 (84.9) 43.931 < 0.001
Severe 11 (13.4) 6 (20.1) 5 (9.4)
Illness onset to hospital
7.0 (4.0–10.0) 7 (5.5–10) 7 (4–10) − 1.129 0.259
admission, days
Chronic illnesses
Hypertension 29 (35.4) 29 (100.0) 0 (0) – –
Cardiovascular disease 15 (18.3) 9 (31.0) 6 (11.3) 4.814 0.028
Diabetes 16 (19.5) 8 (27.6) 8 (15.1) 1.862 0.172
COPD 7 (8.5) 4 (13.8) 3 (5.7) 1.568 0.210
Malignancy 1 (1.2) 0 (0.0) 1 (1.9) 0.547 0.459
Digestive system disease 3 (3.7) 2 (6.9) 1 (1.9) 1.318 0.251
Cerebrovascular disease 2 (2.4) 2 (6.9) 0 (0.0) 3.747 0.054
Nervous system disease 3 (3.7) 1 (3.4) 2 (3.8) 0.006 0.941
Chronic liver disease 3 (3.7) 3 (10.3) 0 (0.0) 5.622 0.018
More than one disease 10 (12.2) 8 (27.6) 2 (3.8) 9.926 0.002
Signs and symptoms
Fever (≥ 37.3 °C) 46 (56.1) 13 (44.8) 33 (62.2) 2.314 0.128
≥ 38 °C 28 (34.1) 6 (20.7) 22 (41.5) 3.361 0.057
Fatigue 55 (67.1) 16 (55.2) 39 (73.6) 2.877 0.090
Dry cough 46 (56.1) 13 (44.8) 33 (62.3) 2.314 0.128
Shortness of breath 23 (28.0) 7 (24.1) 16 (30.2) 0.34 0.560
Diarrhea 15 (18.3) 7 (24.1) 8 (15.1) 1.026 0.311
Anorexia 10 (12.2) 1 (3.4) 9 (17.0) 3.167 0.075
Myalgia 9 (15.1) 3 (10.3) 6 (11.3) 0.018 0.893
Expectoration 20 (24.3) 10 (34.4) 10 (18.9) 2.478 0.115
Pharyngalgia 4 (4.9) 2 (6.9) 2 (3.8) 0.389 0.533
Nausea or vomiting 7 (8.5) 2 (6.9) 5 (9.4) 0.155 0.694
Dyspnea 5 (6.1) 2 (6.9) 3 (5.7) 0.049 0.824
More than three signs and
40 (48.9) 17 (58.6) 23 (434) 1.739 0.187
symptoms
Time from illness onset to
13 (6.0–19.0) 13.0 (6.0–20.0) 12.5 (6.0–15.5) − 0.372 0.743
positive RT-PCR test, days
Deaths 11 (13.4) 6 (20.7) 5 (9.4) 2.044 0.153
Female 5 (4.5) 3 (10.3) 2 (3.8)
0.100 0.752
Male 6 (5.4) 3 (10.3) 3 (5.7)
Time from onset to hospital
7.0 (5.0–10.0) 7.0 (5.0–8.0) 10 (5.5–20) − 0.746 0.456
admission, days
Time from admission to
6.0 (4.0–12.0) 7.5 (3.0–12.5) 4.0 (2.5–9.5) − 0.737 0.461
death, days
Time from onset to death,
13.0 (10.5–19.5) 13.5 (10.5–19.5) 11.0 (10.5–28.5) − 0.184 0.854
days
Table 1. Demographics and clinical characteristics of patients with COVID-19 on admission. Data are
presented as the median (IQR) or n/N (%), where N is the total number of patients with available data. p values
comparing patients with or without hypertension cases are from χ2, Fisher’s exact test, or Wilcoxon rank sum
test. COVID-19 coronavirus disease 2019, IQR interquartile range, COPD Chronic Obstructive Pulmonary
Disease.
Scientific Reports | (2021) 11:3779 | https://doi.org/10.1038/s41598-021-83295-w 4
Vol:.(1234567890)www.nature.com/scientificreports/
Figure 2. Survival analysis between the hypertension group and the nonhypertension group.
eGFR of the nonhypertension group from days 8 to 14 (Fig. 3F). The creatine kinase level in the hypertension
group was higher on admission, increased to approximately 400 U/L on day 2, and then decreased (Fig. 3H).
Similarly, the level of D-dimer in the hypertension group continued to increase until day 4 after admission or day
11 from onset and then declined after day 6 (Fig. 3G).
Discussion
In this investigation, we studied the epidemiology, clinical characteristics, and treatment of COVID-19, with
a particular focus on potential differences in the disease course in the hypertensive population. Among the 82
included COVID-19 patients, there were 11 deaths (13.4%), which was consistent with the overall COVID-19
mortality rate at Jinyintan Hospital during the same p eriod8. Nevertheless, national data showed that the case
fatality had dropped to 2.3% by February 1 111, suggesting that SARS-CoV-2 was more lethal at the early stage
of the outbreak in January12.
Previously, hypertension has been identified as the most common chronic illness in more COVID-19
patients4,5,13,14. ACE2 is the receptor that mediates SARS-CoV-2 invasion in COVID-19, identical to SARS-CoV
transmission, via the spike (S) glycoprotein–ACE2 binding p athway15–18. After infection, the ACE2 level was
found to be reduced due to binding with the spike protein of SARS-CoV19, suggesting that SARS-CoV-2 may
also reduce the level of ACE2 in infected cells, resulting in an imbalance between ACE1 and ACE2. Second, the
renin-angiotensin II-aldosterone axis has been traditionally recognized as a key regulator of blood pressure in
the development of hypertension, with AngII levels regulated by ACE. The balance between ACE1 and ACE2 is
crucial for controlling the level of AngII. Thus, due to the imbalance of ACE1 and ACE2 induced by virus infec-
tion, the hypertensive population may tend to experience more serious organ injury.
In hypertensive COVID-19 patients, more severe clinical types or mortality were observed, suggesting that
hypertension might be associated with the clinical outcomes of COVID-19. Our study also found that 31.0% of
hypertensive patients also had other forms of cardiovascular disease, which has been associated with an increased
risk of death in COVID-19 p atients13,20. However, hypertension remains the most important risk factor leading
to cardiovascular disease21. Accordingly, preexisting hypertension, rather than cardiovascular disease, might
be the underlying cause of increased susceptibility to rapid disease progression and more severe COVID-19.
Laboratory results provided some evidence for this hypothesis. Hypertensive COVID-19 patients presented
elevated levels of serum urea nitrogen, serum creatinine, lactate dehydrogenase, creatine kinase, and NT-proBNP
and markedly reduced eGFR at admission. These altered parameters indicate that internal organs with high levels
of ACE2 protein expression, such as the lung, kidney, and h eart3,22, are more vulnerable to invasion and injury by
SARS-COV-2. Simultaneously, SAA and CRP, which reflect systemic inflammation throughout the body, were
also elevated. These results indicate that hypertensive patients tended to develop more severe COVID-19 not only
through serious cytokine storms but also through reduced protection against organ injury due to imbalances in
the ACE s ystem23–25. Thus, the delay from illness onset to hospital admission could result in an increased risk of
severe illness or death in hypertensive patients with COVID-19.
More dynamic changes were observed in hypertensive COVID-19 patients. White blood cell and neutrophil
counts remained higher in the hypertension group than in the nonhypertension group for almost the entire
period of hospitalization; SAA and CRP continued to increase until approximately 10 days after admission. In
contrast with the nonhypertension group, in the hypertension group, lymphocyte counts continued to decline
until 10 days after admission and returned to the normal range 2 days later. These findings suggested that more
serious cytokine storms occurred in hypertensive COVID-19 patients.
Notably, in addition to ACE2, other receptors on the surface of human cells can facilitate the entry of
SARS-COV-2, including T MPRSS226, sialic acid receptors27, and CD14728. Intriguingly, all of these factors are
expressed by endothelial cells. Therefore, the endothelium, as one of the largest organs in the human body, is a
key target organ in COVID-1929. Impairment of endothelium function can promote vasodilation, fibrinolysis,
Scientific Reports | (2021) 11:3779 | https://doi.org/10.1038/s41598-021-83295-w 5
Vol.:(0123456789)www.nature.com/scientificreports/
Hypertension group Nonhypertension
Normal range All patients (n = 82) (n = 29) group (n = 53) Z P
Blood routine tests
WBC, × 109/L 3.5–9.5 4.7 (3.5–6.7) 4.9 (3.7–7.4) 4.5 (3.3–6.6) − 1.093 0.274
Neutrophil
1.8–6.3 3.2 (2.2–5.2) 3.9 (2.7–6.3) 3.1 (2.2–4.9) − 1.544 0.122
counts, × 109/L
N (%), 40–75 76.0 (63.8–84.3) 79.3 (69.2–85.7) 71.6 (62.9–83.4) − 1.852 0.064
Lymphocyte
1.1–3.2 0.8 (0.6–1.1) 0.72 (0.59–0.10) 0.81 (0.56–1.26) − 0.652 0.515
counts, × 109/L
L (%) 20–50 14.1 (9.1–19.2) 12.5 (8.6–17.3) 16.8 (12.2–21.3) − 1.625 0.098
Platelets, × 109/L 125–350 192.0 (127.0–225.0) 195 (165–293) 188 (130–225) − 0.492 0.623
Hemoglobin, g/L 130·0–175 127.0 (119.0–135.0) 129.5 (114.8–137) 126.5 (120–134.8) − 0.067 0.947
Infection-related biomarkers
PCT, ng/mL 0.04–0.25 0.1 (0.0–0.2) 0.07 (0.04–0.18) 0.05(0.04–0.1) − 1.679 0.093
SAA, mg/L 0.1–10 501.0 (111.3–102.0) 630.1 (185.3–1010.5) 373.5 (48.8–777.5) − 1.509 0.131
CRP, mg/L 0–5 67.5 (27.2–102.0) 79.2 (33.5–129.1) 57.8 (20.4–83.1) − 1.802 0.072
ESR, mm/h 0–20 47.8 (23.3–80.5) 50.5 (24.9–88.0) 47.8 (19–70) − 0.723 0.470
Blood biochemistry
AST, U/L 8–40 33.6 (26.2–51.2) 32.4 (24.2–49.8) 34.1 (26.8–57.0) − 0.982 0.326
ALT, U/L 5–35 26.1(17.0–40.0) 23.0 (18.1–42.0) 26.3 (14.7–39.4) − 0.630 0.529
GGT, U/L 0–50 30.2 (18.0–50.6) 29.0 (22.6–48.3) 30.3 (16.2–55.4) − 0.583 0.560
Serum urea nitrogen,
3.5–7.2 4.4 (3.2–4.5) 4.7 (3.4–5.9) 4.2 (3.2–4.9) − 1.324 0.185
mmol/L
Serum creatinine,
44–120 60.0 (49.0–79.3) 70.5 (51.8–80.8) 57.0 (49.0–79) − 1.473 0.142
μmol/L
2
eGFR, mL/min/1.73 m
> 90 102.0 (84.0–119.3) 77.0 (35.3–100.7) 113.0 (91.9–125.9) − 2.387 0.017
Lactate dehydrogenase,
120–250 249.5 (200.8–353.8) 263.0 (235–384.5) 240.0 (193.0–318.5) − 1.042 0.297
U/L
Creatine kinase, U/L 50–310 97.5 (55.7–179.8) 143.0 (84.0–220.0) 64.0 (50.0–154.0) − 1.732 0.083
NT-proBNP, ng/L 25–500 115 (26–372) 166 (70–1293) 26 (20–120.5) − 10.252 < 0.001
K, mmol/L 3.5–5.5 3.7 (3.4–4.0) 3.6 (3.5–4.1) 3.7 (3.5–3.9) − 0.635 0.525
Ca, mmol/L 2.0–2.6 2.1 (2.0–2.2) 2.1 (2.0–2.1) 2.1 (2.0–2.2) − 0.112 0.911
Albumin, g/L; 40–55 39.0 (35.8–43.3) 36.4 (34.6–39.9) 40.0 (36.6–44.6) − 2.218 0.026
Glucose, mmol/L 3.9–6.1 7.54 (6.26–9.23) 7.8 (7.4–9.4) 6.5 (5.5–10.0) − 1.583 0.113
Total bilirubin, μmol/L 3.4–20.5 9.9 (8.4–13.5) 9.8 (8.6–12.2) 10.0 (8.0–13.8) − 0.159 0.874
Direct bilirubin, μmol/L 0–6 3.7 (3.2–4.7) 3.5 (3.2–4.7) 3.9 (3.1–4.8) − 0.817 0.413
Total bile acid, μmol/L 0–12 4.4 (2.5–6.9) 3.8 (2.5–6.3) 5.3 (2.5–9.1) − 1.141 0.254
Coagulation function
D-dimer, μg/mL 0·0–1.5 0.5 (0.3–1.1) 0.5 (0.3–1.0) 0.5 (0.3–1.4) − 0.157 0.875
Prothrombin time, S 9–14 10.4 (7.9–11.1) 10.6 (9.7–11.1) 10.8 (10.3–11.5) − 1.109 0.267
Activated partial throm-
20–40 27.4 (11.7–31.9) 29.7 (24.7–39.2) 28.2 (26.9–32.0) − 0.802 0.422
boplastin time, S
Fibrin(-ogen) degrada-
0–5 3.7 (2.5–5.7) 3.7 (3.0–5.5) 3.7 (1.7–8.7) − 0.217 0.828
tion products, mg/L
Table 2. Laboratory findings of patients infected with COVID-19 on admission. Data are expressed
as the median (IQR) or n/N (%), where N is the total number of patients with available data. p values
comparing patients with or without hypertension are from χ2, Fisher’s exact, or Wilcoxon rank sum tests.
COVID-19 coronavirus disease 2019, IQR interquartile range, WBC white blood cell, PCT procalcitonin,
SAA serum amyloid A, CRP C-reactive protein, ESR erythrocyte sedimentation rate, AST aspartate
aminotransferase, ALT alanine aminotransferase, GGTglutamine transpeptidase, eGFR estimated glomerular
filtration rate, NT-proBNP N-terminal pro-brain natriuretic peptide.
and antiaggregation30–32. Simultaneously, for hypertensive populations, endothelial dysfunction is also a key
determinant of hypertension development and progression33,34. Therefore, hypertensive patients infected by
SARS-COV-2 are vulnerable to more serious endothelial dysfunction and thus tend to develop a more severe
COVID-19 phenotype, leading to a higher mortality rate.
In this study, 76.8% of patients were given antiviral agents based on previous experience in treating other
coronavirus infections, such as SARS and MERS. Anti-influenza drugs, including oseltamivir and arbidol, were
Scientific Reports | (2021) 11:3779 | https://doi.org/10.1038/s41598-021-83295-w 6
Vol:.(1234567890)www.nature.com/scientificreports/
All patients (n = 82) Hypertension group (n = 29) Nonhypertension group (n = 53) χ2 P
Bilateral pneumonia 64 (78.3) 23 (79.3) 41 (77.4) 0.042 0.838
Unilateral pneumonia 14 (17.1) 4 (13.8) 10 (18.9) 0.341 0.559
Patchy shadows 28 (34.2) 9 (31.0) 19 (35.8) 0.249 0.618
Multiple patchy shadows 22 (26.8) 11 (37.9) 11 (20.7) 2.871 0.093
Ground glass opacity 4 (4.9) 1 (3.4) 3 (5.7) 0.198 0.657
Hydrothorax 9 (11.0) 3 (10.3) 6 (11.3) 0.018 0.892
Table 3. Chest X-ray and CT findings of COVID-19 patients on admission. Data are expressed as the median
(IQR) or n/N (%), where N is the total number of patients with available data. p values comparing patients with
or without hypertension are from χ2 or Fisher’s exact tests. COVID-19 Coronavirus Disease 2019, CT computed
tomography.
Nonhypertension group
All patients (n = 82) Hypertension group (n = 29) (n = 53) χ2 P
Complications
ARDS 9 (11.0) 5 (17.2) 4 (7.5) 1.803 0.179
Sepsis 3 (3.7) 2 (6.9) 1 (1.9) 1.402 0.236
Acute renal injury 1 (1.2) 1 (3.4) 0 1.893 0.169
Acute respiratory injury 1 (1.2) 1 (3.4) 0 1.893 0.169
Treatment
Antiviral therapy 63 (76.8) 22 (75.9) 41 (77.4) 0.024 0.878
Two antiviral chemicals 28 (34.1) 11 (37.9) 17 (32.1) 0.286 0.593
Three antiviral chemicals 16 (19.5) 6 (20.7) 10 (18.9) 0.040 0.842
Glucocorticoid therapy 73 (89.0) 26 (89.7) 47 (88.7) 0.018 0.892
Antibacterial therapy 55 (67.1) 18 (62.7) 37 (69.8) 0.509 0.476
Anti-virus and antibacterial
34 (41.5) 14 (48.3) 20 (37.7) 0.858 0.354
treatment
Oxygen therapy 24 (29.3) 11 37.9) 13 (24.5) 1.626 0.202
Immune globulin γ treatment 42 (51.3) 15 (51.7) 27 (50.9) 0.005 0.946
Antihypertensive drugs – 25 (86.2) – – –
Table 4. Complications and treatments of COVID-19 patients. Data are expressed as n/N (%), where N is
the total number of patients with available data. p values comparing patients with or without hypertension
cases are from χ2 or Fisher’s exact test. COVID-19 Coronavirus Disease 2019, ARDS Acute respiratory distress
syndrome.
also used for empirical treatment during this unusual period. However, there are currently no agents proven to be
an effective therapy for COVID-1935,36. Glucocorticoid therapy was also empirically used for severe complications
in nearly 90% of patients. Nevertheless, the efficacy of glucocorticoids remains controversial because of their
adverse effects37 and lack of consistently positive outcomes4,38. Recently, evidence from a randomized controlled
trial showed that treatment with dexamethasone resulted in lowered mortality in COVID-19 p atients39. Therefore,
more reasonable glucocorticoid administration is still needed for COVID-19 treatment. Antibacterial therapy was
also used in over 50% of patients to prevent or treat bacterial infections. Combined with the dynamic laboratory
outcomes, parameters related to inflammation or organ function tended to improve 8–10 days after admission.
However, these improvements could not be attributed to medication treatments alone.
This study had several limitations. First, only 82 patients with confirmed COVID-19 were included in the full
analysis. A larger study population size would be helpful to more deeply understand the role of hypertension in
the progression of COVID-19. Second, due to the retrospective study design, some information was unavail-
able, particularly the time from illness onset to the signs and symptoms in electronic medical records. Third, the
positive rate of SARS-CoV-2 RNA detection in throat swabs is lower than that of other methods, and antibody
assays were not available to assist in diagnosis by the end of January, resulting in the exclusion of suspected but
unconfirmed cases from our analysis. Moreover, there are other potential risk factors, including age, chronic
lung disease, cardiovascular disease, and even liver disease, that could lead to more severe disease and increased
in-hospital death. However, this study initially identified hypertension as an important factor for the clinical
outcomes of COVID-19. Further investigations of the mechanism in hypertensive populations are needed.
Scientific Reports | (2021) 11:3779 | https://doi.org/10.1038/s41598-021-83295-w 7
Vol.:(0123456789)www.nature.com/scientificreports/
Figure 3. Timelines of laboratory markers from hospital admission for COVID-19. Figure shows dynamic
changes in white blood cell counts (A), neutrophil counts (B), lymphocyte counts (C), C-creation protein (D),
serum amyloid A (E), eGFR (F), D-dimer (G), and creatine kinase (H). For eGFR and D-dimer, continuous
data at 2-day intervals were available for 14 days and 12 days, respectively. *P < 0.05 for hypertension group vs
nonhypertension group.
Received: 29 July 2020; Accepted: 1 February 2021
References
1. Hui, D. S. et al. The continuing 2019-nCoV epidemic threat of novel coronaviruses to global health: The latest 2019 novel corona-
virus outbreak in Wuhan, China. Int. J. Infect. Dis. 91, 264–266 (2020).
Scientific Reports | (2021) 11:3779 | https://doi.org/10.1038/s41598-021-83295-w 8
Vol:.(1234567890)www.nature.com/scientificreports/
2. Zhou, P., Yang, X., Wang, X. & Hu, B. Discovery of a novel coronavirus associated with the recent pneumonia outbreak in humans
and its potential bat origin. bioRxiv. (2020).
3. Hamming, I. et al. Tissue distribution of ACE2 protein, the functional receptor for SARS coronavirus. A first step in understanding
SARS pathogenesis. J. Pathol. 203, 631–637 (2004).
4. Wang, D. et al. Clinical characteristics of 138 hospitalized patients with 2019 novel coronavirus-infected pneumonia in Wuhan,
China. JAMA 323, 1061–1069 (2020).
5. Zhou, F. et al. Clinical course and risk factors for mortality of adult inpatients with COVID-19 in Wuhan, China: A retrospective
cohort study. Lancet 395, 1054–1062 (2020).
6. Te, R. L., van Esch, J. H., Roks, A. J., van den Meiracker, A. H. & Danser, A. H. Hypertension: Renin-angiotensin-aldosterone
system alterations. Circ. Res. 116, 960–975 (2015).
7. Huang, C. et al. Clinical features of patients infected with 2019 novel coronavirus in Wuhan, China. Lancet 395, 497–506 (2020).
8. Chen, N. et al. Epidemiological and clinical characteristics of 99 cases of 2019 novel coronavirus pneumonia in Wuhan, China: A
descriptive study. Lancet 395, 507–513 (2020).
9. New Coronavirus Pneumonia Prevention and Control Program (6th ed.) (In Chinese). (2020).
10. Lui, L. S. et al. 2018 Chinese guidelines for prevention and treatment of hypertension-a report of the revision committee of chinese
guidelines for prevention and treatment of hypertension. J. Geriatr. Cardiol. 16, 182–241 (2019).
11. Wu, Z. & McGoogan, J. M. Characteristics of and important lessons from the coronavirus disease 2019 (COVID-19) outbreak in
China: Summary of a report of 72314 cases from the Chinese Center for Disease Control and Prevention. JAMA 323, 1239–1242
(2020).
12. Chen, Z. et al. Caution: The clinical characteristics of COVID-19 patients at admission are Changing. bioRixv. (2020).
13. Shi, S. et al. Association of cardiac injury with mortality in hospitalized patients with COVID-19 in Wuhan, China. JAMA Cardiol.
5, 802–810 (2020).
14. Zhang, J. J. et al. Clinical characteristics of 140 patients infected with SARS-CoV-2 in Wuhan, China. Allergy 75, 1730–1741 (2020).
15. Xintian, X. et al. Evolution of the novel coronavirus from the ongoing Wuhan outbreak and modeling of its spike protein for risk
of human transmission. Sci. China Life Sci. 1, 1–4 (2020).
16. Zhao, Y., Zhao, Z., Wang, Y. & Zhou, Y. Single-cell RNA expression profiling of ACE2, the putative receptor of Wuhan 2019-nCov.
bioRixv. (2020).
17. Li, W. et al. Angiotensin-converting enzyme 2 is a functional receptor for the SARS coronavirus. Nature 426, 450–454 (2003).
18. Zhou, P. et al. A pneumonia outbreak associated with a new coronavirus of probable bat origin. Nature 579, 270–273 (2020).
19. Kuba, K. et al. A crucial role of angiotensin converting enzyme 2 (ACE2) in SARS coronavirus-induced lung injury. Nat. Med. 11,
875–879 (2005).
20. Mehra, M. R., Desai, S. S., Kuy, S., Henry, T. D. & Patel, A. N. Cardiovascular disease, drug therapy, and mortality in covid-19. N
Engl J Med. 382, e102 (2020).
21. Jarraya, F. Treatment of hypertension: Which goal for which patient?. Adv. Exp. Med. Biol. 956, 117–127 (2017).
22. Yang, J. K., Lin, S. S., Ji, X. J. & Guo, L. M. Binding of SARS coronavirus to its receptor damages islets and causes acute diabetes.
Acta Diabetol. 47, 193–199 (2010).
23. Yisireyili, M. et al. Angiotensin receptor blocker irbesartan reduces stress-induced intestinal inflammation via AT1a signaling and
ACE2-dependent mechanism in mice. Brain Behav. Immun. 69, 167–179 (2018).
24. Simoes, E. S. A., Silveira, K. D., Ferreira, A. J. & Teixeira, M. M. ACE2, angiotensin-(1–7) and mas receptor axis in inflammation
and fibrosis. Br. J. Pharmacol. 169, 477–492 (2013).
25. Kwenandar, F. et al. Coronavirus disease 2019 and cardiovascular system: A narrative review. Int. J. Cardiol. Heart Vasc. 29, 100557
(2020).
26. Matsuyama, S. et al. Enhanced isolation of SARS-CoV-2 by TMPRSS2-expressing cells. Proc. Natl. Acad. Sci. USA 117, 7001–7003
(2020).
27. Tortorici, M. A. et al. Structural basis for human coronavirus attachment to sialic acid receptors. Nat. Struct. Mol. Biol. 26, 481–489
(2019).
28. Chen, Z. et al. Function of HAb18G/CD147 in invasion of host cells by severe acute respiratory syndrome coronavirus. J. Infect.
Dis. 191, 755–760 (2005).
29. Sardu, C. et al. Hypertension, thrombosis, kidney failure, and diabetes: Is COVID-19 an endothelial disease? A comprehensive
evaluation of clinical and basic evidence. J. Clin. Med. 9, 1417 (2020).
30. Godo, S. & Shimokawa, H. Endothelial functions. Arterioscler. Thromb. Vasc. Biol. 37, e108–e114 (2017).
31. Kazmi, R. S., Boyce, S. & Lwaleed, B. A. Homeostasis of hemostasis: The role of endothelium. Semin. Thromb. Hemost. 41, 549–555
(2015).
32. Santulli, G. Endothelial cells: The heart attack of the clones. Sci. Transl. Med. 10, 1–10 (2018).
33. Konukoglu, D. & Uzun, H. Endothelial dysfunction and hypertension. Adv. Exp. Med. Biol. 956, 511–540 (2017).
34. Mordi, I., Mordi, N., Delles, C. & Tzemos, N. Endothelial dysfunction in human essential hypertension. J. Hypertens. 34, 1464–1472
(2016).
35. de Wit, E., van Doremalen, N., Falzarano, D. & Munster, V. SARS and MERS: Recent insights into emerging coronaviruses. Nat.
Rev. Microb. 14, 523–534 (2016).
36. Gandhi, R. T., Lynch, J. B. & Del, R. C. Mild or moderate covid-19. N. Engl. J. Med. 1, 10 (2020).
37. Ho, J. C. et al. High-dose pulse versus nonpulse corticosteroid regimens in severe acute respiratory syndrome. Am. J. Respir. Crit.
Care Med. 168, 1449–1456 (2003).
38. Russell, C. D., Millar, J. E. & Baillie, J. K. Clinical evidence does not support corticosteroid treatment for 2019-nCoV lung injury.
Lancet 395, 473–475 (2020).
39. Horby, P. et al. Dexamethasone in hospitalized patients with Covid-19: Preliminary report. N Engl J Med. (2020).
Acknowledgements
We thank all the patients involved in this study and their families, as well as the numerous doctors, nurses,
pharmacists, and civilians working together to fight SARS-CoV-2. This work was supported by the Fundamen-
tal Research Funds for the Central Universities (2020kfyXGYJ038), the National Natural Science Foundation
(81100128), and a Wuhan Science Grant for Distinguished Young Scholars (201751). The funders had no role in
the study design, data collection and analysis, decision to publish, or preparation of the article.
Author contributions
F.X. and J.Z. had full access to all of the data in the study and take responsibility for the integrity of the data and
the accuracy of the data analysis. F.X., M.Z., and B.C. contributed equally and shared first authorship. Concept
and design: F.X., M.Z., J.Z. Acquisition, analysis, or interpretation of data: F.X., B.C., W.A., M.C., P.Y., X.Z., Y.L.,
X.X., K.L., Q.Z., K.W., G.H., M.D., S.C. Drafting of the manuscript: F.X. Critical revision of the manuscript for
Scientific Reports | (2021) 11:3779 | https://doi.org/10.1038/s41598-021-83295-w 9
Vol.:(0123456789)www.nature.com/scientificreports/
important intellectual content: F.X., M.Z., B.C., X.Z., M.X. Statistical analysis: F.X., B.C., W.A., M.C. Administra-
tive, technical, or material support: M.Z., S.L., Y.Z. Supervision: W.W., M.X., J.Z. All authors read, revised, and
approved the final manuscript. All authors agree to this version of the manuscript and to the submission of this
study to Scientific Reports and agree with the indicated contributions to this study and the order of attribution.
Competing interests
The authors declare no competing interests.
Additional information
Correspondence and requests for materials should be addressed to F.X. or J.Z.
Reprints and permissions information is available at www.nature.com/reprints.
Publisher’s note Springer Nature remains neutral with regard to jurisdictional claims in published maps and
institutional affiliations.
Open Access This article is licensed under a Creative Commons Attribution 4.0 International
License, which permits use, sharing, adaptation, distribution and reproduction in any medium or
format, as long as you give appropriate credit to the original author(s) and the source, provide a link to the
Creative Commons licence, and indicate if changes were made. The images or other third party material in this
article are included in the article’s Creative Commons licence, unless indicated otherwise in a credit line to the
material. If material is not included in the article’s Creative Commons licence and your intended use is not
permitted by statutory regulation or exceeds the permitted use, you will need to obtain permission directly from
the copyright holder. To view a copy of this licence, visit http://creativecommons.org/licenses/by/4.0/.
© The Author(s) 2021
Scientific Reports | (2021) 11:3779 | https://doi.org/10.1038/s41598-021-83295-w 10
Vol:.(1234567890)You can also read