Case study of the winter 2013/2014 extreme wave events off the west coast of Ireland - ASR
←
→
Page content transcription
If your browser does not render page correctly, please read the page content below
17th EMS Annual Meeting: European Conference for Applied Meteorology and Climatology 2017
Adv. Sci. Res., 15, 145–157, 2018
https://doi.org/10.5194/asr-15-145-2018
© Author(s) 2018. This work is distributed under
the Creative Commons Attribution 4.0 License.

               Case study of the winter 2013/2014 extreme wave
                     events off the west coast of Ireland
                                    Jelena Janjić1 , Sarah Gallagher2 , and Frédéric Dias1
              1 School   of Mathematics and Statistics, University College Dublin, MaREI Centre, Dublin, Ireland
                             2 Research, Environment and Applications, Met Éireann, Dublin, Ireland

                                 Correspondence: Jelena Janjić (jelena.janjic@ucdconnect.ie)

               Received: 28 November 2017 – Revised: 21 May 2018 – Accepted: 6 June 2018 – Published: 26 July 2018

       Abstract. Using the third generation WAVEWATCH III wave model in an unstructured formulation, and driven
       by HARMONIE-AROME mesoscale model hourly winds with a 2.5 km horizontal resolution, we reproduce
       the winter storms of 2013/2014 and analyse their effect on the western coastline of Ireland. WAVEWATCH
       III was forced at its ocean boundaries by directional wave spectra obtained from the ECMWF ERA-Interim
       re-analysis dataset. The wave model has a high resolution grid (up to 225 m resolution in the nearshore) with
       around 20 000 nodes, producing an abundance of important wave parameters outputted hourly, enabling a high
       quality, high-resolution analysis of the winter storms of 2013/2014.

1   Introduction                                                   and in time, a hindcast properly validated against available
                                                                   measurements will allow developers to improve WEC design
A significant portion of the electrical energy required glob-      and choose adequate locations for device deployment, ensur-
ally could potentially be supplied by harnessing wave en-          ing that device operation encounters as little down-time as
ergy and waters of the northeast Atlantic are ideal for ocean      possible.
energy extraction. Wave Energy Converters (WECs) trans-               The storms of winter 2013/2014 had various effects on
form wave energy to mechanical energy and finally to elec-         the Atlantic coast of Europe. This winter experienced beach
tricity. Wave energy conversion depends highly on average          changes (Masselink et al., 2016), severe gale strength winds,
energy available for extraction, direction of incoming waves       above average rainfall amounts and notable storm surges
(for unidirectional WECs) and wave frequency/period be-            (Met Office: Winter storms: December, n.d.; Met Office:
cause WECs extract the maximum energy if they are tuned            Winter storms: January, n.d.; Met Office: Winter 2013/14,
to match this frequency. These wave characteristics can be         n.d.; Met Éireann: December, n.d.; Met Éireann: January,
described by wave parameters like wave energy flux, mean           n.d; Met Éireann: Winter, n.d.) causing a lot of coastal dam-
or peak direction, and various types of wave periods. In ex-       age and inland flooding across the Atlantic coast of Eu-
tremely energetic sea states we have a large energy resource       rope. More than USD 1.8 billion worth of damage in the
but there is also a risk of WEC damage and Ireland has a long      UK was estimated (RMS, 2014). A study by Matthews et
history of storm waves reaching its shores. Due to its posi-       al. (2014) showed that the winter 2013/2014 was the stormi-
tion in the Northeast Atlantic, Ireland is regularly on the path   est (they characterised storminess by taking into account the
of very energetic extratropical weather systems, which can         frequency and intensity of cyclones) in the last 143 years,
bring with them phenomenal sea-states and extreme wave             again confirming that this winter was indeed exceptional.
conditions. For this reason, developers of ocean energy de-           For this reason, several studies have begun to examine if
vices need to take into account that although there is a huge      these extreme events are linked to anthropologically caused
ocean energy resource available off the west coast of Ireland,     climate change (Masselink et al., 2016; Matthews et al.,
there is a percentage of extreme events like the ones during       2014; Wild et al., 2016). Masselink et al. (2016) proposed
winter 2013/2014 which may cause damage to the devices.            that it is tempting to assign these extreme events to climate
Since the buoy data in Irish waters are sparse, both in space

Published by Copernicus Publications.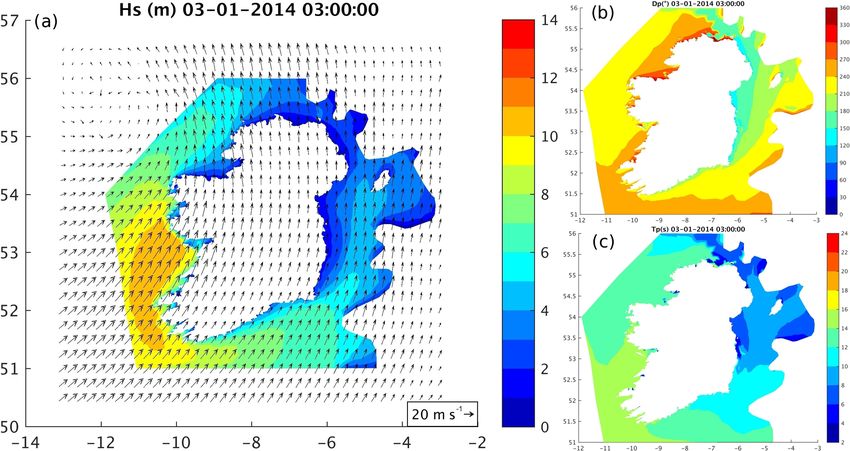
146 J. Janjić et al.: Case study of the winter 2013/2014 extreme wave events
required to try to address the current uncertainties in North
Atlantic wave and storm projections and their affect on Ire-
land. However, it is clear that extreme wave events are likely
to continue into the future and should be planned and pre-
pared for.
2 Model details
This hindcast was performed with the third generation
WAVEWATCH III (WW3) wave model (Tolman , 2014) ver-
sion 4.18 with an unstructured grid (Roland, 2008). The
parametrization for source terms and dissipation (Test 451)
formulated in Ardhuin et al. (2010) was implemented. The
bathymetry used was generated using a Digital Elevation
Model (DEM) for Ireland (Gallagher et al., 2014). The DEM
combined three bathymetric sources: Vector data obtained
from OceanWise Ltd., the European Marine Observation and
Data Network bathymetric set (EMODnet, 2013) and Multi-
Beam EchoSounders (MBES) and LIDAR INFORMAR data
from the Geological Survey of Ireland (GSI) and Marine
Institute (MI). EMODnet data has a resolution of approxi-
mately 500 m while MBES and LIDAR INFORMAR data
has a resolution from 2 to 80 m. The unstructured triangu-
lar grid has 20 235 nodes and a varying resolution of 10 km
offshore to 225 m nearshore (Gallagher et al., 2016a). The
limiting bottom depth for the wave model was set at 5 m.
WAVEWATCH III is driven with HARMONIE-AROME
10 m wind forcing fields and ERA-Interim (Dee et al., 2011)
wave spectra with a temporal resolution of 6 h (standard
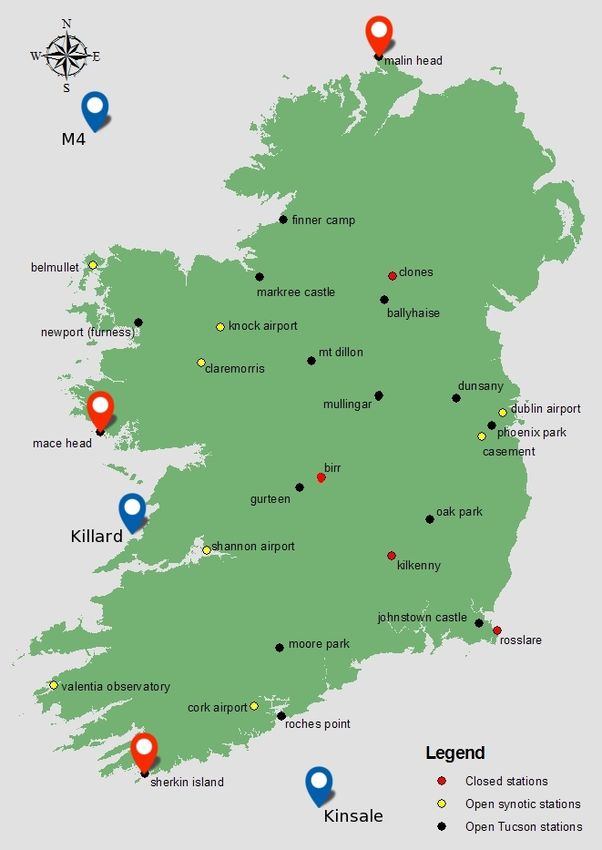
Figure 1. Map of Met Éireann stations and the location of the obser- synoptic times – 00:00, 06:00, 12:00, and 18:00 UTC). The
vations of wave and wind parameters used in this study. The location boundary feeding was set at grid nodes on segments of the
of the wave buoys used for model validation, Kinsale Gas Platform, open boundary (at the ERA-Interim grid points and between
Killard and the M4 buoy, are marked with blue pins. The location them) where the depth is larger than 90 m. Spectral domain
of the three TUCSON coastal stations, Sherkin Island, Mace Head
is discretized in 24 directions and 30 frequencies logarith-
and Malin Head, are marked with red pins.
mically spaced with an increment of 1.1 from 0.0345 Hz.
This coincides with the ERA-Interim wave spectra resolu-
tion. HARMONIE-AROME 10 m winds used to drive the
change due to the predictions of increased storminess by cli-
wave model were derived from the downscaled ERA-Interim
mate models. A study by Wolf and Wolf (2013) concluded
atmospheric model (Gallagher et al., 2016a). The temporal
that the influence and impact of climate change on the north-
resolution of the HARMONIE-AROME 10 m winds is 1 h
east Atlantic waves and storms was still uncertain, while
and a horizontal grid spacing of 2.5 km.
Wild et al. (2016) inferred that the large number of storms
of the winter 2013/2014 could not be directly related to an-
thropogenic factors. 3 Overview of winter 2013/2014
Looking into the future wave climate, a recent study us-
ing one CMIP5 climate model ensemble found that the num- The Polar jet stream marked the tracks for 12 major consec-
ber of low pressure systems and windstorms crossing Ireland utive storms in winter 2013/2014: 5/14/18/24/26/27 Decem-
by the end of the 21st century is projected to decrease, al- ber 2013, 3/25/26 January 2014, and 1/8/12 February 2014,
though not significantly, with typically 10 depressions with according to Met Éireann (Met Éireann, 2017a). Inland and
Mean Sea Level Pressure – MSLP < 970 hPa crossing Irish coastal flooding in Ireland and UK was a result of the combi-
waters annually (Gallagher et al., 2016b). In an additional nation of strong winds, tidal surges, low pressure and heavy
study, focusing on extreme wave events off Ireland, Gleeson outbreaks of rain (Met Office, 2014, 2015; Met Éireann,
et al. (2017) found evidence of some extreme wave enhance- 2013, 2014). UK suffered land and air transport disruption,
ment under the influence of a strongly positive North Atlantic loss of power and even fatalities (Met Office, 2014, 2015).
Oscillation, off the west coast of Ireland. Further studies are The majority of December monthly rainfall totals in Ireland
Adv. Sci. Res., 15, 145–157, 2018 www.adv-sci-res.net/15/145/2018/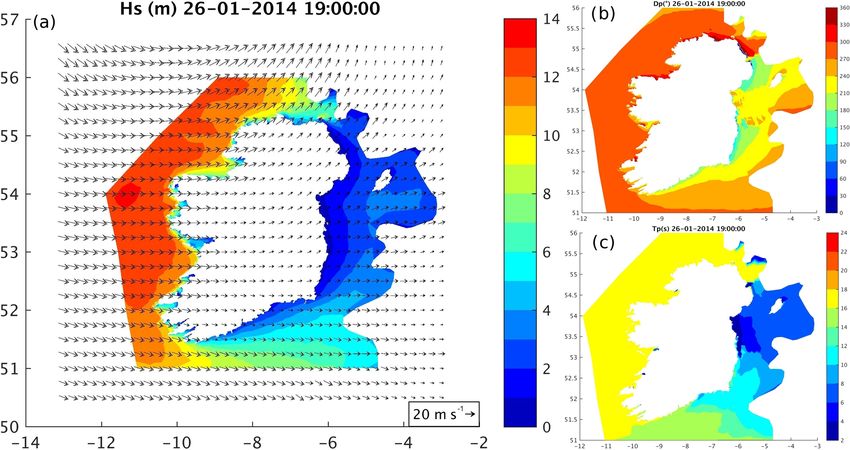
J. Janjić et al.: Case study of the winter 2013/2014 extreme wave events                                                             147

Figure 2. Timeseries of significant wave height for December 2013 comparing observations from the Kinsale Energy Gas Platform (51.37,
−7.945) radar and modelled values. In the upper left corner we provided the following statistical parameters: Correlation coefficient (CC),
standard deviation (σ ), bias, slope, scatter index (SI), and the number of records (n).

Figure 3. Timeseries of significant wave height for December 2013 and January 2014 comparing observations from the Killard (52.774,
−9.587) buoy and modelled values. In the upper left corner we provided the following statistical parameters: Correlation coefficient (CC),
standard deviation (σ ), bias, slope, scatter index (SI), and the number of records (n).

were well above average except at a few stations in the West,           cember 2013; (ii) “Christina” on the 3rd; (iii) “Hercules”
East and North. Co. Kerry reported its wettest December on              on the 5–6th; and finally (iv) a record breaking storm on
record since records began in 1949 (69 years) (Met Éireann,             26–27 January 2014. Each of these storms is described and
2017c). Valentia Observatory recorded the lowest minimum                discussed in detail in separate sections below. We give an
monthly pressure values of 947.1 hPa on 27 December due                 overview of the storms importance and weather and wave
to a depression of 944 hPa that was passing over the north              conditions on the day of the storm. We analysed time series
and northwest coast. Britain, Ireland and France were under             in three locations (M4 off the northwest coast, Killard off
long-lasting and heavy rainfall with strong winds in the early          Co. Clare, and Kinsale Energy Gas Platform off the south
2014 (Met Éireann, 2017b). All the rainfall totals in Ireland           coast – See Fig. 1) with maps of the significant wave height
for January were above their long term average rainfall. In             (Hs ), peak wave period (Tp ), and peak wave direction (Dp ).
January 2014 river and coastal flooding occurred with strong            We examined wind speeds and directions in three locations
winds reaching up to 150 km h−1 . Windstorm Christina (3rd              taken from The Unified Climate and Synoptic Observation
to the 10th) with a low pressure centre of 940 hPa caused               Network (TUCSON): Malin Head, Mace Head, and Sherkin
substantial damage to infrastructure and coastal homes in Ire-          Island. These are Automatic Weather Stations (AWS) which
land.                                                                   are part of Met Éireann’s synoptic weather observation net-
                                                                        work. These stations were chosen because they are both close
                                                                        to the coastline and the wave measurement locations.
4   Methodology

For brevity, we have chosen four of the storms that affected
Ireland during the winter of 2013/2014: (i) “Xaver” on 5 De-

www.adv-sci-res.net/15/145/2018/                                                                   Adv. Sci. Res., 15, 145–157, 2018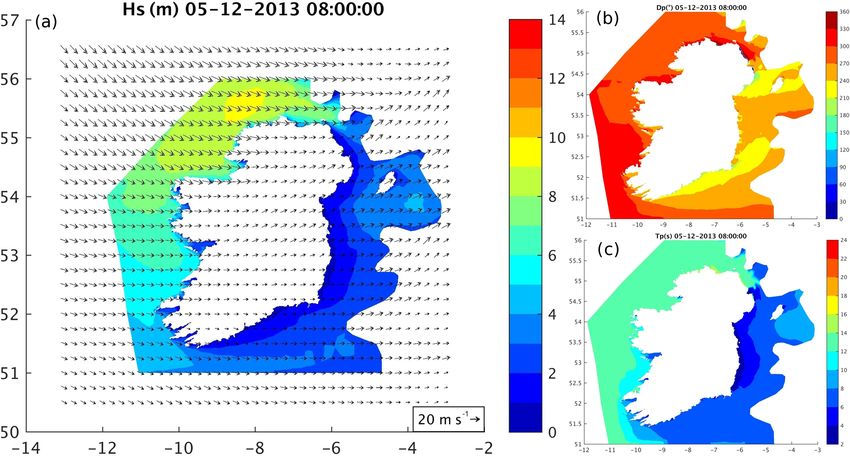
148 J. Janjić et al.: Case study of the winter 2013/2014 extreme wave events
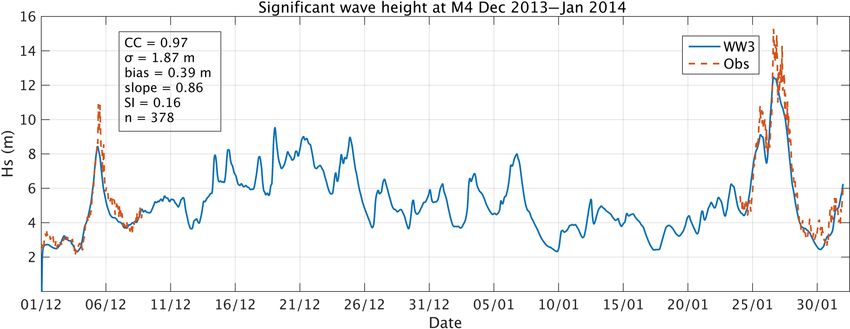
Figure 4. Timeseries of significant wave height for December 2013 and January 2014 comparing observations from the the Irish Weather
Buoy Network M4 buoy (55, −9.99) and modelled values. Note that the M4 buoy was non-operational for most of the period under evaluation.
In the upper left corner we provided the following statistical parameters: Correlation coefficient (CC), standard deviation (σ ), bias, slope,
scatter index (SI), and the number of records (n).
Figure 5. Synoptic chart of storm “Xaver” on 5 December 2013 at 06:00 UTC. © Crown Copyright (Met Office, UK).
5 Validation where µA , σA , µB , and σB are the mean and standard
deviation of A (model values) and B (measured values)
We validated the model by comparing it to the buoy data respectively and n is the number of records.
available. In Figs. 2, 3, and 4 we show the timeseries compar-
ison at Killard, Co. Clare, the Kinsale Energy Gas Platform, 2. Standard deviation (σ ):
and at the location of the the Irish Weather Buoy Network v
M4 buoy. The values of the statistical parameters for Hs at u
u 1 X n
different locations are summarised in Table 1. These param- σA = t |Ai − µA |2 (2)
n − 1 i=1
eters are defined as following:
1. Pearson correlation coefficient (CC): where µA is mean of A:
n n
1 X Ai − µA Bi − µB 1X
ρ(A, B) = (1) µA = Ai . (3)
n − 1 i=1 σA σB n i=1
Adv. Sci. Res., 15, 145–157, 2018 www.adv-sci-res.net/15/145/2018/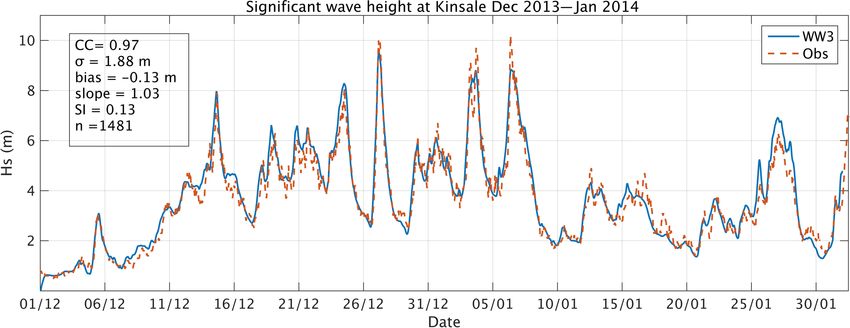
J. Janjić et al.: Case study of the winter 2013/2014 extreme wave events                                                           149

    3. Bias:                                                           Table 1. Statistical parameters.
                       n
                   1   X
                                                                          Location    CC      σA     σB    Bias   Slope    SI      n
       Bias =                (Bi − Ai ).                        (4)
                   n   i=1
                                                                          name               (m)    (m)     (m)
                                                                          Kinsale    0.97   1.88   1.79   −0.13    1.03   0.13   1481
    4. Slope is calculated with the polyfit (degree of fit is 1 i.e.      Killard    0.96   1.83   2.21    0.34    0.79   0.17   1487
       linear fit) command (MATLAB , R2015b), which solves                M4         0.97   1.87   2.93    0.39    0.86   0.16    377
       a linear system:
               V
       p=                                                       (5)    of rain on the 5th and 6th with gusty conditions (Met Éire-
               A                                                       ann, 2017c). Although not a substantial storm over Ireland,
       where V is a Vandermonde matrix of B.                           it wreaked havoc along its trajectory over parts of northern
                                                                       Europe and Scandinavia.
    5. Scatter Index (SI):                                                After moving away from Ireland, the storm continued to
               RMSE                                                    track over the UK, northern Europe and Scandinavia, caus-
       SI =                                                     (6)    ing record breaking water levels along the German North Sea
                µB
                                                                       coastline (Dagendorf et al., 2016) and high seas and storm
       where RMSE (Root Mean Square Error) is defined as:              surges in UK coastal waters (Wadley et al., 2014), resulting
               v
               u n                                                     in thousands of flooded homes. It caused the rail network
               u1 X                                                    in Scotland to shut down, with power losses, flight cancella-
       RMSE = t        (Bi − Ai )2 .                   (7)
                 n i=1                                                 tions, fallen trees, traffic accidents, storm surges, and fatali-
                                                                       ties in the UK (Met Office, 2017c).
   It can be seen that the model mostly underestimates the                In Fig. 6 we show the wind speeds, gusts and direction on
values of Hs at the Killard wave buoy (bias = 0.34 m) and              5 December for Malin Head and Mace Head which were af-
M4 (bias = 0.39 m) while slightly overestimating at Kinsale            fected by gale and storm force mean wind speeds as the low
(bias = −0.13 m), indicating that the model settings could be          pressure system tracked to the north-west of Ireland, with
improved to try to reduce the bias. As seen in Fig. 4 only             winds gusting as high as 65–70 kt at Malin Head in the north
25 % of hourly records have been available for the observed            of the country for a time. A substantial drop in the wind
period. Using the values of the Pearson correlation coeffi-            speeds and a change in the direction from westerly to north
cient, we can see that we have a strong relationship between           westerly can be seen between 10:00 and 11:00 UTC, as a cold
the measured and modelled Hs with a slightly more pro-                 front from the system passes over the stations.
nounced correlation at Kinsale and M4 (0.97) than at Killard              The wave model simulation produced maximum Hs values
(0.96). For Killard, Kinsale, and M4 we have a positive re-            of 9.25 m at 08:00 UTC on 5 December in the North Atlantic
lationship with Kinsale and M4 having a higher slope closer            ocean 27 km north from Tory Island, Co Donegal. The peak
to 1. The agreement could be improved by feeding the model             wave direction ranged from 270 to 300◦ and the peak wave
with 2-D spectra from the ECMWF operation archive, and                 period was between 12 and 14 s during the day (Fig. 7).
by refining the wind input and dissipation scheme used in the
model. The HARMONIE-AROME 10 m wind input used to                      6.2   Storm “Christina” on 3 January 2014
force the wave model for this study was previously validated
thoroughly by comparison to over 120 land and buoy stations            Overnight rainfall continued throughout the day on 3 Jan-
and altimeter data in Gallagher et al. (2016a).                        uary 2014 and into the evening hours across most of Ireland.
                                                                       Winds ranged from strong to strong gale and were south to
                                                                       southwest direction according to the Met Éireann Monthly
6     Results
                                                                       Bulletin for January 2014 (Met Éireann, 2017b). Valentia
                                                                       Observatory recorded the months lowest pressure value of
6.1     Storm “Xaver” on 5 December 2013
                                                                       956 hPa in the early hours of 3 January 2014 as this At-
The storm on 5 December was the first storm of the winter              lantic depression passed close to the western coast, which
of 2013/2014. This storm, named Xaver, formed off the coast            can be seen in Fig. 8. Flooding occurred in Dublin, Cork,
of Greenland on 4 December, moved over Northern Europe                 Galway, Salthill, Waterford, Tralee, Clare and Mayo, with
up until 7 December. The low pressure system passed north-             the rivers Shannon and Liffey bursting their banks. The Lim-
west of Ireland with values from 987 hPa at 00:00 UTC to               erick flooding was a consequence of a combination of high
967 hPa at 12:00 UTC on the same day (Fig. 5) causing a no-            tides, strong winds and heavy rainfall (Irish Times, 2014).
table storm surge and coastal flooding across Northern Eu-             Approximately 2800 customers in counties Donegal, Mayo
rope. According to the Met Éireann Monthly Weather Bul-                and Clare were reported by ESB Networks to be without
letin for December 2013, there were some heavy outbreaks               power after strong winds and heavy rain overnight. Wales,

www.adv-sci-res.net/15/145/2018/                                                                   Adv. Sci. Res., 15, 145–157, 2018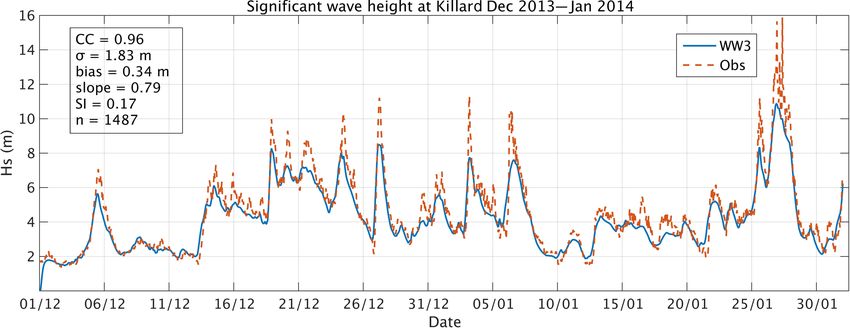
150                                                    J. Janjić et al.: Case study of the winter 2013/2014 extreme wave events

Figure 6. Observations from Met Éireann Synoptic (TUCSON) stations at (a) Malin Head and (b) Mace Head for wind speeds and gusts
(top panels) and direction (bottom panels) on 5 December 2013. Top panels: Red = wind speed (kt); Green = wind gust (kt). For context,
horizontal lines show mean speed boundaries on the Beaufort scale. Grey = Force 6 “Strong breeze” (22 kt); Turquoise = Force 8 “Gale”
(34 kt); and Black = Force 10 “Storm” (48 kt). Note the different scales for wind speed. Bottom panels: Direction of wind speeds and gusts
(◦ ).

Figure 7. Maps of (a) significant wave height (m) with vectors representing wind speed (m s−1 ) and direction (◦ ), (b) peak wave direction
(◦ ), and (c) peak wave period (s) at 08:00 UTC on 5 December 2013.

Adv. Sci. Res., 15, 145–157, 2018                                                                  www.adv-sci-res.net/15/145/2018/
J. Janjić et al.: Case study of the winter 2013/2014 extreme wave events                                                             151

Figure 8. Synoptic chart of storm “Christina” on 3 January 2014 at 00:00 UTC. © Crown Copyright (Met Office, UK).

Figure 9. Observations from Met Éireann Synoptic (TUCSON) stations at (a) Mace Head and (b) Sherkin Island for wind speeds and
gusts (top panels) and direction (bottom panels) on 3 January 2014. Top panels: Red = wind speed (kt); Green = wind gust (kt). For context,
horizontal lines show mean speed boundaries on the Beaufort scale. Grey = Force 6 “Strong breeze” (22 kt); Turquoise = Force 8 “Gale”
(34 kt); and Black = Force 10 “Storm” (48 kt). Note the different scales for wind speed. Bottom panels: Direction of wind speeds and gusts
(◦ ).

www.adv-sci-res.net/15/145/2018/                                                                   Adv. Sci. Res., 15, 145–157, 2018
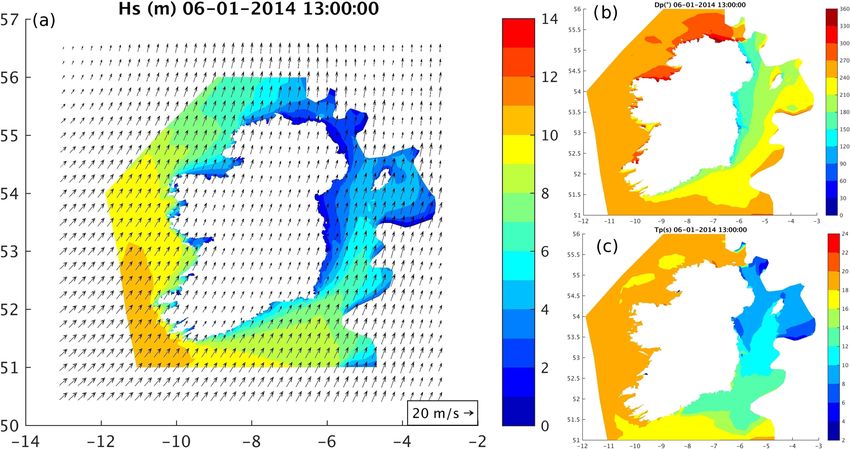
152                                                    J. Janjić et al.: Case study of the winter 2013/2014 extreme wave events

Figure 10. Maps of (a) significant wave height (m) with vectors representing wind speed (m s−1 ) and direction (◦ ), (b) peak wave direction
(◦ ), and (c) peak wave period (s) at 03:00 UTC on 3 January 2014.

Figure 11. Synoptic chart of the storm “Hercules” on 6 January 2014 at 00:00 UTC. © Crown Copyright (Met Office, UK).

Scotland and western England were also affected by flood-               270◦ for both stations, with wind speeds from strong breeze
ing, due to the high tides and strong winds that accompanied            to storm force 10. Wind gusts reached maximum speeds of
the storm. Many people were evacuated from their homes and              70 kt at Mace Head. Maximum values of Hs of 10.8 m were
at least one death due to immersion was also reported (BBC,             reached at 03:00 UTC on 3 January, 61 km southwest of the
2014).                                                                  Aran Islands, Co Galway. The peak wave direction ranged
   The wind speeds, gusts and wind direction on 3 January               from 210 to 270◦ and the Tp was from 12 to 14 s (see Fig. 10).
for Mace Head and Sherkin Island stations can be seen in                In Fig. 10 a distorted wind field can be seen in the northwest
Fig. 9. The wind direction ranged from approximately 200 to             part of the model domain indicating the passing of the low

Adv. Sci. Res., 15, 145–157, 2018                                                                   www.adv-sci-res.net/15/145/2018/
J. Janjić et al.: Case study of the winter 2013/2014 extreme wave events                                                              153

Figure 12. Maps of (a) significant wave height (m) with vectors representing wind speed (m s−1 ) and direction (◦ ), (b) peak wave direction
(◦ ), and (c) peak wave period (s) at 13:00 UTC on 6 January 2014 during storm “Hercules”.

Figure 13. Synoptic chart of the storm on 26 January 2014 at 12:00 UTC. The depression tracked to the north-west of Ireland causing record
breaking waves and phenomenal sea-states (Hs > 14 m). © Crown Copyright (Met Office, UK).

pressure system centre that caused the months lowest pres-              intermittent dry periods or light rain and strong, south to
sure value recorded by Valentia Observatory of 956 hPa.                 southwest winds (Met Éireann, 2017b). The following day
                                                                        was affected by a band of heavy thundery rain moving across
6.3   “Hercules” storm from 5–6 January 2014
                                                                        the country from west to east. Heavy thundery showers tran-
                                                                        sitioned to longer spells of rain. On 6 January wind speeds
On 5 January Ireland was hit by a storm, named “Hercules”               were from very strong to gale with a southwestern direction.
by the media (Ponce de León and Guedes Soares, 2015;                    Interestingly, the heaviest lightning activity of all the days in
Ponce de León et al., 2016), that brought heavy showers with

www.adv-sci-res.net/15/145/2018/                                                                    Adv. Sci. Res., 15, 145–157, 2018
154 J. Janjić et al.: Case study of the winter 2013/2014 extreme wave events Figure 14. Observations from Met Éireann Synoptic (TUCSON) stations at Mace Head for wind speeds and gusts (top panels) and direction (bottom panels) on (a) 26 January and (b) 27 January 2014. Top panels: Red = wind speed (kt); Green = wind gust (kt). For context, hori- zontal lines show mean speed boundaries on the Beaufort scale. Grey = Force 6 “Strong breeze” (22 kt); Turquoise = Force 8 “Gale” (34 kt); and Black = Force 10 “Storm” (48 kt). Note the different scales for wind speed. Bottom panels: Direction of wind speeds and gusts (◦ ). Figure 15. Maps of (a) significant wave height (m) with vectors representing wind speed (m s−1 ) and direction (◦ ), (b) peak wave direction (◦ ), and (c) peak wave period (s) at 19:00 UTC on 26 January 2014. Adv. Sci. Res., 15, 145–157, 2018 www.adv-sci-res.net/15/145/2018/
J. Janjić et al.: Case study of the winter 2013/2014 extreme wave events                                                      155

the month was on 6 January (Met Éireann, 2017b). The low          7   Conclusions
pressure system of 949 hPa, which caused the weather situa-
tion on the 6th, can be seen in Fig. 11 approaching the west      This study used the WAVEWATCH III model to reproduce
coast of Ireland from the southwest. This system brought          the events of winter 2013/2014. We simulated December and
strong to gale force wind speeds to all three synpotic stations   January of this winter and analysed four storms: 5 Decem-
with winds gusting up to 60 kt at Sherkin Island and wind         ber 2013, 3, 5–6, and 26–27 January 2014. The maximum Hs
direction with a wide range from 120 to 240◦ at the same          height of 13.1 m was reached by the model on 26 January at
station.                                                          19:00 UTC, keeping in mind that the model underestimated
   The maximum value of Hs of 10.9 m was achieved on              the value of Hs by 1.5 m when compared to the observations.
6 January at 13:00 UTC close to Mizen Head, Co Cork. Dur-         The model did reproduce the extreme wave events as can be
ing the day, the storm Dp ranged from 240 to 270◦ and Tp          seen in the validation, but underestimated the maximum val-
was between 16 and 20 s (see Fig. 12).                            ues somewhat. Phenomenal sea-states occurred off the west
                                                                  coast of Ireland during the winter of 2013/2014, and these ex-
6.4   Storm on 26–27 January 2014                                 treme wave events need to be taken in account not only in the
On the 26th heavy rain started in the west and northwest and      stage of WEC design, deployment, and operation but also to
gradually spread over the rest of the country (Met Éireann,       improve our understanding and forecasting of these extreme
2017b). By 06:00 UTC on the 26th centre of the low had            coastal hazards. The future work will include carrying out
deepened to 950 hPa (see Fig. 13) and by 12:00 UTC had            this simulation with higher resolution winds, ECMWF oper-
deepened further to 947 hPa, located to the northwest of Ire-     ational archive 2-D wave spectra and refining of model wind
land, bringing gale force winds and phenomenal sea-states.        input and dissipation scheme to match more closely the peaks
When Hs is 14 m or greater, the World Meteorological Orga-        of these powerful storms.
nization (WMO) defines these as phenomenal seas (WMO,
2009). Heavy showers, some even with hail, continued dur-
                                                                  Data availability. The wave data will be publically available in
ing the day all over the country. The situation continued on
                                                                  the future and in the meantime contact the corresponding au-
the 27th with heaviest and most frequent showers in the west      thor. The wind data used in the analysis (from Met Éireann
and northwest of the country. On this day winds were strong       Tucson stations) is available online: https://www.met.ie/climate/
to gale wind with a westerly direction (Met Éireann, 2017b).      available-data/historical-data (last access: 28 November 2017).
   The low pressure system on 26 January 2014 (see Fig. 13)
resulted in a record 23.44 m maximum individual wave
height at the M4 wave buoy at 15:00 UTC on the same day off       Competing interests. The authors declare that they have no con-
the coast of Donegal, in Hs of over 14.65 m and mean wave         flict of interest.
period of 13.24 s (Tiron et al., 2014). Phenomenal sea-states
were also seen all along the western seaboard as demon-
strated at the Killard buoy, where Hs observations during the     Special issue statement. This article is part of the special issue
storm exceeded 15 m on more than one occasion (see Fig. 3).       “17th EMS Annual Meeting: European Conference for Applied Me-
   Figure 14 shows the wind speeds, gusts and direction for       teorology and Climatology 2017”. It is a result of the EMS Annual
Mace Head on 26 and 27 January. The wind speeds on the            Meeting: European Conference for Applied Meteorology and Cli-
                                                                  matology 2017, Dublin, Ireland, 4–8 September 2017.
26th ranged from strong breeze to storm force while on the
27th for Mace Head they were from gale to storm force winds
(Fig. 14). The wind gust reached 70 kt on the 26th at Mace
                                                                  Acknowledgements. This work is supported by Science Foun-
Head. The wind direction has changed from 180 to 270◦ in
                                                                  dation Ireland (SFI) through Marine Renewable Energy Ireland
just two hours on the 26th (from 05:00 to 07:00 UTC), while       (MaREI), the SFI Centre for Marine Renewable Energy Research-
the 27th it stayed relatively constant during the day between     (12/RC/2302). The authors want to thank the Irish Centre for
270 to 300◦ .                                                     High-End Computing (ICHEC) for the provision of computational
   The maximum Hs (13.1 m) the model reached was on               facilities. The authors thank Met Éireann for providing the M4
26 January at 19:00 UTC 70 km west of Black Rock, Co              and Kinsale Gas Energy Platform wave data, and the ESB for the
Mayo, but the value of Hs stayed around 13 m from 13:00–          Killard Waverider buoy data. The authors thank Met Éireann for
21:00 UTC that day. Hence comparing the measured values           providing the M4 and Kinsale Gas Energy Platform wave data, the
we can see that the model underestimated the peak value of        ESB for the Killard Waverider buoy data, wind and gust data.
Hs by 1.5 m. The direction ranged from 270 to 300◦ with Tp
                                                                  Edited by: Conor Sweeney
from 16 to 18 s (Fig. 15).
                                                                  Reviewed by: Reduan Atan and one anonymous referee

www.adv-sci-res.net/15/145/2018/                                                            Adv. Sci. Res., 15, 145–157, 2018
156 J. Janjić et al.: Case study of the winter 2013/2014 extreme wave events
References lantic coast of Europe, Geophys. Res. Lett., 43, 2135–2143,
https://doi.org/10.1002/2015GL067492, 2016.
Met Éireann: Winter 2013/2014: available at: http://www.met.ie/
climate-ireland/weather-events/WinterStorms13_14.pdf, last ac-
Ardhuin, F., Rogers, E., Babanin, A. V., Filipot, J., Magne, R., cess: 23 November 2017a.
Roland, A., van der Westhuysen, A., Queffeulou, P., Lefevre, Met Éireann: January 2014 Monthly Weather Bulletin
J., Aouf, L., and Collard, F.: Semiempirical Dissipation Source No. 332, available at: https://www.met.ie/climate/
Functions for Ocean Waves. Part I: Definition, Calibration, irish-climate-monthly-summary.asp, last access: 3 Novem-
and Validation, J. Phys. Oceanogr., 40, 1917–1941, 2010, ber 2017b.
https://doi.org/10.1175/2010JPO4324.1, 2010. Met Éireann: December 2013 Monthly Weather Bulletin No.
BBC: BBC news – Flooding continues to threaten UK, available at: 332, available at: http://www.met.ie/climate/MonthlyWeather/
http://www.bbc.com/news/uk-25584221, last access: 21 Novem- clim-2013-Dec.pdf, last access: 3 November 2017c.
ber 2017. Met Office: Winter 2013/14, available at: https://www.metoffice.
Dangendorf, S., Arns, A., Pinto, J. G., Ludwig, P., and Jensen, gov.uk/climate/uk/summaries/2014/winter, last access: 14
J.: A century of sea level data and the UK’s 2013/14 storm November 2017a.
surges: An assessment of extremes and clustering using the Met Office: Winter storms, January to February 2014, avail-
newlyn tide gauge record, Environ. Res. Lett. 11, 054001, able at: https://www.metoffice.gov.uk/climate/uk/interesting/
https://doi.org/10.1088/1748-9326/11/5/054001, 2016. 2014-janwind, last access: 8 November 2017b.
Dee, D. P., Uppala, S. M., Simmons, A. J., Berrisford, P., Poli, Met Office: Winter storms, December 2013 to January 2014, avail-
P., Kobayashi, S., Andrae, U., Balmaseda, M. A., Balsamo, G., able at: https://www.metoffice.gov.uk/climate/uk/interesting/
Bauer, P., Bechtold, P., Beljaars, A. C. M., van de Berg, L., Bid- 2013-decwind, last access: 8 November 2017c.
lot, J., Bormann, N., Delsol, C., Dragani, R., Fuentes, M., Geer, Ponce de León, S. and Guedes Soares, C.: Hindcast of the Hercules
A. J., Haimberger, L., Healy, S. B., Hersbach, H., Hólm, E. V., winter storm in the North Atlantic, Nat. Hazards, 78, 1883–1897,
Isaksen, L., Kållberg, P., Köhler, M., Matricardi, M., McNally, 2015.
A. P., Monge-Sanz, B. M., Morcrette, J.-J., Park, B.-K., Peubey, Ponce de León, S., Bettencourt, J. H., and Dias, F.: Compari-
C., de Rosnay, P., Tavolato, C., Thépaut, J.-N., and Vitart, F.: The son of numerical hindcasted severe waves with Doppler radar
ERA-Interim reanalysis: configuration and performance of the measurements in the North Sea, Ocean Dynam., 67, 103–115,
data assimilation system, Q. J. Roy. Meteor. Soc., 137, 553–597, https://doi.org/10.1007/s10236-016-1014-3, 2016.
https://doi.org/10.1002/qj.828, 2011. Risk Management Solutions (RMS): 2013–2014 Winter storms
EMODnet: MODNET – the European marine observation and data in europe, An Insurance and Catastrophe Modeling Per-
network, available at: http://portal.emodnet-hydrography.eu (last spective, available at: http://forms2.rms.com/rs/729-DJX-565/
access: 28 November 2017), 2013. images/ws_2013_2014_europe_winter_storms.pdf, last access:
Gallagher, S., Tiron, R., and Dias, F.: A long-term nearshore wave 15 November 2017.
hindcast for Ireland: Atlantic and Irish Sea coasts (1979–2012), Roland, A.: Development of WWM II: Spectral wave modelling
Ocean Dynam., 64, 1163–1180, 2014. on unstructured meshes, Institut für Wasserbau und Wasser-
Gallagher, S., Gleeson, E., Tiron, R., McGrath, R., and wirtschaft, Technische Universität Darmstadt, 2008.
Dias, F.: The Nearshore Wind and Wave Energy Poten- Tiron, R., Gallagher, S., and Dias, F.: UCD School of Mathematical
tial of Ireland: A High Resolution Assessment of Avail- Sciences is tracking record extreme waves off the west coast of
ability and Accessibility, Renew. Energ., 88, 494–516, Ireland, available at: http://www.ucd.ie/mathstat/newsandevents/
https://doi.org/10.1016/j.renene.2015.11.010, 2016a. news/newsarchive/maintext,196126,en.html (last access: 15
Gallagher, S., Gleeson, E., Tiron, R., McGrath, R., and Dias, F.: November 2017), 2014.
Wave climate projections for Ireland for the end of the 21st cen- Tolman, H.: The WAVEWATCH III Development Group (2014),
tury including analysis of Earth winds over the North Atlantic User Manual and System Documentation of WAVEWATCH
Ocean, Int. J. Climatol., 36, 4592–4607, 2016b. III version 4.18, Tech. Note 316, NOAA/NWS/NCEP/MMAB,
Gleeson, E., Gallagher, S., Clancy, C., and Dias, F.: NAO and ex- 2014, available at: http://polar.ncep.noaa.gov/waves/wavewatch/
treme ocean states in the Northeast Atlantic Ocean, Adv. Sci. manual.v4.18.pdf (last access: 23 November 2017), 2014.
Res., 14, 23–33, 2017. Wadey, M. P., Haigh, I. D., and Brown, J. M.: A century of sea
Irish Times: High tides and storm cause flooding across country: level data and the UK’s 2013/14 storm surges: an assessment
available at: https://www.irishtimes.com/news/environment/ of extremes and clustering using the Newlyn tide gauge record,
high-tides-and-storm-cause-flooding-across-country-1. Ocean Sci., 10, 1031–1045, https://doi.org/10.5194/os-10-1031-
1642813, last access: 9 November 2017. 2014, 2014.
MATLAB: MATLAB and Statistics Toolbox Release R2015b, The Wild, S., Befort, D. J., and Leckebusch, G. C.: Was the Ex-
MathWorks, Inc., Natick, Massachusetts, United States, 2015. treme Storm Season in Winter 2013/14 Over the North At-
Matthews, T. K. R., Murphy, C., Wilby, R. L., and Harrigan, S.: lantic and the United Kingdom Triggered by Changes in the
Stormiest winter on record for Ireland and UK, Nat. Clim. West Pacific Warm Pool?, B. Am. Meteorol. Soc., 96, S29–S34,
Change, 4, 738–740, https://doi.org/10.1038/nclimate2336, https://doi.org/10.1175/BAMS-D-15-00118.1, 2016.
2014. World Meteorological Organization: Guide to Meteorological In-
Masselink, G., Castelle, B., Scott, T., Dodet, G., Suanez, S., struments and Methods of Observation – WMO-No.8: part II,
Jackson, D., and Floc’h, F.: Extreme wave activity during
2013/2014 winter and morphological impacts along the At-
Adv. Sci. Res., 15, 145–157, 2018 www.adv-sci-res.net/15/145/2018/J. Janjić et al.: Case study of the winter 2013/2014 extreme wave events 157 chap. 4 (Marine Observations), World Meteorological Society, 7th Edn., 2009. Wolf, D. and Wolf, J.: Impact of climate change on storms and waves, MCCIP Science Review 2013, 20–26, https://doi.org/10.14465/2013.arc03.020-026, 2013. www.adv-sci-res.net/15/145/2018/ Adv. Sci. Res., 15, 145–157, 2018
You can also read