Weaning predictors do not predict extubation failure in simple-to-wean patients
←
→
Page content transcription
If your browser does not render page correctly, please read the page content below
Journal of Critical Care (2012) 27, 221.e1–221.e8

Weaning predictors do not predict extubation failure in
simple-to-wean patients☆,☆☆
Augusto Savi RPT a, b,⁎, Cassiano Teixeira MD, PhD a, c , Joyce Michele Silva RPT a ,
Luis Guilherme Borges RPT a , Priscila Alves Pereira RPT a , Kamile Borba Pinto RPT a ,
Fernanda Gehm RPT a , Fernanda Callefe Moreira RPT, MsC a , Ricardo Wickert RPT a ,
Cristiane Brenner Eilert Trevisan RPT, MsC d , Juçara Gasparetto Maccari MD a, c ,
Roselaine Pinheiro Oliveira MD, PhD a, c , Silvia Regina Rios Vieira MD, PhD a, b, d
and Gaúcho Weaning Study Group1
a
 Intensive Care Unit of Moinhos de Vento Hospital, Porto Alegre, Rua Ramiro Barcelos 910, 90035-001 Brazil
b
  Posgraduate Program in Medical Sciences, Medical School, Universidade Federal do Rio Grande do Sul, Rua Ramiro Barcelos,
2400 - 2° andar, 90035-003 Porto Alegre, RS, Brazil Porto Alegre, Brazil
c
 Central Intensive Care Unit of Santa Casa Hospital, Rua Professor Annes Dias, 135, 90020-090 Porto Alegre, Brazil
d
  Intensive Care Unit of Hospital de Clínicas, Rua Ramiro Barcelos, 2350, 90035-903 Porto Alegre, Brazil

    Keywords:
                                         Abstract
    Mechanical ventilation;
                                         Background: Predictor indexes are often included in weaning protocols and may help the intensive care
    Predictive index;
                                         unit (ICU) staff to reach expected weaning outcome in patients on mechanical ventilation.
    Weaning;
                                         Objective: The objective of this study is to evaluate the potential of weaning predictors during extubation.
    Extubation;
                                         Design: This is a prospective clinical study.
    Cutoff values;
                                         Settings: The study was conducted in 3 medical-surgical ICUs.
    Receiver operating
                                         Patients: Five hundred consecutive unselected patients ventilated for more than 48 hours were included.
     characteristic curve
                                         Methods and Measurements: All patients were extubated after 30 minutes of successful spontaneous
                                         breathing trial and followed up for 48 hours. The protocol evaluated hemodynamics, ventilation
                                         parameters, arterial blood gases, and the weaning indexes frequency to tidal volume ratio; compliance,
                                         respiratory rate, oxygenation, and pressure; maximal inspiratory pressure; maximal expiratory pressure;

    ☆
       Authors' contributions: AS conducted data collection, screened and prepared initial and subsequent drafts of the manuscript, and included comments from
other authors into the revised versions. SRRV and CT added major comments to the manuscript. JMS, LGAB, PAP, KBP, FG, FCM, RW, and CBET performed
data collection. JGM and RPO provided methodological orientation of the manuscript and statistical analysis of data.
    ☆☆
         The authors have not disclosed any potential conflicts of interest.
   ⁎ Corresponding author. Rua Ramiro Barcelos, 910–Porto Alegre 900035-001, Brasil. Tel.: +55 51 33143385.
    E-mail address: gutosavi@bol.com.br (A. Savi).
    1
       Gaúcho Weaning Study Group: Eubrando Silvestre Oliveira, MD; Soraia Genebra Ibrahim, RPT; Flavio Cardona Alves, MD; Jorge Amilton Höher, MD;
Sérgio Fernando Monteiro Brodt, MD; José Hervê Diel Barth, MD; Leonardo Silveira da Silva, RPT; Túlio Frederico Tonietto, MD; Ricardo Viegas Cremonese,
MD; André Santana Machado, MD; Patrícia de Campos Balzano, MD; Luciano Marques Furlanetto, MD; Régis Bueno Albuquerque, MD; Daniele Munareto
Dallegrave, MD; Eduardo de Oliveira Fernandes, PhD; Maicon Becker, MD; Sergio Pinto Ribeiro, PhD; Alexandre Cordella da Costa, MD; Marcelo de Mello
Rieder, RPT; Marisa Helena Pilenghi Correa, MD; Cristiane Magalhães Siqueira de Campos Morais, MD; Márcio Pereira Hetzel, MD; André Periti Torelly,
MD; Roger Weingartner, MD; Patrícia Pickersgill de Leon, MD; Robledo Condessa, RPT; and Wagner da Silva Naue, RPT.

0883-9441/$ – see front matter © 2012 Elsevier Inc. All rights reserved.
doi:10.1016/j.jcrc.2011.07.079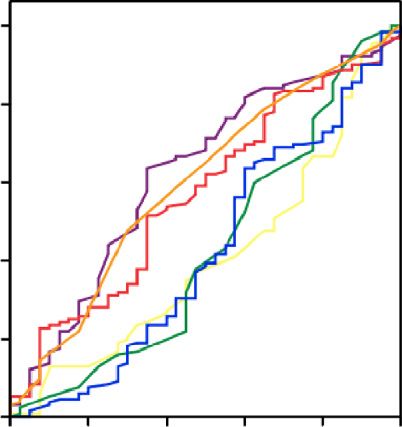
221.e2                                                                                                                       A. Savi et al.

                                   PaO2/fraction of inspired oxygen; respiratory frequency; and tidal volume during mechanical ventilation
                                   and in the 1st and 30th minute of spontaneous breathing trial.
                                   Results: Reintubation rate was 22.8%, and intensive care mortality was higher in the reintubation group
                                   (10% vs 31%; P b .0001). The areas under the receiver operating characteristic curve showed that tests did
                                   not discriminate which patients could tolerate extubation.
                                   Conclusion: Usual weaning indexes are poor predictors for extubation outcome in the overall
                                   ICU population.
                                   © 2012 Elsevier Inc. All rights reserved.

1. Introduction                                                         to-wean criteria: (a) improvement of the underlying
                                                                        condition that led to acute respiratory failure; (b) adequate
    Weaning from mechanical ventilation (MV) is an                      oxygenation indicated by PaO2 greater than 60 mm Hg on
important issue because early or delayed extubation can                 fraction of inspired oxygen (FiO2) less than 0.4, positive end-
be detrimental for the patient's health, increasing length of           expiratory pressure (PEEP) less than 8 cm H2O, and
hospital stay and risk of death [1-3]. The weaning process              PaO2/FiO2 greater than 150; (c) cardiovascular stability
comprises 2 stages: the progressive withdrawal from                     (heart rate [HR] b130 beats per minute and mean arterial
invasive ventilatory support and removal of the endotra-                pressure [MAP] greater than 60 mm Hg) with no or minimal
queal tube. Time spent in the first stage represents 40% to             pressors; (d) afebrile; (e) adequate hemoglobin level greater
50% of the total period of MV [4]. Moreover, MV costs                   than 8 g/dL; (f) adequate mental status (arousal, Glasgow
are very high [5].                                                      Coma Scale [GCS] N10, with no continuous sedative
    Several patients after a successful spontaneous breathing           infusions); (g) presence of audible cough during suctioning;
trial (SBT) fail in the second stage of the weaning process,            and (h) normal acid-basic and electrolytes, according to the
requiring reintubation in 24 to 72 hours [6,7]. The rationale           Evidence-Based Medicine Task Force of the American
of these indexes is to discriminate patients who can tolerate           College of Chest Physicians [2] and to the statement of
an SBT [8]. Previous studies have reported on the                       the Sixth International Consensus Conference on Intensive
significance of predicting weaning success using many                   Care [10].
variables of weaning predictors, from simple subjective
evaluations to complex measurements [9]. However, can                   2.3. Weaning protocol
weaning predictors anticipate extubation outcome? This
suggests that to identify independent predictors of successful             Patients meeting the above criteria were then weaned
extubation is important.                                                using a weaning protocol (measurements of weaning
    To address this issue, a large prospective, multicentric            predictors followed by a T tube trial for 30 minutes).
evaluation of some predictors of weaning in a consecutive
unselected sample of critically ill patients was conducted to           2.3.1. Measurements of ventilatory paramenters
assess the potential of these predictors for extubation outcome.           Measurements of ventilatory parameters and weaning
                                                                        predictors were carried out by the respiratory physiotherapy
                                                                        staff of each ICU and recorded at the 1st and 30th minute of
2. Methods                                                              SBT. The attending physician of each patient was blinded
                                                                        for results of weaning predictor measurements. To measure
2.1. Design                                                             the respiratory frequency to tidal volume ratio (f/VT), the
                                                                        patient was disconnected from MV, and the endotracheal
                                                                        tube was connected to a spirometer (Anesthesia Associates,
   This is a prospective, multicentric clinical study per-
                                                                        Inc. Ainca model 00-295; San Marcos, Calif). After 1 minute
formed in 3 medical-surgical intensive care units (ICUs). It
                                                                        of disconnection, the minute ventilation (VE) was obtained,
was approved by the Health Research and Ethics Committee
                                                                        and the respiratory frequency (f) was counted during
(00-147), and informed consent was obtained for each
patient from next of kin.                                               1 minute of monitoring. Tidal volume (VT) was determined
                                                                        by the equation VT = VE/f. The maximal inspiratory pressure
                                                                        (MIP) and maximal expiratory pressure (MEP) were
2.2. Patients                                                           measured with an aneroid manometer (Suporte Famabras,
                                                                        Itaquaquecetuba Brazil) and defined as the most negative
   All patients enrolled in the study were on MV for more               (and positive, respectively) value produced by 3 consecutive
than 48 hours with Servo 900C, Servo 300 (Siemens-Elema,                respiratory efforts after 30 seconds of occlusion against a
AB, Sweden), or Evita 4 (Dräger, Lübeck, Germany). They                 unidirectional valve (NIF-TEE, nonrebreathing T-Piece;
were assessed daily for presence of the following readiness-            Smiths Medical, Keene, NH) [11]. To measure MIP, the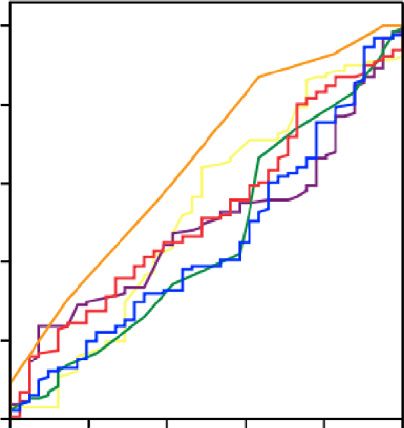
Weaning predictors do not predict EF                                                                                                       221.e3

inspiratory port of the valve was blocked permitting only         Measured weaning indexes were f/VT, CROP, MIP, MEP,
exhalation, thus allowing patients to perform the maximal         PaO2/FiO2, f, and VT. Change in the respiratory pattern was
inspiratory effort at a lung volume approaching residual          assessed by the percent change of f/VT during SBT (relative
volume. To measure MEP, the expiratory port of the valve          to the first minute). The primary outcome was reintubation at
was blocked permitting only inhalation, thus allowing             48 hours, and the secondary was death in the ICU. Patients
patients to perform the maximal expiratory effort at a lung       with previous failure in a weaning trial were excluded from
volume approaching the total lung capacity. Respiratory           analyses. Results from our protocol were previously
compliance, respiratory rate, oxygenation, and pressure           presented in the form of an abstract [12].
(CROP) index was measured immediately before SBT and
calculated by the formula
                                                                  2.4. Sample size
½Cdyn × MIP × ðPaO2 = PA O2 Þ = f
                                                                     To calculate sample size, we used the criteria adopted
where Cdyn is dynamic compliance; PAO2, alveolar oxygen           by Yang and Tobin [13] considering that a weaning
pressure; and f, respiratory frequency.                           success index must present at least 95% of sensitivity and
                                                                  65% of specificity. Therefore, for the index of extubation
                                                                  success (ES) to reach 80% of power, the sample must
2.3.2. T-Tube trial                                               include a minimum of 88 patients with EF. Assuming a
   The T-Tube trial was used to perform SBT with patient in       reintubation rate of about 20%, the sample size calculated
semirecumbent position. Supplemental oxygen was given to          for this study was 440 patients.
ensure an SpO2 of 90% up to a maximum flow of 8 L/min.
                                                                  2.5. Statistical analysis
2.3.3. Extubation procedure
    Extubation was made after checking adequate clinical             All data were expressed as mean ± SD for continuous
tolerance to SBT, defined as f less than 38 breaths per           variables or as percentages for categorical variables.
minute, arterial oxyhemoglobin saturation (SatO2) greater         Differences between the 2 groups at baseline were analyzed
than 90%, HR less than 130 beats per minute, with no              by use of the Student t test or the Mann-Whitney U test for
hemodynamic instability (changes b20% for systolic or             continuous variables and the χ 2 test for categorical variables
diastolic pressure), no change in mental status (drowsiness,      as well as the Fisher exact test. Incremental analysis of the
coma, anxiety), without signs of respiratory discomfort,          area under the receiver operating characteristic (ROC) curve
diaphoresis, or signs of increased work of breathing (such as     was performed for presence of threshold effect and for
the use of accessory respiratory muscles or paradoxical
thoracoabdominal ventilation) at the end of the trial. Patients
intolerant to SBT were returned to MV and excluded from                               Patients admitted to our ICU
                                                                                                n = 4,322
the study.
    Patients were reintubated if they met at least 1 of the
                                                                                                                                 Were not on MV
following criteria: lack of improvement and/or worsening of                                                                        n = 2,955
arterial pH or PaCO2; decreased mental status; decrease in
oxygen saturation to less than 88%, despite use of a high                                 Patients were on MV
FiO2; no improvement in signs of respiratory muscle fatigue;                                   n = 1,367
hypotension, with a systolic blood pressure less than 90 mm
                                                                                                                               Were on MV for less
Hg for more than 30 minutes despite adequate volume                                                                                 than 48hs
loading and or use of vasopressors; and copious secretions                                                                           n = 773
that the patient could not remove adequately. Extubation
                                                                                          Eligible for the study
failure (EF) was defined as reintubation within less than 48                                     n = 594
hours. Noninvasive ventilation was used to prevent                                                                             Refused to participate
respiratory distress after extubation in all patients with                                                                             n = 21
                                                                                                                                Did not tolerate the
chronic obstructive pulmonary disease (COPD) and heart                                                                               first SBT
failure. The use of noninvasive ventilation was not                                                                                    n = 73
considered an EF.                                                                             Participants
                                                                                                n = 500
    Data collected were demographic, Acute Physiology and
Chronic Health Evaluation II (APACHE II) score at first 24
hours of ICU stay and at extubation, ICU admission
                                                                     Extubation success                              Extubation failure
diagnosis, comorbidities, GCS, days in ICU, MV days,                      n = 386                                        n = 114
drugs used (neuromuscular blocking agents, benzodiaze-
pines, opioids, and adrenocortical steroids), and vital signs.               Fig. 1       Flow diagram of study participants.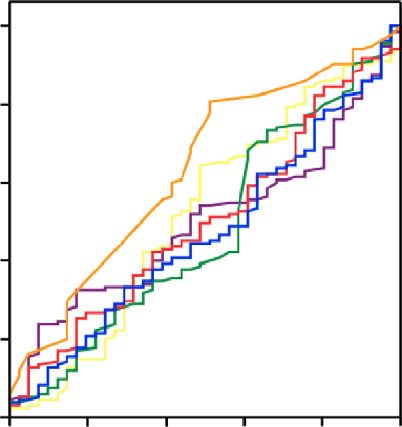
221.e4                                                                                                                           A. Savi et al.

accuracy for all possible predictors of EF (f/VT, CROP, MIP,           Table 2 Ventilatory, hemodynamic parameters, and arterial
MEP, PaO2/FiO2, ff, and VT). All statistical analyses were             blood gas data at MV and SBT
conducted with commercially available software (Statistical            Variable                      ES                EF               P
Package for Social Science 16.0; SPSS Inc, Chicago, Ill).                                            (n = 386)         (n = 114)
Statistical significance was set at P b .05.
                                                                       Blood gases on MV a
                                                                        pH                      7.41 ± 0.08 7.42             ± 0.08     .81
3. Results                                                                PaCO2 (mm Hg)           37 ± 10        38          ± 10       .26
                                                                          Pao2 (mm Hg)           120 ± 43       105          ± 36       .001
                                                                          SatO2 (%)               97 ± 3         96          ±6         .03
   From January 2003 to December 2007, 594 patients
                                                                       Parameters measured at first minute of SBT
fulfilled the study entry criteria and were extubated (Fig. 1).         Ventilatory f/VT          59 ± 32        72          ± 36       .002
We excluded from analysis 21 patients for refusal to                     (breaths per
                                                                         minute per liter)
 Table 1 Demographic characteristics, clinical parameters,              f (rpm)                   24 ± 6         26          ±6         .001
 drug use, and ventilator settings                                        VT (mL)                502 ± 214      435          ± 162      .02
                                                                          MIP (cm H2O)            40 ± 16        40          ± 16       .60
 Variables                         ES           EF            P           MEP (cm H2O)            30 ± 13        29          ± 14       .28
                                   (n = 386)    (n = 114)                 CROP                    52 ± 54        36          ± 29       .004
 Age (y)                           56 ± 19      62 ± 19       .002     Hemodynamic
 Age N65 y (%)                     142 (37)     58 (51)       .002      HR (beats per minute)     91 ± 18        95          ± 21       .06
 Male (%)                          188 (49)     67 (59)       .06       SAP (mm Hg)              133 ± 21       131          ± 22       .20
 Admission APACHE II               19 ± 7       20 ± 7        .24       DAP (mm Hg)               74 ± 13        72          ± 15       .34
 Extubation APACHE II              10 ± 5       11 ± 5        .054      MAP (mm Hg)               94 ± 14        92          ± 15       .20
 GCS at extubation                 14 ± 2       14 ± 2        .48      Parameters measured at 30th minute of SBT
 Hemoglobin concentration          10.1 ± 1.8   9.4 ± 1.3     .81       Blood gases pH          7.39 ± 0.06 7.38             ± 0.08     .45
   (g/dL)                                                                 PaCO2                   36 ± 10        38          ± 11       .1
 MV days                           7±5          7±5           .74         PaO2                    99 ± 32 †      88          ± 27 †     .02
 ICU admission (%)                                                        SatO2                   95 ± 4 †       94          ± 4⁎       .02
  Sepsis                           150 (40)     55 (47)       .10      Ventilatory
  Stroke                           32 (8)       9 (8)         .46       f/VT (breaths per         63 ± 36 ⁎      82          ± 47       .000004
  Postsurgical                     44 (11)      4 (4)         .01        minute per liter)
  Exacerbated asthma               23 (6)       4 (4)         .35       f (rpm)                   25 ± 6 ⁎       28          ±6         .0002
  Pulmonary thromboembolism 19 (5)              11 (10)       .05         VT (mL)                475 ± 170 ⁎ 422             ± 166      .003
  Congestive heart failure         12 (3)       6 (5)         .35         MIP (cm H2O)            39 ± 16        35          ± 16       .06
  Exacerbated COPD                 40 (10)      8 (7)         .9          MEP (cm H2O)            34 ± 19        32          ± 17       .3
  Trauma                           18 (5)       3 (3)         .01      Hemodynamic
 Comorbidities (%)                                                      HR (beats per minute)     95 ± 18 ⁎     100          ± 20       .01
  Hypertension                     109 (28)     37 (33)       .38       SAP (mm Hg)              135 ± 21       134          ± 21       .76
  COPD                             87 (23)      33 (29)       .16       DAP (mm Hg)               77 ± 13        76          ± 15       .88
  Diabetes                         69 (18)      16 (14)       .34       MAP (mm Hg)               95 ± 18        94          ± 19       .78
  Chronic renal failure            49 (13)      10 (8)        .38      SAP indicates systolic arterial pressure; DAP, diastolic arterial pressure.
                                                                         a
  Neuromuscular disease            18 (5)       7 (6)         .52           Values are given as the mean ± SD.
  Immunosuppressed                 19 (5)       7 (7)         .49        ⁎ P b .05 comparing 1st to 30th minute of SBT
                                                                         †
  Stroke                           56 (15)      21 (18)       .31           P b .003 comparing 1st to 30th minute of SBT.
  Cancer                           29 (8)       12 (11)       .35
 Drug use (d)
  Neuromuscular antagonists        0.4 ± 1      0.4 ± 1       .54     participate and 73 for not tolerating the first SBT. At
  Opioids                          3±7          2±7           .22     extubation time, the success and failure groups had similar
  Benzodiazepines                  3±4          3±4           .16     APACHE II score, GCS, hemoglobin concentration, MV
  Adrenocortical steroids          4 ± 10       4 ± 10        .57     days before SBT, ICU admission diagnosis, days of drugs
 Ventilator settings at weaning trial                                 use, and ventilator settings (Table 1). Respiratory sepsis
  PEEP (cm H2O)                    5±1          5±1           .57     (29%) was the most frequent ICU admission diagnosis, and
  Peak pressure (cm H2O)           18 ± 4       19 ± 4        .60     the ICU mortality rate was 14%. Overall, EF occurred in 114
  VT (mL)                          552 ± 162    528 ± 161     .17
                                                                      (22.8%) of the 500 patients included in this analysis. The
  Cdyn (mL/cm H2O)                 46 ± 23      47 ± 25       .95
                                                                      major reasons for reintubation of patients were respiratory
  Fio2 (%)                         36 ± 4       36 ± 4        .59
  PaO2/FiO2                        336 ± 127    292 ± 123     .0008   distress (45/114; 40%), hypoxemia (23/114; 20%), retained
  ETT size                         8.4 ± 0.5    8.2 ± 0.7     .007    secretions (18/114; 16%), hemodynamic instability (12/114;
                                                                      10%), upper airway obstruction (8/114; 7%), and decreased
 Cdyn indicates dynamic compliance; ETT, endotracheal tube.
                                                                      level of consciousness (7/114; 6%). Reintubation occurred in
Weaning predictors do not predict EF 221.e5
Table 3 Outcomes was higher in the group that failed extubation (37% vs
ES (n = 386) EF (n = 114) P 51%; P = .002). Extubation failure correlated with higher
mortality rate and longer ICU stays (Table 3).
ICU LOS 15 ± 12 19 ± 13 .002 Receiver operating characteristic curves were tested for
Hospital LOS 38 ± 38 38 ± 31 .43
presence of a threshold effect, and no cutoff point for the
Mortality in ICU (%) 35 (9) 34 (30) b.0001
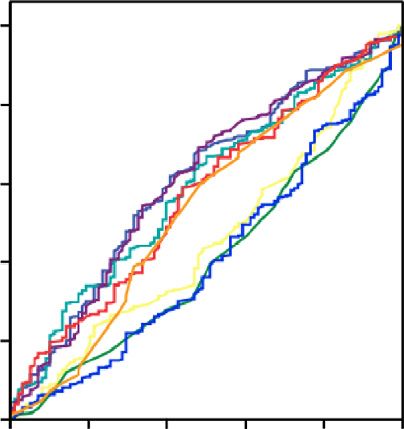
indexes tested was identified. Furthermore, tested variables
LOS indicates length of stay. showed only small areas under the ROC curve (Fig. 2).
The change in respiratory pattern assessed by the percent
changes of f/VT during the SBT as well as the f/VT in the
21 ± 11 hours after extubation. Patients who required 1st and 30th minute of SBT alone did not discriminate the
reintubation were older (62 ± 19 years vs 56 ± 19 years; outcome of extubation.
P = .002), presented a lower PaO2/FiO2 ratio (292 ± 123 vs
336 ± 127; P = .0008) before SBT, had a smaller
endotracheal tube size (8.2 ± 0.7 vs 8.4 ± 0.5; P = .005)
(Table 1), and had a higher f/VT ratio at the 1st and 30th 4. Discussion
minute (72 ± 36 vs 59 ± 32, P = .002; 82 ± 47 vs 63 ± 36,
P = .000004), respectively (Table 2). Moreover, the This study planned to evaluate the performance of
presence of older patients, that is, older than 65 years, weaning predictors in the extubation period and included a
A B
1,0 1,0
0,8 0,8
Sensitivity
Sensitivity
0,6 0,6
0,4 0,4
0,2 0,2
0,0 0,0
0,0 0,2 0,4 0,6 0,8 1,0 0,0 0,2 0,4 0,6 0,8 1,0
1 - Specificity 1 - Specificity
C D
1,0 1,0
0,8 0,8
Sensitivity
Sensitivity
0,6 0,6
0,4 0,4
0,2 0,2
0,0 0,0
0,0 0,2 0,4 0,6 0,8 1,0 0,0 0,2 0,4 0,6 0,8 1,0
1 - Specificity 1 - Specificity
-- PaO /FiO -- CROP -- PaCO -- PaO -- f -- V -- f/V -- MIP
2 2 2 2 T T
Fig. 2 Receiver operating characteristic curve testing weaning predictors frequently used in clinical practice. A, On MV and first minute of
SBT. B, At 30th minute of SBT. C, Variation (δ) from first to 30th minute of SBT. D, Variation (percentages) from 1st to 30th minute of SBT.221.e6 A. Savi et al. heterogeneous population of 3 medical-surgical ICU to Assessment for extubation follows successful completion portray the activity of our everyday clinical practice. In this of SBT. Between 25% and 40% of patients develop signs of relatively large cohort of patients, we did not identify any respiratory distress after extubation [19-21]. Extubation predictor index that discriminated patients who had EF. failure, when defined as reintubation within the subsequent Weaning failure is defined as failure of an SBT (when 24 to 72 hours, occurs in 5% to 20% of patients, depending patients were not extubated) or as failure of extubation upon the patient population [22]. Risk is highest for medical after a successful SBT. All patients included in our and neurologic patients. Reintubated patients exhibit in- analysis passed the SBT, but 23% failed in extubation at creased hospital mortality, prolonged ICU and hospital stays, the first 48 hours. As such, in our daily practice, it is greater need for tracheostomy, and more often a need for important to identify patients who might be subject to long-term acute care [23-25]. Conversely, avoidable delays EF; however, accurate prediction of extubation outcome in extubation prolong ICU stay, heighten risk for pneumonia, continues to be a challenge. and increase hospital mortality. In our cohort, the EF A comprehensive evidence-based review identified more occurred in 23%. These patients presented a mortality rate 3 than 50 objective physiologic tests as tools for assessing times greater than those with ES, corroborating previous readiness for SBT. Only 5 of those were associated with findings [26]. clinically significant changes in the probability of weaning Because both extubation delay and EF are related to success or failure, but predictive capacity was modest [1,9]. adverse outcomes, strategies have been sought to more Many authors [13-15] have suggested that the f/VT ratio is accurately predict and prevent postextubation respiratory one of the best available predictors of combined liberatio- failure. It has been shown that measuring blood gases at the n/extubation outcomes in patients who have not yet end of the SBT does not accurately predict extubation successfully completed an SBT. Because f/VT does not outcome [27,28]. However, the role of blood gases in the help to distinguish extubation outcomes suggests, as extubation decision has been extensively studied. In expected, that it evaluates the ability to breathe without the general, for extubation outcome, weaning predictors ventilator. Our results showed that, in patients who tolerate perform poorly [29]. Ko et al [30] found that weaning SBT, the isolated assessment of weaning predictors at both parameters do not predict EF in neurocritical care patients. the 1st and 30th minute of test cannot discriminate patients Although 1 study found it useful to assess the f/VT at SBT who will succeed from those who will fail. A recent conclusion [31], another found that serial measurements at randomized, blinded, controlled trial with 304 patients 1, 30, and 120 minutes did not improve prediction of risk showed that to include the f/VT ratio in a weaning protocol for EF [32]. One promising technique demonstrated that prolongs the time expected for withdrawal of patients from risk of EF is associated with more time needed to return to ventilatory support. Furthermore, this predictor did not baseline minute ventilation after resumption of full reduce the incidence of EF [16]. In contrast, Navalesi et al ventilatory support [33]. Measuring the airway occlusion [17] found in 318 patients enrolled in a weaning protocol pressure at 0.1 second (P0.1) and the degree of expiratory or control group that combining weaning parameters with flow limitation seem to be good predictors, but measure- an assessment of mental status, secretions, and cough ment at bedside is not simple and requires specific improves prediction of extubation outcome without extend- equipment and trained person [21]. Furthermore, a study ing MV days. We did not evaluate these criteria; however, that enrolled 900 patients described predictors of EF that 16% of our patients required reintubation for retained included positive fluid balance in the 24 hours before secretions, suggesting the importance of such assessment extubation [29] and, in patients with COPD, identifying a for extubation outcome. pathogen by quantitative culture of tracheobronchial A recent review of weaning prediction tests, especially secretions obtained at 72 hours of extubation [20]. The the f/VT ratio, demonstrates a reduction of the threshold f/VT measured during the initial 1 to 3 minutes of unassisted value previously published [18]. This review concluded breathing was the most accurate, although only associated that f/VT is not a consistent predictor of weaning success with a moderate change in the probability of success or but that heterogeneity of the population caused variation in failure [34]. the pretest probability and, consequently, test referral bias. Different from our results, the recent study by Segal et al To minimize influences of predisposition for EF, we, [35] with 72 patients showed that evolution of the breathing therefore, excluded patients who failed in the first SBT pattern, assessed by percent change in f/VT during SBT, was from our analysis. This is an issue in the new classification a better predictor of successful extubation than a single of weaning, where there could be a difference in their determination of f/VT. A 5% increase in f/VT at 30 minutes performance. Another issue is related to how measure- showed an 83% of sensitivity, 78% of specificity, and an area ments are made. In our study, measurement of f/VT was under the ROC curve of 0.83. In addition, the optimal carried out by experienced respiratory physiotherapists threshold during 2 hours of SBT was 20% (sensitivity of using a properly calibrated spirometer; moreover, all the 89% and specificity of 89%). Another recent study proposed protocol procedures were systematically reviewed, and the a new integrative weaning index to assess the outcome of 3 ICU staffs were trained. discontinuing MV [36]. The authors evaluated 331 patients
Weaning predictors do not predict EF                                                                                                                221.e7

and stated that the index displayed a very accurate area under                   [6] Brochard L, Rauss A, Benito S. Comparison of three methods of
the ROC curve; nevertheless, the major problem was to                                gradual withdrawal from ventilatory support during weaning from
                                                                                     mechanical ventilation. Am J Respir Crit Care Med 1994;150:
obtain the static compliance of the respiratory system during                        896-903.
spontaneous breathing.                                                           [7] Ely EW, Baker AM, Dunagan DP. Effect on the duration of
    Failure in the first SBT can occur in about 21% of                               mechanical ventilation of identifying patients capable of breathing
patients, ranging from 14% to 32%, whereas reintubation                              spontaneously. N Eng J Med 1996;335:1864-9.
                                                                                 [8] Valverdú I, Calaf N, Subirana M, et al. Clinical characteristics,
occurs in 3% to 19% [10]. The findings of our study, SBT
                                                                                     respiratory functional parameters, and outcome of two-hour t-piece
failure in 12.7% and EF in 22.8%, could be due to the                                trial in patients weaning from mechanical ventilation. Am J Respir Crit
presence of a large number of elder patients with sepsis                             Care Med 1998;158:1855-62.
(N50% of the EF group were N65 years). We believe that this                      [9] Meade M, Guyatt G, Cook DJ, et al. Predicting success in weaning
group of patients requires a different approach to weaning                           from mechanical ventilation. Chest 2001;120:400S-24S.
[37]. Furthermore, the process and predictors appear to differ                  [10] Boles JM, Bion J, Connors A, et al. Weaning from mechanical
                                                                                     ventilation: statement of sixth international consensus conference on
between weaning and extubation. Many patients who                                    intensive care medicine. Eur Respir J 2007;29:1033-56.
undergo an SBT do not tolerate extubation, suggesting that                      [11] Caruso P, Friedrich C, Denari SDC, et al. The unidirectional valve is
ability to cough and the amount of respiratory secretions                            the best method to determinate maximal inspiratory pressure during
should be used for this decision. We believe that this is the                        weaning. Chest 1999;115:1096-101.
crucial shortcoming in the classical weaning predictor                          [12] Teixeira C, Savi A, Maccari JG, et al. Protocol vs. non-protocol for
                                                                                     weaning from mechanical ventilation: a multicentric study. [abstract]
indexes for the extubation decision.                                                 Int Care Med 2006:S13.
    Some strong points of this study include testing for                        [13] Yang KL, Tobin MJ. A prospective study of indexes predicting the
threshold effect and multicentricity. One important aspect of                        outcome of ventilator trials of weaning from mechanical ventilation.
this study is the real-world analysis of how the predictor                           N Eng J Med 1991;324:1445-50.
indexes were achieved. Most weaning data are generated                          [14] Chatila W, Jacob B, Guanglione D, et al. The unassisted respiratory
                                                                                     rate: tidal volume ratio accurately predicts weaning outcome. Am J
under very controlled circumstances in highly controlled                             Med 1996;101:61-7.
environments and yield overly enthusiastic prediction                           [15] Epstein SK. Etiology of extubation failure and the predictive value
values. Furthermore, our patients were consecutively                                 of rapid shallow breathing index. Am J Respir Crit Care Med
enrolled and unselected.                                                             1995;152:545-9.
    Limitations of our study were exclusion of patients with                    [16] Tanios MA, Nevins ML, Hendra KP, et al. A randomized controlled
                                                                                     trial of the role of weaning predictors in clinical decision making. Crit
a previous failure in SBT, no extrapolation of our results to                        Care Med 2006;34:2530-5.
another population such as difficult-to-wean patients, and                      [17] Navalesi P, Frigerio P, Moretti MP, et al. Rate of reintubation in
lack of control of other criteria such as cough and                                  mechanically ventilated neurosurgical and neurologic patients:
respiratory secretions.                                                              evaluation of a systematic approach to weaning and extubation. Crit
                                                                                     Care Med 2008;36:2986-92.
    Weaning parameters, such as the f/VT ratio, when
                                                                                [18] Tobin MJ, Jubran A. Variable performance of weaning-predictor tests:
evaluated themselves were not good predictors of extubation                          role of Bayes' theorem and spectrum and testes-referral bias. Int Care
outcomes in this large cohort of medical-surgical patients                           Med 2006;32:2002-12.
who had successfully completed the first SBT. This may be                       [19] Esteban A, Frutos-Vivar F, Fergson ND, et al. Noninvasive positive-
due to spectrum bias in this sample of patients.                                     pressure ventilation for respiratory failure after extubation. N Eng J
                                                                                     Med 2004;350:2452-60.
                                                                                [20] Robriquet L, Georges H, Leroy O, et al. Predictors of extubation
                                                                                     failure in patients with chronic obstructive pulmonary disease. J Crit
                                                                                     Care 2006;21:185-90.
References                                                                      [21] Vargas F, Boyer A, Bui HN, et al. Respiratory failure in chronic
                                                                                     obstructive pulmonary disease after extubation: value of expiratory
 [1] Esteban A, Frutos-Vivar F, Tobin MJ, et al. A comparison of four                flow limitation and airway occlusion pressure after one 0.1 second
     methods of weaning patients from mechanical ventilation. N Eng J                (p0.1). J Crit Care 2008;23:577-84.
     Med 1995;332:345-50.                                                       [22] Epstein SK. Decision to extubate. Int Care Med 2002;28:535-46.
 [2] MacIntyre NR, Cook DJ, Ely EW, et al. Evidence-based guidelines for        [23] Esteban A, Alia I, Tobin MJ, et al. Extubation outcome after
     weaning and discontinuing ventilatory support: a collective task force          spontaneous breathing trials with t-tube or pressure support ventilation.
     facilitated by the American College of Chest Physicians; the American           The Spanish Lung Collaborative Group. Am J Respir Crit Care Med
     Association of Respiratory Care; and the American College of Critical           1997;156:459-65.
     Care Medicine. Chest 2001;120:375S-95S.                                    [24] Esteban A, Alia I, Tobin MJ, et al. Effect of spontaneous breathing trial
 [3] Epstein SK, Ciubotaru RL, Wong JB. Effect of failed extubation on the           duration on outcome of attempts to discontinue mechanical ventilation.
     outcome of mechanical ventilation. Chest 1997;112:186-92.                       Spanish Lung Failure Collaborative Group. Am J Respir Crit Care
 [4] Esteban A, Anzueto A, Frutos F, et al. Mechanical ventilation                   Med 1999;159:512-8.
     international study group. Characteristics and outcomes in adult           [25] Epstein SK, Ciubotaru RL. Independent effects of etiology of failure
     patients receiving mechanical ventilation: a 28-day international study.        and time to reintubation on outcome for patients failing extubation.
     JAMA 2002;287:345-55.                                                           Am J Respir Crit Care Med 1998;158:489-93.
 [5] Cooper LM, Linde-Zwirble WT. Medicare intensive care unit use:             [26] Coplin WM, Pierson DJ, Cooley KD, et al. Implications of extubation
     analysis of incidence, costs, and payment. Crit Care Med 2004;32:               delay in brain-injured patients meeting standard weaning criteria. Am J
     2247-53.                                                                        Respir Crit Care Med 2000;161:1530-6.
221.e8 A. Savi et al.
[27] Pawson SR, DePriest JL. Are blood gases necessary in mechanically [32] Teixeira C, Zimermann Teixeira PJ, Hohër JA, et al. Serial
ventilated patients who have successfully completed a spontaneous measurements of f/vt can predict extubation failure in patients with
breathing trial? Respir Care 2004;49:1316-9. f/vt b or = 105? J Crit Care 2008;23:572-6.
[28] Saiam A, Smina M, Gada P, et al. The effect of arterial blood gas [33] Martinez A, Seymour C, Nam M. Minute ventilation recovery time: a
values on extubation decisions. Respir Care 2003;48:1033-7. predictor of extubation outcome. Chest 2003;123:1214-21.
[29] Frutos-Vivar F, Ferguson ND, Esteban A, et al. Risk factors for [34] Epstein SK. Weaning from mechanical ventilation. Curr Opin Crit
extubation failure in patients following a successful spontaneous Care 2009;15:36-43.
breathing trial. Chest 2006;130:1664-71. [35] Segal LN, Oei E, Oppenheimer BW, et al. Evolution of pattern of
[30] Ko R, Ramos L, Chalele JA. Conventional weaning parameters do not breathing during a spontaneous breathing trial predicts successful
predict extubation failure in neurocritical care patients. Neurocrit Care extubation. Int Care Med 2010;36:487-95.
2009;10:269-73. [36] Nemer SN, Barbas CSV, Caldeira JB, et al. A new integrative index of
[31] Kuo PH, Wu HD, Lu BY, et al. Predictive value of rapid shallow discontinuation from mechanical ventilation. Crit Care 2009;13:R152.
breathing index measured at initiation and termination of a 2-h [37] Krieger BP, Isber J, Breitenbucher A, et al. Serial measurements of the
spontaneous breathing trial for weaning outcome in ICU patients. rapid-shallow-breathing index as a predictor of weaning outcome in
J Formous Med Assoc 2006;105:390-8. elderly medical patients. Chest 1997;112:1029-34.You can also read