Marker assisted selection complements phenotypic screening at seedling stage to identify cassava mosaic disease resistant genotypes in African ...
←
→
Page content transcription
If your browser does not render page correctly, please read the page content below
www.nature.com/scientificreports
OPEN Marker‑assisted selection
complements phenotypic screening
at seedling stage to identify
cassava mosaic disease‑resistant
genotypes in African cassava
populations
1* 2 3
Bunmi Olasanmi , Martina Kyallo & Nasser Yao
Cassava mosaic disease (CMD) is a serious threat to cassava production in sub-Saharan Africa. The use
of genomic-assisted selection at the seedling trial stage would help to reduce the time for release,
breeding cost, and resources used, hence increase selection efficiency in cassava breeding programs.
Five cassava populations were screened for resistance to CMD during the seedling evaluation trial
at 1, 3, and 5 months after planting using a scale of 1–5. The genotypes in the five populations
were also screened using six molecular markers linked to the CMD2 gene. The correlation between
the phenotypic and marker data was estimated. Based on Cassava Mosaic Disease Severity Score
(CMDSS), between 53 and 82% of the progenies were resistant across the populations with an
average of 70.5%. About 70% of the progenies were identified to be resistant to the disease across
the populations with a range of 62–80% using the marker data. With both marker data and CMDSS
combined, 40–60% of the progenies in each population, with an average of 52%, were identified to
be resistant to CMD. There was a fairly significant correlation between the marker data and CMDSS
in each cassava population with correlation coefficients ranging from 0.2024 to 0.3460 suggesting
that novel genes not associated to the markers used might be involved in the resistance to CMD. The
resistant genotypes identified in this study with potential for other desirable traits were selected
for evaluation at the advanced trial stage thereby shortening the period required for the breeding
program.
Cassava (Manihot esculenta Crantz) is an important subsistence and food security crop for resource-poor house-
holds in about 40 African countries where it is a mainstay of over 200 million p eople1–5. It is said to be the fourth
most important source of food calories for humans in the t ropics6. Globally, Nigeria is the leading producer of
cassava roots with production estimated at 59.5 million metric t onnes7. In Nigeria, cassava is ranked among the
major food crops supplying 70% of the total calorie intake of about half of the p opulation8. However, CMD, a
devastating and debilitating disease caused by cassava mosaic begomoviruses (CMBs) is constraining cassava
cultivation in all cassava growing areas5,9–12. Some of the improved cassava varieties currently cultivated in Nigeria
are susceptible to CMD. It was reported that African cassava mosaic virus (ACMV) greatly decreased the growth
and yield of susceptible varieties13,14. Strategies for controlling the disease include the use of resistant varieties15–18.
The resistance to CMD is known to be polygenic; the International Center for Tropical Agriculture (CIAT) has
mapped two CMD resistance genes namely CMD1 (recessive gene) and CMD2 (major dominant gene)11,19 and
three molecular markers associated with CMD2, namely RME1, SSRY28, and NS158, were d eveloped20. These
markers are very useful and hold great promise in fast-tracking improvement of cassava for CMD-resistance21.
The molecular markers were used by Bi et al. 21 to screen some varieties of cassava for resistance to CMD. In
1
Department of Agronomy, University of Ibadan, Ibadan, Nigeria. 2Bioscience eastern and central
Africa-International Livestock Research Institute (BecA-ILRI) Hub, Nairobi, Kenya. 3Alliance Bioversity
International-CIAT, CIAT Africa Office, Nairobi, Kenya. *email: bunminadeco@yahoo.com
Scientific Reports | (2021) 11:2850 | https://doi.org/10.1038/s41598-021-82360-8 1
Vol.:(0123456789)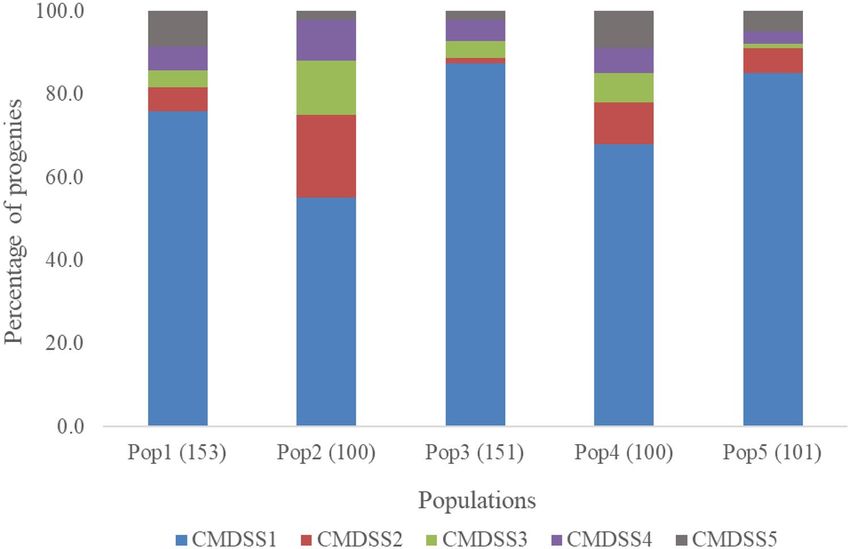
www.nature.com/scientificreports/
Pop Female parent Response to CMD Number of genotypes/pop
1 IITA-TMS-I070593 Resistant 153
2 IITA-TMS-I011371 Tolerant 100
3 IITA-TMS-I070539 Resistant 151
4 IITA-TMS-I011368 Tolerant 100
5 IITA-TMS-I011412 Tolerant 101
Total 605
Check varieties
1 IITA-TMS-97-2205 Resistant
2 IITA-TMS-30572 Tolerant
3 IITA-TMS-30555 Tolerant
4 TME 3 Resistant
Table 1. The cassava populations and the check varieties used for this study.
addition to these markers (RME1, NS158, and SSRY28), markers SSRY106, NS169, and NS198 have been used
in various breeding programs to screen for resistance to C MD22–24.
The conventional methods used for selection in breeding programs are always slow and unreliable. Obtaining
reliable phenotypic data for complex traits is especially difficult and is often the biggest bottleneck to the eventual
application of MAS25,26. There is a need for clonal multiplication of new genotypes to ensure proper phenotypic
evaluation and this may require 4–5 years in conventional breeding because of the low multiplication ratio in
cassava27. According to Xu and Crouch28, some of the main applications of molecular marker technologies in
crop breeding include breeding for traits difficult to improve through conventional phenotypic selection because
they are expensive or time-consuming to measure. They also stated that traits whose selection depends on spe-
cific environments or developmental stages for expression of the target phenotype could be improved using the
marker technologies. Screening for CMD using conventional methods could be unreliable if the genotypes are not
assessed for incidence and severity at the peak of the disease incidence in the locality. The stage of development
of the cassava genotypes at the time of assessment for CMD could lead to wrong selection. Also, data collected
in a season is not reliable enough to select CMD resistant cassava genotypes due to the influence of environment
and seasonal variation on severity and incidence of CMD.
Five cassava populations were developed at University of Ibadan, Nigeria in 2016 for the improvement of cas-
sava for beta-carotene content, CMD resistance, plant architecture, and other desirable traits. To fast-track and
increase precision in the improvement of cassava for important traits, there is a need to complement phenotypic
data collected at the early breeding stage with screening using molecular markers associated with such traits.
Therefore, the objective of this study was to screen newly developed cassava genotypes in the five populations
for CMD resistance using six SSR markers associated with CMD resistance and phenotypic data collected in one
season at the seedling evaluation stage.
Materials and methods
Source of plant materials and phenotype screening for CMD resistance. Six hundred and five
genotypes from five open-pollinated cassava populations involving five female parents in an ongoing breeding
research program at the University of Ibadan Nigeria for improvement of cassava for CMD resistance, beta-car-
otene content, and plant architecture were used for this study (Table 1). The seeds were generated in the 2016/17
growing season and sowed in the nursery in March 2017 on nursery beds at the Research field of Department
of Agronomy, University of Ibadan. The seedlings were transplanted to the field seven weeks after sowing and
the plants were watered for the first two weeks to aid their establishment due to the dry spell at that period. The
field evaluation was done in an uncontrolled environment and the plants were only exposed to a natural source
of inoculum. Whitefly (Bemisia tabaci) which is the vector for CMBs was observed in the field throughout the
evaluation of the plants for CMD.
All the cassava genotypes (progenies, parents, and checks) screened in this study were evaluated for CMD
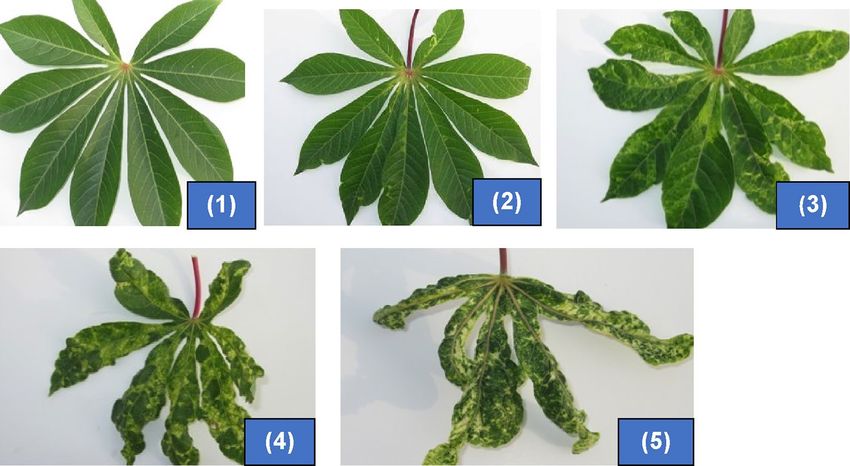
severity at 1, 3, and 5 months after planting (MAP) using the 1–5 scale where 1 represents no symptom expression
and 5, severe symptom e xpression29 (Plate 1). The genotypes were screened at three stages (1, 3, and 5 MAP) in
the life cycle of the plants to ensure the susceptible genotypes without symptoms at a stage are detected at another
stage(s). The maximum CMD severity score (CMDSS) recorded at any of the three stages was used to classify
each genotype. The selection of genotypes in each population for molecular screening was done to include at
least one progeny for each of the CMDSS 2, 3, 4, and 5 while others had CMDSS of 1.
Sample collection and DNA extraction. About 10 g of young leaves were stored in a labeled zip-lock
bag packaged with silica gel to dry the leaves. As a backup, some leaf samples for each genotype/variety were also
collected in labeled paper envelopes and oven-dried at 48 °C for about 48 h. The dry leaves in paper envelopes
were packed in big zip-lock bags with silica gel to avoid the absorption of moisture. All the leaf samples were
shipped to the BecA-ILRI Hub, Nairobi in September 2017 for molecular screening.
Scientific Reports | (2021) 11:2850 | https://doi.org/10.1038/s41598-021-82360-8 2
Vol:.(1234567890)www.nature.com/scientificreports/
Plate 1. Scale used in scoring for cassava mosaic disease1,29. 1 = No visible symptoms (highly resistant).
2 = Mild chlorotic patterns (moderately resistant). 3 = Mosaic patterns on all leaves and leaf distortion (mildly
susceptible). 4 = Mosaic pattern on all leaves, leaf distortion, and a general reduction in leaf size (susceptible).
5 = Misshapen and twisted leaves and stunting of the whole plant (highly susceptible).
Estimated amplicon size
S/N Marker Multiplex group Dye color Final concentration (pM/µl) (bp) Source
1 NS 158 CL2 VIC (Green) 0.040 166 Okogbenin et al.24
2 NS 169 CL2 NED (Yellow) 0.075 319 Okogbenin et al.24
3 NS 198 CL2 PET (Red) 0.075 196 Okogbenin et al.24
4 RME 1 – NED (Yellow) 0.090 700 Okogbenin et al.24
5 SSRY 106 CL1 VIC (Green) 0.090 270 Lokko et al.22
6 SSRY 28 CL1 NED (Yellow) 0.099 180 Lokko et al.22
Table 2. CMD resistance linked SSR markers used in the study along with their estimated amplicon size.
Total DNA was extracted from approximately 150 mg silica gel dried leaf tissue using a ZR-96 Plant/Seed
DNA kit (Zymo Research Corp.) with slight modification whereby 10% dithiothreitol (DTT) was used in place
of beta-mercaptoethanol and the extracted genomic DNA was eluted twice using 50 µl elution buffer each time.
The extracted DNA was analyzed by electrophoresis on a 0.8% agarose gel and the concentration and purity were
determined using a NanoDrop 2000C spectrophotometer (Thermo Fischer Scientific).
CMD resistance screening by PCR and capillary electrophoresis. Six molecular markers (Table 2)
associated with the CMD2 gene used in previous studies22–24,30,31 were selected to screen the cassava genotypes
for CMD resistance. Multiplex PCRs were run after determining the working annealing temperature which
ranged from 50 to 65 °C for each primer using gradient PCR. The product size and dye color of the primers were
considered in forming the multiplex groups. The PCR mix of the final volume of 20 µL contained AccuPower
PCR PreMix without dye (Bioneer, Korea), 0.1–0.2 pM of each primer (Table 2), 30 ng genomic DNA, 0.5 mM
additional MgCl2, and nuclease-free water. Amplification was performed in a GeneAmp PCR System 9700 ther-
mocycler (Applied Biosystems, Foster City, CA) using the following PCR program: initial denaturation at 94 °C
for 3 min; followed by 35 cycles at 94 °C for 30 s, 55 °C for 1 min, and 72 °C for 2 min; and a final extension at
72 °C for 10 min. The multiplex products were size fragmented in a 1.5% agarose gel stained with 0.25× GelRed
(Biotium, USA) and run at 7 V/cm in 0.5× Tris TBE buffer. The gels were visualized under UV light using the
UVP GelDoc-It Imaging System.
The amplified PCR products were prepared for capillary electrophoresis by mixing 0.7–1.5 µl of each
PCR product, depending on their concentration, with 9 µl of HIDI formamide (Applied Biosystems, USA) and
1 µl of GeneScan 500 LIZ Size Standard (Applied Biosystems, USA). The mixture was then denatured at 95 °C
for 3 min followed by snap-chilling on ice-water for 5 min to prevent the denatured DNA from re-annealing. The
fragments were analyzed by capillary electrophoresis on a Genetic Analyzer 3730 (Applied Biosystems, USA) at
the BecA-ILRI hub in Nairobi, Kenya.
Data analysis. The alleles were sized using the GeneMapper version 4.1 (Applied Biosystems, USA). The
microsatellite data (allele size) for all the loci were subjected to allele frequency analysis using PowerMarker soft-
Scientific Reports | (2021) 11:2850 | https://doi.org/10.1038/s41598-021-82360-8 3
Vol.:(0123456789)www.nature.com/scientificreports/
Figure 1. Cassava Mosaic Disease Severity Scores (CMDSS) of progenies in five cassava populations evaluated
in Ibadan, Nigeria in 2017 (progeny size in parenthesis).
ware V3.25. The phenotypic data (CMD severity scores—CMDSS) were subjected to descriptive analysis (mean
and plotting of bar charts) using Microsoft Excel Software. Correlation between the phenotypic and discriminat-
ing marker data was estimated using Statistical Analysis System (SAS) Software Version 9.032. The markers found
to be polymorphic between the resistant and susceptible checks and at the same time discriminating among the
progenies were used to select resistant progenies in each population. Progenies identified as resistant by both the
marker and phenotypic scoring were selected as CMD resistant in this study.
The ability of the markers used in this study to predict the response of genotypes to CMD (resistance or
susceptibility) was assessed by computing the accuracy (ACC) which is the proportion of correctly predicted
genotypes, either as resistant or susceptible; the false-positive rate (FPR) which is the proportion of genotypes
predicted to be resistant but were diseased also referred to as type I error; and the false-negative rate (FNR)
which is the proportion of genotypes predicted to be susceptible but were resistant or type II error. The estimates
were made using the formula below:
Accuracy (ACC) = (TP + TN)/(TP + FN + FP + TN)
False-positive rate(FPR) = FP/(FP + TN)
False-negative rate(FNR) = FN/(FN + TP)
TP = True positive; FP = False positive; TN = True negative; FN = False negative.
Results
CMD severity scores for cassava genotypes evaluated in Ibadan in 2017. The CMDSS of the
progenies in each cassava population screened in this study are shown in Fig. 1. About 76% (457) of the prog-
enies across the five populations were highly resistant to CMD (genotypes with CMD severity score of 1) while
8% (47), 5% (33), 6% (36), and 5% (32) had CMDSS of 2 (moderately resistant), 3 (mildly susceptible), 4 (suscep-
tible) and 5 (highly susceptible), respectively. About 76% or more of the progenies in populations 1, 3, and 5 had
a severity score of 1 while only 55 and 68% of the progenies in populations 2 and 4, respectively, had CMDSS of 1.
Informativeness of selected SSR markers. Marker RME was excluded in the final screening of the
genotypes because the capillary electrophoresis could not analyze fragment sizes larger than 500 bp. The major
allele frequency among the markers ranged from 0.33 (SSRY106) to 0.86 (NS 158) with an average of 0.62 while
the number of genotypes (based on the discrimination among the progenies by each marker) ranged from 7 to
15 with an average of 11.2 (Table 3). The five SSR markers used in this study produced a total of 25 alleles. The
number of alleles per marker ranged between 4 and 6 with an average of 5 alleles per marker.
The gene diversity, level of heterozygosity, and polymorphism information content (PIC) followed the same
pattern among the markers. Markers with high PIC revealed high gene diversity and heterozygosity. Marker SSRY
106 had the highest value for each of the three parameters while NS 158 had the least value for each. Markers
SSRY 028 and SSRY 106 had the same number of genotypes (15) though the latter had higher values for PIC,
heterozygosity, and gene diversity. Consequently, the markers with high major allele frequencies had low values
for PIC, heterozygosity, and gene diversity.
Scientific Reports | (2021) 11:2850 | https://doi.org/10.1038/s41598-021-82360-8 4
Vol:.(1234567890)www.nature.com/scientificreports/
Marker Major allele frequency Number of genotype Number of Alleles Gene diversity Heterozygosity PIC
SSRY028 0.68 15 6 0.5011 0.4209 0.4719
SSRY106 0.33 15 6 0.7576 0.6248 0.7165
NS169 0.75 11 5 0.4053 0.3639 0.363
NS 198 0.49 8 4 0.6257 0.5673 0.5547
NS 158 0.86 7 4 0.2471 0.1311 0.2256
Mean 0.62 11.2 5 0.5074 0.4216 0.4664
Table 3. Allelic diversity parameters for markers linked to CMD resistance. PIC polymorphism information
content.
Population Female parent Number of progenies Correlation coefficient (p value)
1 IITA-TMS-I070593 153 0.2222 (0.0066)
2 IITA-TMS-I011371 100 0.2024 (0.0384)
3 IITA-TMS-I070539 151 0.2056 (0.0111)
4 IITA-TMS-I011368 100 0.3460 (0.0003)
5 IITA-TMS-I011412 101 0.2116 (0.0355)
Table 4. Correlation coefficients between marker data and CMDSS in five cassava populations developed in
Nigeria.
Number of genotypes Number of genotypes
classified resistant by classified resistant by
CMDSS but not by marker marker data but not by Marker data and CMDSS
Pop Female parent Number of progenies CMDSS (%) Marker data (%) data (%) CMDSS (%) (%)
1 IITA-TMS-I070593 153 75 (115) 63 (97) 29 (19) 18 (12) 52 (79)
2 IITA-TMS-I011371 100 53 (53) 66 (66) 13 (13) 28 (28) 40 (40)
3 IITA-TMS-I070539 151 82 (124) 63 (95) 40 (26) 11 (7) 56 (84)
4 IITA-TMS-I011368 100 68 (68) 80 (80) 8 (8) 20 (20) 60 (60)
5 IITA-TMS-I011412 101 74 (75) 62 (63) 22 (22) 9 (9) 54 (54)
Mean 121 70.4 (87) 66.8 (80.2) 22.4 17.2 52.4 (63.4)
Table 5. Proportion of CMD resistant individuals identified in five cassava populations using phenotypic and
marker data along with the corresponding number of genotypes.
Correlation between phenotypic and marker data in five open‑pollinated cassava popula‑
tions. There was a moderate correlation between the marker data and CMDSS in each of the five cassava
populations with correlation coefficients ranging from 0.2024 (population 2) to 0.3460 (population 4) (Table 4).
Based on CMDSS, between 53 and 82% of the progenies were CMD resistant across the five populations with an
average of 70.4% (Table 5). Approximately 70% of the progenies were also identified to be CMD resistant across
the five populations with a range of 62–80% using the marker data. With the marker data and CMDSS combined,
40–60% of the progenies were identified to be CMD resistant with an average of 52.4% across the five popula-
tions. Between 8 and 40 genotypes classified as resistant based on CMDSS were not confirmed so by genetic
marker data while 9–28 genotypes classified as resistant by marker data were susceptible based on phenotypic
data (CMDSS). The rate of misclassification ranged between 26.4 and 39.0% across the five populations while the
level of accuracy ranged between 0.61 and 0.74 (Table 6). The false-positive rate ranged from 0.47 to 0.59 while
the false-negative rate ranged from 0.11 to 0.30 among the populations (Table 6).
Discussion
The observed high number of resistant genotypes in the five populations found in this study is due to the con-
sideration given to CMD resistance during the selection of genotypes for molecular screening, hence, the result
is not a reflection of the level of segregation for CMD in each population. Some of the genotypes characterized
to be resistant at the early growth stage were later found to be susceptible resulting in about 25% of the geno-
types being susceptible. It has been suggested that the increased severity in some genotypes at later stages in
the breeding scheme could be a result of the accumulation of virus in planting materials, as cassava is normally
vegetatively propagated23. This, therefore, calls for thorough screening of cassava genotypes for their response
to CMD across seasons and locations where molecular screening is impossible to ensure that selected genotypes
are certified CMD-resistant.
Scientific Reports | (2021) 11:2850 | https://doi.org/10.1038/s41598-021-82360-8 5
Vol.:(0123456789)www.nature.com/scientificreports/
Truth
Discriminating Misclassification False-positive False-negative
Pop marker Prediction Resistant Susceptible (%) Accuracy rate rate
Resistant 83 18
1 SSRY 106 31.8 0.68 0.50 0.26
Susceptible 29 18
Resistant 44 28
2 NS 158 39.0 0.61 0.58 0.23
Susceptible 13 20
Resistant 88 11
3 SSRY 106 33.8 0.66 0.48 0.31
Susceptible 40 12
Resistant 64 20
4 SSRY 106 26.4 0.74 0.59 0.11
Susceptible 8 14
Resistant 58 9
5 SSRY 106 31.3 0.69 0.47 0.28
Susceptible 22 10
Table 6. Confusion matrix for the polymorphic markers used to screen five cassava populations for resistance
to cassava mosaic disease.
The number of alleles at a determined SSR locus (allelic richness) is the simplest measure of genetic d iversity33.
The allelic richness per locus which varied among the markers from 4 to 6 (with an average of 5) observed in this
study indicates high polymorphism of the selected SSR markers resulting in high display of the genetic diversity
among the progenies in each population relative to CMD resistance. This, therefore, provides ample opportunity
for selection for CMD resistance coded for by the locus the markers are associated with among the genotypes in
the cassava populations. The close range of 4–6 alleles per locus among the markers corroborates the fact that the
markers are linked to the same g ene11,19. However, the observed situation of 9–28 genotypes (depending on the
population) being resistant by marker data but not confirmed by the phenotypic screening calls for reflection on
the type of genetic mechanism and/or action involved in resistance to CMD. Gene pyramiding involving CMD
2 and other CMD resistant genes may therefore be needed to confer stronger resistance to CMD in the region.
The high PIC, gene diversity and heterozygosity observed for most markers indicate a high level of genetic
diversity for CMD resistance in the cassava populations regardless of the number of markers linked to the same
gene used in this study. Polymorphism information content (PIC) is the measure used to calculate the discrimi-
nation power and informativeness of SSR m arkers34, hence, PIC value is a measure of polymorphism among
genotypes for a marker locus used in genetic diversity analysis since it reflects allelic diversity and frequency
among the genotypes35. The PIC can be classified as satisfactory (PIC > 0.5), medium (0.25 ≤ P ≤ 0.5) and low
(PIC < 0.25)34 and markers with PIC values exceeding 0.5 are very efficient in discriminating genotypes and
extremely useful in detecting the polymorphism rate at a particular l ocus36. In our study, two markers (SSRY106
and NS 198) had PIC values that exceeded 0.5 and were most useful in discriminating among the genotypes in the
five populations for CMD resistance. However, the remaining markers with PIC values in the medium range were
also useful in screening the populations for CMD resistance; thereby complementing the two markers with high
PIC and the phenotypic data. It is noteworthy that the PIC values (0.2256–0.7165) observed for the SSR markers
used in this study are higher than the values (0.049–0.375) reported in a study where 105 cassava landraces were
assayed with 195 SNP markers37. The higher PIC values observed in this study is due to the multiallelic nature of
SSRs compared to SNPs which are bi-allelic and can only have PIC values between 0.000 and 0.50037. However,
the range observed for the SSRs used in this study is consistent with values (0.030–0.780) reported in the past
study where 89 accessions of cassava were screened using 35 SSR markers38 despite the difference in the number
of markers used, the population size and the type of alleles concerned. The similarity in the PIC values could
suggest broader use of the SSR markers used in this study for general diversity study and population structure
analysis without the focus on screening for CMD resistance.
The moderate correlation observed between the marker data and CMDSS in the five cassava populations
screened in this study may be because only the CMDSS data collected during the first-year evaluation of the
genotypes using a single plant per genotype (seedling nursery) were used. Earlier studies on screening cassava
genotypes for CMD resistance were carried out over many seasons to ensure the reliability of the d ata22,23. There-
fore, field screening of the genotypes used in this study over years using many vegetative propagules in replicated
trials at advanced breeding stages and possibly across locations may increase the correlation coefficient between
the field scores and the marker data thereby increasing the precision of the markers with the field scores. How-
ever, the use of markers at this early stage using one-year field screening data helps reduce the cost of such field
evaluations and fast track the breeding efforts. Also, earlier studies have shown variation in the consistency of the
markers used in this s tudy30,39, hence, the use of the marker data alone may not be exceptionally reliable. How-
ever, a combination of the phenotypic and marker data in this study increased the precision of identifying CMD
resistant genotypes thereby reducing the rigours of evaluating the genotypes over seasons and across locations.
The high level of disparity in the number of genotypes identified as resistant by CMDSS and marker data as
shown by the rate of misclassification, level of accuracy, false-positive and false-negative rates in this study has
implications in relation to the genetics of resistance to CMD among the progenies in the five populations as well
as strains of the cassava mosaic virus in the area where the cassava genotypes were evaluated. A new source of
CMD resistance was reported in the populations studied in the past24. The genotypes classified as resistant to
CMD by phenotypic data only in this study may also have additional sources of resistance to the disease other
than the CMD2 gene the markers are associated with, hence, there may be a need to screen the populations
Scientific Reports | (2021) 11:2850 | https://doi.org/10.1038/s41598-021-82360-8 6
Vol:.(1234567890)www.nature.com/scientificreports/
further for possible new sources of resistance to CMD. Also, those classified as resistant by markers only but were
susceptible based on phenotypic data suggest there may be other strains of cassava mosaic virus in the research
environment against which the CMD2 gene cannot confer resistance. This, therefore, calls for further investiga-
tion to ascertain if there are new sources of CMD resistance in such cassava genotypes not classified as resistant
by the markers. We also agree with earlier submission that this may provide a solution to one of the major chal-
lenges in cassava breeding which is how to overcome the evolutionary capacity of the disease24. The additional
sources of resistance to the disease are critical in building durable and stable resistance to CMD through gene
pyramiding24,40. There is also a need for a survey of the research area for existing cassava mosaic virus strains.
This will help to ascertain the strains of the virus causing the disease in the region.
Conclusion
We were able to reduce the time needed to screen five new cassava populations for CMD resistance from at
least two years of replicated trials across locations before selection when using the conventional method to less
than a year by using molecular markers and phenotypic data. This study has therefore shown once again that
marker-assisted selection is a powerful tool for fast-tracking cassava breeding programs. However, considering
the moderate significance of the correlation between the field evaluation scores and the marker data, the use of
both methods for selection of resistant genotypes to be evaluated for other traits of interest at advanced breed-
ing stages made before harvesting of the seedling trial would increase the reliability of the selection. Therefore,
in this study, markers were considered alongside the CMDSS to select the resistant genotypes to ensure higher
precision. However, the level of inconsistency between the CMDSS and marker data calls for further studies on
the possible existence of new cassava mosaic virus strains in the research area and likely additional sources of
CMD resistance in the populations or genes interfering in combination to provide resistance. The high level of
genetic variability revealed by these markers also calls for their investigation for broader genetic diversity study
and population structure analysis without reference to the allele sizes for CMD resistance.
Received: 9 November 2020; Accepted: 14 January 2021
References
1. International Institute of Tropical Agriculture (IITA). Starting a Cassava Farm: IPM Field Guide for Extension Agents 4–10 (IITA,
Ibadan, 2000).
2. Nweke, F. I., Spencer, D. S. C. & Lynam, J. K. The Cassava Transformation: Africa’s Best-Kept Secret (Michigan State University
Press, East Lansing, 2002).
3. Henry, G. & Hershey, C. Cassava in South America and Caribbean. In Cassava Biology, Production and Utilization (eds Hillocks,
R. J. et al.) 17–40 (CABI publishing, Wallingford, 2002).
4. Abolore, B. et al. Nurturing Cassava to a Bumper Harvest for Diverse Livelihoods: A Training Manual 24 (Ibadan University Press,
Ibadan, 2019).
5. Houngue, J. A. et al. Response of cassava cultivars to African cassava mosaic virus infection across a range of inoculum doses and
plant ages. PLoS ONE 14(12), 1–14. https://doi.org/10.1371/journal (2019).
6. Udoka, P.O., Egesi, C.N., Ekaete, E. & Ogbuekiri, H. Evaluation of yellow and white root cassava varieties for desirable traits and
seasonal effect. In World Congress on Root and Tuber Crops, Nanning, Guangxi, China, January 18–23 (2016).
7. FAOSTAT (Food and Agriculture Organization of the United Nations). www.fao.org. Accessed on 17 September 2020 (2020)
8. Ezulike, T. O., Nwosu, K. I., Udealor, A. & Eke-Okoro, O. N. Guide to Cassava Production in Nigeria. Extension Guide No. 16 1–10
(National Root Crops Research Institute, Umudike, Nigeria, 2006).
9. Fregene, M., Bernal, A., Duque, M., Dixon, A. & Tohme, J. AFLP analysis of African cassava (Manihot esculenta Crantz) germplasm
resistant to the cassava mosaic disease (CMD). Theor. Appl. Genet. 100, 678–685 (2000).
10. Berry, S. & Rey, M. E. Molecular evidence for diverse populations of cassava-infecting begomoviruses in southern Africa. Arch.
Virol. 146, 1795–1802 (2001).
11. Akano, A. O., Dixon, A. G. O., Mba, C., Barrera, E. & Fregene, M. Genetic mapping of a dominant gene conferring resistance to
cassava mosaic disease. Theor. Appl. Genet. 105, 521–525 (2002).
12. Houngue, J. A. et al. Evaluation of resistance to cassava mosaic disease in selected African cassava cultivars using combined
molecular and greenhouse grafting tools. Physiol. Mol. Plant Pathol. 105, 47–53 (2019).
13. Thresh, J. M., Fargette, D. & Otim-Nape, G. W. Effects of African cassava mosaic geminivirus on the yield of cassava. Trop. Sci. 34,
26–42 (1994).
14. Bisimwa, E., Walangululu, J. & Bragard, C. Cassava mosaic disease yield loss assessment under various altitude agroecosystems in
the Sud-Kivu Region, Democratic Republic of Congo. Tropicultura 33, 101–110 (2015).
15. Mahungu, N. M., Dixon, A. G. O. & Kumbira, J. M. Breeding cassava for multiple pest resistance in Africa. Afr. Crop Sci. J. 2,
539–552 (1994).
16. Owor, B. et al. Field studies and cross protection with cassava mosaic geminiviruses in Uganda. J. Phytopathol. 152, 243–249 (2004).
17. Legg, J. P., Owor, B., Sseruwagi, P. & Ndunguru, J. Cassava mosaic viruses disease in East and Central Africa: epidemiology and
management of a regional pandemic. Adv. Virus Res. 67, 355–418 (2006).
18. Tumwesigye, S. K., Baguma, Y., Kyamuhangira, W. & Mpango, G. Association between accumulation of total cyanogens and
progression of cassava mosaic disease in cassava (Manihot esculenta Crantz). Uganda J. Agric. Sci. 12(1), 13–21 (2006).
19. Fregene, M. et al. Genome mapping in cassava improvement: challenges, achievements and opportunities. Euphytica 120, 159–165
(2001).
20. Lokko, Y. et al. Cassava. In Genome Mapping and Molecular Breeding in Plants, Pulses, Sugar and Tuber Crops (ed. Kole, C.) 249–269
(Springer, Berlin Heidelberg, 2007).
21. Bi, H., Aileni, M. & Zhang, P. Evaluation of cassava varieties for cassava mosaic disease resistance jointly by agro-inoculation
screening and molecular markers. Afr. J. Plant Sci. 4(9), 330–338 (2010).
22. Lokko, Y., Dixon, A., Offei, S., Danquah, E. & Fregene, M. Assessment of genetic diversity among African cassava (Manihot escu-
lenta Crantz) accessions resistant to the cassava mosaic virus disease using SSR markers. Genet. Resour. Crop Evol. 53, 1441–1453
(2006).
23. Okogbenin, E. et al. Marker-assisted introgression of resistance to cassava mosaic disease into Latin American germplasm for the
genetic improvement of cassava in Africa. Crop Sci. 47, 1895–1904 (2007).
Scientific Reports | (2021) 11:2850 | https://doi.org/10.1038/s41598-021-82360-8 7
Vol.:(0123456789)www.nature.com/scientificreports/
24. Okogbenin, E. et al. Molecular marker analysis and validation of resistance to cassava mosaic disease in elite cassava genotypes in
Nigeria. Crop Sci. 52, 2576–2586. https://doi.org/10.2135/cropsci2011.11.0586 (2012).
25. Blair, M. W., Fregene, M. A., Beebe, S. E. & Ceballos, H. Marker assisted selection in common beans and cassava. In Marker-Assisted
Selection (MAS) in Crops, Livestock, Forestry and Fish: Current Status and the Way Forward (eds Guimaraes, E. P. et al.) 81–115
(Food and Agriculture Organization of the United Nations (FAO), Rome, 2007).
26. Ceballos, H., Hershey, C. & Becerra López-Lavalle, L. A. New approaches to cassava breeding. Plant Breed. Rev. 36, 427–504 (2012).
27. Ceballos, H., Kawuki, R. S., Gracen, V. E., Yencho, G. C. & Hershey, C. H. Conventional breeding, marker-assisted selection,
genomic selection and inbreeding in clonally propagated crops: a case study for cassava. Theor. Appl. Genet. 128, 1647–1667. https
://doi.org/10.1007/s00122-015-2555-4 (2015).
28. Xu, Y. & Crouch, J. H. Marker-assisted selection in plant breeding: from publications to practice. Crop Sci. 48, 391–407 (2008).
29. International Institute of Tropical Agriculture (IITA). Cassava in Tropical Africa (A Reference Manual, Ibadan, Nigeria, 1990).
30. Carmo, C. D., Silva, M. S., Oliveira, G. A. F. & Oliveira, E. J. Molecular-assisted selection for resistance to cassava mosaic disease
in Manihot esculenta Crantz. Sci. Agric. 72(6), 520–527. https://doi.org/10.1590/0103-9016-2014-0348 (2015).
31. Rabbi, I. Y. et al. High-resolution mapping of resistance to cassava mosaic geminiviruses in cassava using genotyping-by-sequencing
and its implications for breeding. Virus Res. 186, 87–96. https://doi.org/10.1016/j.virusres.2013.12.028 (2014).
32. SAS. SAS User’s Guide Version 9.0 (SAS Institute Inc., Cary, 2002).
33. Saavedra, J., Silva, T. A., Mora, F. & Scapim, C. A. Bayesian analysis of the genetic structure of a Brazilian popcorn germplasm
using data from simple sequence repeats (SSR). Chil. J. Agric. Res. 73(2), 99–107 (2013).
34. Botstein, D., White, R. L., Skolnick, M. & Davis, R. W. Construction of a genetic linkage map in man using restriction fragment
length polymorphisms. Am. J. Hum. Genet. 32, 314–331 (1980).
35. Makueti, J. T. et al. Genetic diversity of Dacryodes edulis provenances used in controlled breeding trials. J. Plant Breed. Crop Sci.
7(12), 327–339 (2015).
36. Ganapathy, K. N. et al. Genetic diversity revealed utility of SSR markers in classifying parental lines and elite genotypes of sorghum
(Sorghum bicolor L. Moench). Austr. J. Crop Sci. 6(11), 1486–1493 (2012).
37. Prempeh, R. N. A. et al. Assessment of genetic diversity among cassava landraces using single nucleotide polymorphic markers.
Afr. J. Biotechnol. 19(6), 383–391 (2020).
38. Danquah, J. et al. Genetic diversity and population structure analysis of Ghanaian and exotic cassava accessions using simple
sequence repeat (SSR) markers. Heliyon 6(1), e03154 (2020).
39. Ribeiro, P. F., Akromah, R. & Manu-Aduening, J. Using marker assisted selection to hasten screening of cassava cultivars developed
through introgression of cassava mosaic disease (CMD) resistance into cassava landraces in Ghana. J. Agric. Sci. Technol. B 2, 74–80
(2012).
40. Beyene, G. et al. Loss of CMD2-mediated resistance to cassava mosaic disease in plants regenerated through somatic embryogenesis.
Mol. Plant Pathol. 17(7), 1095–1110 (2016).
Acknowledgements
This study was part of the cassava improvement program at University of Ibadan, Nigeria, the home institution
of the first author who is grateful to the institution for granting the study leave that enabled him to carry out this
work at the BecA-ILRI Hub. This study was supported by the BecA-ILRI Hub through the Africa Biosciences
Challenge Fund (ABCF) program. The ABCF Program was funded by the Australian Department for Foreign
Affairs and Trade (DFAT) through the BecA-CSIRO partnership; the Syngenta Foundation for Sustainable Agri-
culture (SFSA); the Bill & Melinda Gates Foundation (BMGF); the UK Department for International Develop-
ment (DFID) and; the Swedish International Development Cooperation Agency (Sida). We would also like to
thank Stephen Adiga, Ruth Eyo, Monsurat Saka, Conrad Addikah, and Benedicta Ojemeh for their assistance
during the establishment of the trial and field screening for cassava mosaic disease.
Author contributions
O.B. developed the populations and screened them on the field for response to CMD; all authors carried out the
genotyping work; O.B. and M.K. carried out the statistical analysis; O.B. wrote the first manuscript with inputs
from M.K. and N.Y.; all authors reviewed and approved the final manuscript.
Competing interests
The authors declare no competing interests.
Additional information
Correspondence and requests for materials should be addressed to B.O.
Reprints and permissions information is available at www.nature.com/reprints.
Publisher’s note Springer Nature remains neutral with regard to jurisdictional claims in published maps and
institutional affiliations.
Open Access This article is licensed under a Creative Commons Attribution 4.0 International
License, which permits use, sharing, adaptation, distribution and reproduction in any medium or
format, as long as you give appropriate credit to the original author(s) and the source, provide a link to the
Creative Commons licence, and indicate if changes were made. The images or other third party material in this
article are included in the article’s Creative Commons licence, unless indicated otherwise in a credit line to the
material. If material is not included in the article’s Creative Commons licence and your intended use is not
permitted by statutory regulation or exceeds the permitted use, you will need to obtain permission directly from
the copyright holder. To view a copy of this licence, visit http://creativecommons.org/licenses/by/4.0/.
© The Author(s) 2021
Scientific Reports | (2021) 11:2850 | https://doi.org/10.1038/s41598-021-82360-8 8
Vol:.(1234567890)You can also read