GAZA URBAN PROFILE GAZA CRISIS - DECEMBER 2014 - HUMANITARIANRESPONSE
←
→
Page content transcription
If your browser does not render page correctly, please read the page content below
Gaza Urban Profile
Gaza Crisis

December 2014
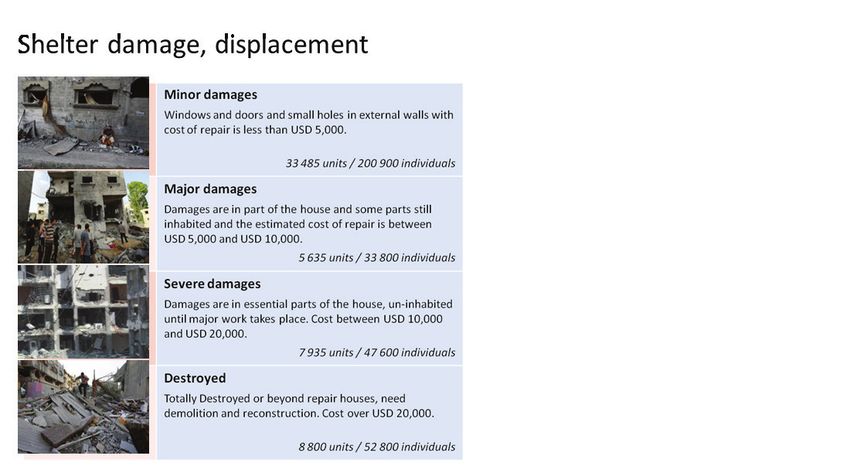
Table of Contents
       INTRODUCTION                                 5
 1     PRE-CRISIS SITUATION

1.1    Gaza Pre-crisis Context                      6
        a   General Description                     6
       b    History and Politics                    6
        c   Urban and Socio Economic Conditions:    7
1.2    Administrative Map of Gaza                   8
        a   Refugee Camps                           9
1.3 Demographic Statistics                          10
        a   Population Characteristics              10
       b    Population Density                      11
        c   Poverty                                 11
       d    Educational Attendance, Literacy Rate   12
1.4 Housing Statistics                              13
        a   Overcrowding, Tenure                    13
       b    Connection to Water and Sewage          14
1.5 Land Ownership and Topography                   15
1.6 Land Cover and Vegetation                       17
 2
 2     POST CRISIS SITUATION

2. 1    Damaged Assessment                          19
        a   Damaged Structures                      19
        b   Heat map                                21
2. 2    Municipalities Assesment of Urgent Needs    22
2. 3    Damaged Infrastructure                      23
2. 4    Displacement Situation                      24
2.5     Summary of Key Findings                     25

 3     MUNICIPAL LEVEL ANALYSIS

3. 1   Gaza Municipality                            28
        a    Governorate Context, Demography        28
       kk
        b    Pre-Conflict Situation                 29
        c    Land Use                               30
        d   Damage Assessment                       31
        e   Photos                                  32

                                                    32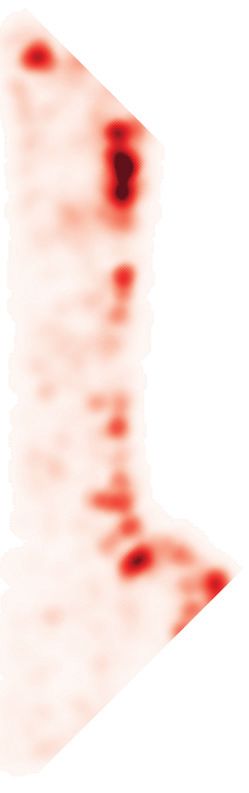
| 4

Introduction

The Israeli military operation that lasted from July 8 to August   impact of the crisis accompanied by narrative description
26, 2014 in the Gaza Strip has led to massive displacement         and analysis.
and destruction of buildings and urban systems (ex. water,
electricity, sanitation). This has greatly exacerbated an          Gaza City profiles are being developed in close coordination
already precarious situation as the long blockade of the           with the active institutions that are currently involved
Gaza Strip had resulted in acute vulnerabilities, including        in the work on Gaza crisis. These include a wide range
a serious housing shortfall. On one hand, neighborhoods            of local and international actors such central and local
have been partially or completely abandoned and return will        governments institutions, humanitarians aid agencies
depend on restoring of basic functionalities and emergency         ,other relevant UN agencies, and the international donor
housing support. In some cases quick return will not be            community. Of particular significance is the collaboration
possible in view of the scale of destruction. On the other         and coordination with all the institutions who are working
hand, neighborhoods that have received displaced families          on damage assessments at various stages and levels, as the
are overstretched. Some neighborhoods witnessed both               urban profiles intend to consolidate existing damages data,
concentrated destruction and inward migration. An overall          analyze and update them. For the completion of priority
picture of the urban conditions of neighborhood, such              areas profiles, support is needed to accommodate further
as shelter, infrastructure, commercial and social services         data collection and updating.
conditions, can help to prioritize, localize and streamline
immediate and longer term interventions. and unleash
opportunities that must be capitalized on. Of particular
importance, is the need to understand the crisis impacts on
vulnerable groups; especially women and children and the
poorest communities throughout the Strip.

UN Habitat seeks to provide up to date urban analysis
of the impact of the crisis in key cities of Gaza, with focus
on most affected neighborhoods, through City Profiles,
synthesizing information and insight from existing sources
and priority sectors, supplemented by direct field research
by UN Habitat teams. Worth mentioning that UN Habitat
expertise in urban analysis, community approaches and
crisis contexts have informed the development of the City
Profiling process in Syria.

In operational terms, urban or city profiles use GIS based
mapping to analyze and present the impact of crisis in
each affected city or urban neighborhood, taking into
consideration damage and displacement, and how they
impact a range of sectors including basic infrastructure,
shelter, education, health, local economy. It considers
the interrelationships between each sector and assesses
local capacity within each. The structure of the City Profile
provides baseline and current situation data to measure the

 Damage Assessments and Data Sources
 The data on damages included in this profile are based on multiple references. However, most of the geo-referenced
 data and maps on structures damages are extracted from the UNOSAT (OCHA) assessment of 27, August, 2014 that was
 based on Satellite images. Many background data were obtained through the shelter Cluster initial damage assessment
 documents. OCHA GIS database was a valuable resource for many produced maps. The Detailed Infrastructure
 Assessment (DNA) that was conducted by UNDP in October, 2014 provided a good source that helped in updating some
                                                                                                                                  5

 of the data and helped in providing an overall picture on the damages across many categories. Profiles produced for
                                                                                                                                  |

 water and wastewater damages were based on maps and assessments produced by the Coastal Municipalities Water
 Utility of Gaza (CMWU), and were cross referenced with the DNA assessment and OCHA data sources. The PCBS census
 data of 2007 are the key source for the pre-crisis profile. Some data were obtained from UNRWA and ECHO.
 For the full achievement of the objectives of urban profiles, it is key to continue updating data related to the impacts of
 the war as they become available. Of particular importance is to geo-reference the damage assessment data of the DNA,
 since it is the most recent and accurate assessment of the damages that can provide a strong background for informing
 interventions and prioritizing them. Equally important is to get more detailed data of urban development aspects on the
 municipal and neighborhoods level from the relevant municipalities and from the field.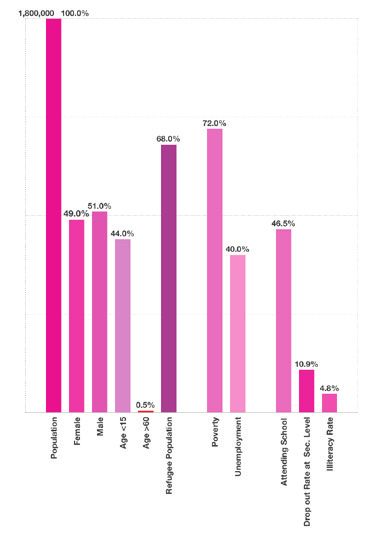
1. GAZA STRIP, PRE-CRISIS SITUATION
    1.1 Gaza Pre-crisis Context:
    A. General Description
    Gaza is a region of Palestine on the eastern coast of the Mediterranean Sea with a
    total area of 360 km21. It has borders with Egypt on the south west for 13 km and with
    Israel across the east and north for 59 km and it has a 40 km long coastline2. The total
    population of Gaza is 1.8 million and it has one of the highest population growth rates
    in the World standing at 3.48%. The Palestinian Central Bureau of Statistics projects the
    population of Gaza to reach 2.13m by 20203.
    Gaza’s geography consists of three longitudinal zones of sands, alluvial soil and
    sandstone ridges. The central agricultural zone attracted inhabitants in the past and
    became the focus for the main mobility routes and it forms the urban backbone of
    the strip. Gaza has five governorates comprising twenty five municipalities, four joint
    councils, and eight refugee camps. Gaza is a highly urbanized region with 74% urban
    population and with an urbanization rate of 3.1% per annum4. Gaza city is the biggest
    and most condensed urban center with 400,000 inhabitants and a density exceeding
    10,000 inh/sqkm while Jabalya Camp and Ash Shati Camp are considered the largest
    and the mostly dense camps with densities exceeding 50,000 inh/sqkm.

    B. History and Politics:
    Gaza was inhabited since the 15th century B.C, and has
    been dominated by many peoples and empires throughout
    its history. It was incorporated into the Ottoman Empire in
    the early 16th Century.
    Following World War II, Gaza became part of the British
    Mandate in Palestine and following the 1948 Israeli-
    Arab war, the newly formed Gaza strip became under the
    Egyptian administration until 1967 when it was occupied by
    Israel.
    Chronicle history of the recent political development in Gaza
    Strip                                                                started after Hamas came to power sealing by that its land, air and
                                                                         sea and severely restricting the move of people and goods from and
    In 1994, Israel granted the Palestinian authority the right of self-
                                                                         into Gaza.
    governance in Gaza but not a sovereign state or territory.
                                                                         In Dec 2008, Israeli army launched series of air strikes on targets in
    In 2000, the Palestinian second intifada broke with waves of
                                                                         Gaza destroying schools, hospitals, mosques, government buildings,
    protests and unrest.
                                                                         and other buildings.
    Between 2000 and 2004, the construction of the separation barriers
                                                                         In Jan 2009, Israel began the ground invasion in Gaza and the
    between Gaza and Israel and Gaza and Egypt were completed.
                                                                         war lasted 22 days. More than 1,200 Palestinian were killed in
    In 2005, Israel withdrew from Gaza under their unilateral this war and tens of thousands of homes and other buildings and
    disengagement plan but continued to control its borders.             infrastructure were destroyed leaving over 50,000 persons without
    In 2006, Hamas won the Palestinian legislative council election and an appropriate shelter.
    became the elected government.                                    In 2012, Israel launched an 8 day operation in Gaza (Pillar of
    In 2007, following Hamas win of the legislative council election, Defense) targeting Hamas infrastructure. During this offensive,
    fighting erupted between Hamas and Fatah for a period of 6 Israel killed more than 158 people and destroyed more than 124
6
|

    months, during which both parties attacked vehicles, personal and houses and more than 238 public institutions (mosques, schools,
    buildings of the other side. Hamas expelled Fatah from Gaza and health, governmental, etc.).
    formed a separate government breaking the unity government ln 2014 Hamas and Fatah, after the reconciliation talks, formed a
    between Gaza and the West Bank. The blockade on Gaza by Israel Palestinian unity government.
    1   “Gaza Factsheet 2014”, the World Bank.
    2   The Palestinian Environmental Authority.
    3   PCBS.
    4   UN-Habitat.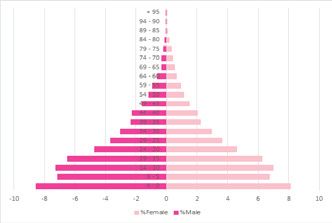
C. Urban and Socio Economic Conditions:                                  and goods but it was destroyed in 2000 at the beginning of
                                                                         the second intifada. The main crossing points between Gaza
During the past 20 years, Gaza has gone through                          and Israel are Erez Crossing to the north and the commercial
considerable urban transformation shaped by the Palestinian              Karni crossing (opens and closes intermittently since 2011).
Authority establishment and the subsequent institution                   The main crossing point between Gaza and Egypt is Rafah
building and boom in construction. However, Hamas ascent                 Crossing to the south. For connection with the outside
to power, years of blockade, and the offensives between                  world, Palestinians from Gaza rely on Egypt as a transit stop.
2008 and 2014 prior to the latest assault have resulted in               Education and health services in Gaza prior to the crisis were
a deteriorating situation in Gaza. According to 2011 PCBS                suffering overcrowding and lack of financial resources.
statistics poverty in Gaza stands at 38%. However, recent
reports by UNDP and OCHA have indicated that between                     In terms of economy, Gaza is considered an urban economy
70-80%1 of Gazans live below poverty line given the recent               depending on internal trade, external aid, communication
offensives and the continuation of the blockade. In addition,            and movement of people. However, Gaza’s economy is
30% of the newborns in Gaza are living with anemia2, 72%                 highly unsustainable due to the restrictions imposed on the
of Gazans are food insecure3, 45% of the agricultural land in            movement of people and goods.
Gaza is out of production, and by the second half of 2014,               Moreover, Gaza is facing a number of environmental
unemployment affected 45%4 of the Gazans.                                challenges including; desertification; salination of fresh
The Gaza Strip is characterized by a housing crisis at                   water; lack of sewage treatment in many parts of the strip;
multiple levels, as a result of high population growth,                  water-borne disease; soil degradation; depletion and
Israeli restrictions on movement and access of people and                contamination of underground water resources.
building materials, and war damages. It was estimated that
before the latest offensive, there was a shortage of 71,000
housing units5.
Prior to the crisis, 97% of the people in Gaza had access to
water networks6, with the ground water from the coastal
aquifer as the primary source. However, in spite of high
coverage, the service is intermittent and ground water is
highly contaminated. This has resulted in the growth of
private enterprises using desalination plants and water
tankers to distribute drinking water to customers. As for
wastewater, it was also estimated that almost 66%7 of
the people had access to sewage collection systems. In
terms of access to energy and electricity, Gaza is suffering
a huge deficit in power supply; most of the population
is experiencing blackouts for more than 15 hours a day.                  The Gaza crisis in 2014, has impacted an already deteriorating
In terms of mobility infrastructure, movement is highly                  humanitarian situation, a struggling governance sector,
dependent on roads transport. In addition, Gaza does not                 an overloaded infrastructure as a result of 8 years of
have an airport, port, or railway system. Although in 1998,              blockade and continuous cycles of violence and political
an airport was opened in Gaza for the movement of people                 fragmentation.

    In July 2014             , the Israeli army launched a military operation in Gaza which lasted for seven weeks of air strikes and ground
    operations. The war has killed more than 2,100 Palestinians and displaced more than 500,000 persons at the hight of conflict. It
    had also destructed more than 13,000 homes and affected another 100,000, in addition to damaging 261 schools and 77 health
    facilities. Moreover, the war has severely affected an already deteriorated infrastructure, water, electricity and sanitary systems.
    The war has also targeted and destroyed more than 220 industrial facilities and caused more than $200,000 Million losses in the
                                                                                                                                               7

    agricultural sector. 8
                                                                                                                                               |

1 “Gaza Crisis Appeal” - OCHA, 2014 and
  “Detailed Infrastructure and Damage Assessment” - UNDP, 2014.
2 Ibid.
3 Ibid.
4 Ibid.
5 Ministry of Public Works and Housing.
6 “Detailed Infrastructure and Damage Assessment” - UNDP, 2014.
7 Ibid.
8 “Detailed Infrastructure and Damage Assessment” - UNDP, 2014.
1.2 Administrative Map of Gaza
Based on PCBS data from the 2007 census
4
2
1 Beit Hanun 49 107 inh. 1
JSC for Solid Waste
North Gaza 55
2 Beit Lahiya 83 195 inh.
3 Jabalya 51 073 inh. 3
4 Umm an Naser 3 628 inh.
5 Gaza 549 070 inh.
5
6 Al Mughraqa 7 990 inh.
Gaza 60
7 Al Zahra 3 771 inh.
8 Wadi Gaza 3 369 inh.
6 7 8
9 Deir al Balah 67 727 inh.
N
10 An Nuseirat 45 616 inh.
10
12
Deir al-Balah 65
11 Az Zawayda 21 074 inh.
13
JSC for Middle Area and JSC for Solid Waste
12 Al Bureij 12 252 inh. 11
JSC for Development
14 Refugee camps
GazaMunicipalities
13 Al Maghazi 8 134 inh. Urbanised area
Salah ad Din street
14 Al Musaddar 2 330 inh. 9 15
15 Wadi as Salqa 5 748 inh.
17
16 Khan Yunis 174 240 inh.
20
17 Al Qarara 24 149 inh.
18
18 Bani Suheila 19
Khan Yunis 70
38 727 inh.
19
21
‘Abasan al Kabira 22 493 inh.
16
20 ‘Abasan al Jadida 7 410 inh. 22
21 Khuza’a 11 174 inh.
23 24
8
22 Al Fukhari 6 766 inh.
|
23 Rafah 152 950 inh. 25
Rafah 75
24 An Naser 7 923 inh.
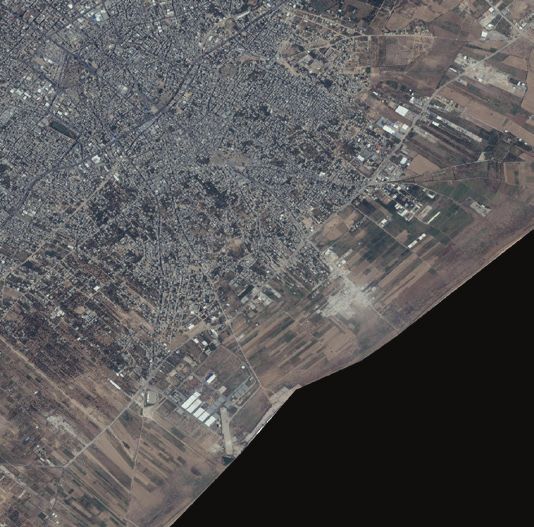
25 Ash Shoka 13 480 inh.1.2a Refugee Camps
There are 8 refugee camps in Gaza (PCBS code)
3 a Jabalya Camp 2755
54 123 inh. Jabalya
5 b Ash Shati (”Beach”) Camp 2775
42 349 inh. Ash
Shati
10 c An Nuseirat Camp 3065
34 950 inh.
12 d Al Bureij Camp 3140
29 867 inh.
N
9 e Deir al Balah Camp 3200 An
Nuseirat
8 009 inh. Al Bureij
13 f Al Maghazi Camp 3210
Al
Maghazi
19 998 inh.
16 g Khan Yunis Camp 3410 Deir al
Balah
46 059 inh.
23 h Rafah Camp 3495
43 405 inh.
There are 8 refugee camps in Gaza strip with a population
of 278,641 residents (PCBS census 2007). Ash Shati and
Khan
Jabalya Camps are considered the largest and the most dense
Yunis
with densities exceeding 50,000 inh/km2. Gaza camps are
characterized with high levels of poverty, poor infrastructure
and lack of services.
Joint Service Councils (JSC)
9
As shown on the table to the left, in Gaza, there are two multi-
|
purpose councils, and two single-purpose councils for solid
waste management. The single-purpose councils are more
operational, and the JSC for Solid Waste in the “middle area” (D) Rafah
serves all 13 municipalities in the governorates of Deir al-Balah
and Khan Yunis.1.3 Demographic Statistics Based on PCBS data from the 2007 census
1.3a Population Characteristics
Population
aged 55%
| 10
Gaza has a young population, and the median age is 18
(compared to a world average of 28). At the time of the
2007 census, around 45% of the population was below 15
years of age. This underlines the importance of including
children and their needs in planning and recovery efforst.1.3b Population Density 1.3c Poverty
(Based on 2009 PCBS Statistics)
4
a za
G
th
N or
a
az
N
G
7 8
Built up area
Population Density Poverty rate (%)
(Peresons/k m2) < 20
(in thousands) 20.1 - 30
50
20 - 30
30 - 40 15
> 40
18
is
un
Yo
n
K ha
22
24
h
fa
Ra
25
| 11
The map shows that the most dense areas in Gaza The map shows that poverty is more prevailing in the
are Refugee Camps with densities that exceed middle and southern governorates (i.e Deir Al Balah,
40,000 persons /km2, followed by the main cities of Khan Younis and Rafah, in addition to Southern Gaza
Gaza, Jabalya, Deir Al Balah, Khan Younis and Rafah (Johr Al Diek) and Umm an Naser in North Gaza.
Governorates with densities that range between 20,000 Poverty in these areas is extreme with rates that exceed
to 40,000 persons /Km2 40% of families living below Gaza poverty line.1.3d Educational Attendance, Literacy Rate
Educational Illiteracy rate
attendance (age 10+)1.4 Housing Statistics Based on PCBS data from the 2007 census
1.4a Overcrowding and Tenure
Average number Percentage of
of persons per owner-occupied
housing unit. housing units.1.4b Connection to Water/Sewage Networks
Percentage living in Percentage living in
units connected to units connected to
water network. sewage network.1.5 Land Ownership
Percentage owned by public/private/waqf Public Private Waqf
aqf
1 Beit Hanun 88%
North Gaza
2 Beit Lahiya 40% 60%
3 Jabalya 88%
4 Umm an Naser 100%
5 Gaza 86%
6 Al Mughraqa 79%
Gaza
7 Al Zahra 85%
8 Wadi Gaza 85%
9 Deir al Balah 85%
10 An Nuseirat 99%
11 Az Zawayda 100%
Deir al-Balah
12 Al Bureij 87%
13 Al Maghazi 90%
14 Al Musaddar 97%
15 Wadi as Salqa 82%
16 Khan Yunis 41% 57%
17 Al Qarara 68% 23%
18 Bani Suheila 93%
Khan Yunis
19 ‘Abasan al Kabira 99%
20 ‘Abasan al Jadida 99%
21 Khuza’a 26% 74%
| 15
22 Al Fukhari 96%
23 Rafah 35% 64%
Rafah
24 An Naser 53% 47%
25 Ash Shoka 100%Map of municipalities and land ownership, based on Topographic map.
data from the Ministry of Planning (MOPAD).
4 1
2
3
5
Elevation
0-10 m
10-20 m
N
8 20-30 m
6 7
30-40 m
40-50 m
10 12 Ownership 50-60 m
13 Public 60-70 m
11 Private 70-80 m
14
Waqf 80-90 m
90-100 m
9 15 100-110 m
17
20
18 19
21
16
22
24
23
25
| 16
According to this map, the majority of land in Gaza is The Gaza Strip is relatively flat, with elevations ranging
privately owned (63%). Around 2% of the land is classified from 0-110 metres above sea level. The highest areas
as Waqf (properties donated for religious or charitable are found in eastern parts of Khan Yunis Governorate.
purposes). The remaining 35 % are public lands. The lowest areas are in the west, and along the border
between Gaza and Deir al-Balah governorates (Wadi
Gaza).1.6 Land Cover
Percentage of urbanised, bare and arable land 45% - Urbanised Bare Arable - 42%
1 Beit Hanun 30% 48%
North Gaza
2 Beit Lahiya 35% 46%
3 Jabalya 52% 38%
4 Umm an Naser 34% 25%
5 Gaza 56% 34%
6 Al Mughraqa 41% 58%
Gaza
7 Al Zahra 26% 68%
8 Wadi Gaza 17% 62%
9 Deir al Balah 48% 47%
10 An Nuseirat 41% 44%
11 Az Zawayda 39% 57%
Deir al-Balah
12 Al Bureij 19% 56%
13 Al Maghazi 38% 49%
14 Al Musaddar 30% 65%
15 Wadi as Salqa 33% 60%
16 Khan Yunis 41%
17 Al Qarara 39% 54%
18 Bani Suheila 50% 43%
Khan Yunis
19 ‘Abasan al Kabira 29% 67%
20 ‘Abasan al Jadida 28% 58%
21 Khuza’a 28% 60%
| 17
22 Al Fukhari 32% 66%
23 Rafah 28%
Rafah
24 An Naser 46% 51%
25 Ash Shoka 21% 58%Map of land cover - urban/agriculture/bare land. Map showing primary crops and their location.
Based on ECHO mapping of agricultural damage. Data obtained from UNRWA. Date unknown.
N
Land cover Primary crop
Arable Land Almonds
Bare Ground Citrus
Orchard Citrus mixed
Dates
Built up area
Grapes
Greenhouses
Horticulture
Olives
Rainfed crops
| 18
According to this map, 45% of Gaza Strip is covered Major agricultural products in Gaza include citrus,
by buildings and roads, while 42% is agricultural land. dates, olives and flowers. Rainfed crops (e.g. potatoes,
Bare land (12%) is found mainly in the access-restricted cereals, cabbage, peas) are found mainly in the south-
area along the border. Data discrepancies occur for east. Shortage of water and export restrictions have had
the abandoned settlement area in Khan Yunis (16) and severe negative impacts on the sector’s productivity
Rafah (23). and economy.2. GAZA STRIP, POST CRISIS SITUATION
2.1a Damaged Structures
Based on data from UNOSAT assessments. Sum Fully Partially Minor
5 Gaza 3546 37% 28 35 68
1 Beit Hanun 1584 41% 28 31 88
17 Al Qarara 951 46% 16 38 66
25 Ash Shoka 824 61% 18 21 36
8 Wadi Gaza 800 79% 11 10 56
23 Rafah 724 45% 22 33 22
2 Beit Lahiya 716 48% 21 31 32
18 Bani Suheila 702 32% 28 40 103
21 Khuza’a 601 56% 24 20 89
19 ‘Abasan al Kabira 583 50% 22 27 46
16 Khan Yunis 579 37% 23 40 11
9 Deir al Balah 557 46% 16 38 30
3 Jabalya 539 37% 22 41 30
20 ‘Abasan al Jadida 311 32% 23 45 93
14 Al Musaddar 287 69% 14 17 65
15 Wadi as Salqa 277 44% 23 32 43
22 Al Fukhari 277 54% 23 23 30
10 An Nuseirat 251 37% 22 41 27
11 Az Zawayda 153 24% 27 49 22
12 Al Bureij 150 36% 29 35 24
24 An Naser 134 36% 22 42 20
| 19
4 Umm an Naser 113 50% 33 18 38
13 Al Maghazi 62 29% 39 32 19
7 Al Zahra 60 23% 32 45 18
6 Al Mughraqa 17 47% 6 47 4Intensity of Damaged Structures per Intensity of Damaged Structures per
municipality neighborhoods
4 1
2
3
N
5
Number of Number of
damaged damaged
structures structures
1000
9 15 Governorates Governorates
Salah ad Din Salah ad Din
street street
17
20
18 19
21
16
22
24
23
25
| 20
While damages occur in all municipalities, some are more When the mapping of structural damages is broken
heavily affected than others. Gaza city and Beit Hanun down into smaller areas (in this case the statistical
top the list when it comes to the number of structures divisions from PCBS), a pattern emerges showing a
(identified on satellite imagery), but municipalities in higher concentration of damage within a 3 km buffer to
the governorates of Khan Yunis and Rafah also feature the east of Salah ad Din street and along the northern
prominently. border.2.1b Heat Map
3km
45%
of Gaza area
21%
of Gaza buildings1
Salah e l Deeinn S t reet 3km
N
165km2
+ 195km2
71%
of damaged
= 360km2 buildings2
1 Based on building outlines digitised by the
Ministry of Planning and Development.
2 Percentage of damaged structures (including
destroyed, severely and moderately damaged)
mapped by UNOSAT on the basis of Pleiades
satellite imagery from August 27-28, 2014.
Damaged structures per km
0 - 50 300 - 350
50 - 100 350 - 400
3km
| 21
100 - 150 400 - 450
150 - 200 450 - 500
200 - 250 > 500
250 - 300
International boundary
Salah el Deen Street
in Str2.2 Municipalities Assessment of Urgent Needs
Based on quick, internal damage assessment, July 2014 $5 000 000 $10 000 000 $15 000 000
5 Gaza 549 070 inh. $14 210 000
1 Beit Hanun 49 107 inh. $10 765 000
17 Al Qarara 24 149 inh. $1 929 000
25 Ash Shoka 13 480 inh. $1 925 000
8 Wadi Gaza 3 369 inh. $39 000
23 Rafah 152 950 inh. $2 948 100
2 Beit Lahiya 83 195 inh. $3 098 500
18 Bani Suheila 38 727 inh. $4 815 000
21 Khuza’a 11 174 inh. $6 142 000
19 ‘Abasan al Kabira 22 493 inh. $2 012 000
16 Khan Yunis 174 240 inh. $464 520 Legend
9 Deir al Balah 67 727 inh. $729 500 Roads
3 Jabalya 51 073 inh. $3 426 000 Water
20 ‘Abasan al Jadida 7 410 inh. $377 100 Sanitation
14 Al Musaddar 2 330 inh. $596 000 Electricity
15 Wadi as Salqa 5 748 inh. $1 941 000 Solid Waste
22 Al Fukhari 6 766 inh. $432 000 Buildings
10 An Nuseirat 45 616 inh. $1 240 000 Equipment
11 Az Zawayda 21 074 inh. $877 000
12 Al Bureij 12 252 inh. $877 000
24 An Naser 7 923 inh. $95 250
| 22
4 Umm an Naser 3 628 inh. $69 500
13 Al Maghazi 8 134 inh. $702 000
7 Al Zahra 3 771 inh. $933 000
6 Al Mughraqa 7 990 inh. $435 5002.3 Damaged Infrastructure
Based on data from CMWU, 2014
4
PS
PS
PS WTP
PS
PS
PSPS
PS
PS
PS
Water and Wastewater PS Water resources, WWTP
Networks and PS
The concentration of War damages affected
damaged networks mirrors key services allover
the concentration of the Strip. Besides the
PS
damaged to structures. heavy damages of water
The main localities that fall reservoirs and wells along
to the East of Salah El Dein the Eastern 3 Km buffer
WTP
Street are heavily affected, zone, many water wells
such as Bait Hanoun, Al and wastewater pumping
8 Shuja’iyeh Neighborhood stations (PS) were
in Gaza City, Al Qarara damaged in the western
and Al Mussadar in Deir parts of the buffer zone
Al Balah, Khuza’a in PS in North Gaza, parallel
Khan younis and Eastern WTP to the damages of water
Rafah in Rafah. However, and wastewater networks
damaged networks extend in the same areas. In
to the west of Salah el addition, waste water
Dein Street affecting the treatment plants (WWTP)
refugee camps of Jabalya of North Gaza, Gaza and
in the north, and most of Rafah governorates were
15 the Deir Al Balah Camps damaged along with two
as well as Khan Younis and desalination plants in Deir
Rafah Camps. Al Balah.
18
22
24
WTP
25
PS
| 23
Damaged W
water Damaged Water
and W
wastewater Wells
Damaged Water Tank
Network Damaged Desalination
Governorates Plant
PS Damaged Wastewater
l Dein
Salah ad Street
Din str PumpingPumping
Station PStatio
Refugee Camps WTP Damaged WWTP2.4 Displacement Situation
Based on OCHA data
22,541
41,371
Total IDPs before Total IDPs remaining
ceasefire 11,057 in UNRWA schools
(26th of Aug 2014) after ceasefire
(26th of Aug 2014)
90,017
18,085 6,466
78,402
7
61,511 9,287
| 24
IDPs movement between places depended on many factors such as; the severity of attacks in the targeted locations
during the crisis, the adequacy of the living conditions in temporary shelters or with host families, the potentials to find
alternative accommodation, or return to original houses. Therefore , IDPs concentration and distribution across the various
localities within the Strip differed significantly between the onset of the assault, the height of the conflict and after the
ceasefire. IDP’s concentration is also expected to change along the process of reconstruction . It may be difficult also to
track all IDPs temporary movement, especially those residing with host families. As of October 18th, 2014 , the number of
IDPs residing in 18 UNRWA Schools were estimated to be 42,500. In addition, the Ministry of Social Affairs estimated that
additional 47,000 IDPs are residing with host families.2.5 Summary of Findings
Affected Population and Displacement: 13,529 destroyed units, 8,392 severely damaged and 91,445
At the height of the conflict IDPs reached 500,000 partially damaged (as shown in the figures below) .The two
comprising 28% of Gaza population. As of October 18, assessments reveal significant discrepancies in the results,
2014, the remaining IDPs at temporary collective shelters which can be explained by the large number of partially
(18 UNRWA Schools) are estimated to be 42,500 IDPs, while damaged units, that was identified through the detailed
47,000 IDPs1 are residing with host families. The majority assessments of UNDP and UNRWA.
of IDP’s have managed either to return their partially
damaged houses or found alternative accommodation
(i.e temporary, pre-fabricated, rented) accommodation. 16%
16%
Although, the pattern of displacement is not mapped, a
general pattern of displacement from the Eastern side Destroyed
14% Destroyed
towards the Western side of the strip has been witnessed. 14%
Severly damaged
Severely damaged
Partially damaged
Number of displaced population to total population in each Partially damaged
70%
Governorate - Initial Assessments (Shelter Cluster Documents)
70%
Shelter Damage Displacement
Partially damaged
Damages are in part of the house and
some parts are still inhabited and the
estimated cost of repair is between
USD 5,000 and USD 10,000.
91,445 units/ 548,670 individuals
Most Affected Areas:
The concentration of damages was within the 3 km buffer Severely damaged
zone East of Salah El Dein Street that runs the Strip from Damages are in essential parts of the
north to south, and along the northern border. 71% of the house, un-inhabited until major work
takes place. Cost between USD 10,000
damaged buildings are located within this 3km zone. The and USD 20,000.
most affected communities with concentrated damages
were A) Beit Hanoun, Beit Lahia , East Jabalya in North Gaza; 8,392units/ 50,352 individuals
B) Gaza City (Shijaiya and Al Zaitoon neighbourhoods), Wad
Gaza (Joher Al Dick) in addition to multi-storey buildings in Destroyed
Totally destroyed or beyond repair
different neighbourhoods in houses, need demolition and
Gaza; C) Wadi Gaza (Al-Bureij, reconstruction. Cost over USD 20,000.
AlNusairat Camps) and Deir 13,529 units/ 81,174 individuals
Al Balah ,Al Musaddar ,Al
Maghazi Camps in Deir Al
Balah; D) Khuza’a, Al Qarara
Infrastructure and Social Services:
and Bani Suhaila in Khan
The war resulted in severe destruction and damages
Younis, and E) East Rafah (
to the main infrastructure installations, main and local
Ashoka) in Rafah2 . Ranking
infrastructure networks, and basic social services (i.e
Al Shijaiya (Gaza City), Beit
education and health), which caused temporary or
Hanoun, Al Qarara ,Ashoka
permanent disruption of the services across the strip.
and Wadi Gaza to be the
Impacts can be summarized by:
most affected in terms of the
Water: All over the strip, a total of 20,000 m of water pipes
total number of destroyed
have been damaged, in addition to 25 wells, 16 reservoirs,
structures.
and 6 desalination units that have been completely or
Structures and Shelter
partially damaged3 . The concentration of the damages was
Damages
in the Eastern 3km buffer zone, mainly in Bait Hanoun, Al
Shelter damages were severe.
Shuja’iya, Khuzaa, Al Musaddar, and Eastern Rafah (Ashoka),
The total number of damaged structures is not final yet.
| 25
in addition to refugee camps, mainly Jabalya, Nusairat,
However, the preliminary assessment of UNOSAT estimated
Al-Bureij, Deir Al Balah, Al Maghazi and Rafah Camps 4.
the total number to be 14,798 structures. Damaged
In particular, the war have resulted in almost complete
shelters were estimated to be 55,855 housing units, divided
destruction of the networks of Al Shuja’iya, Khuzaa and
between 8,800 destroyed units, 7,953 severely damaged,
and 39,120 partially damaged units. The following detailed Rafah eastern areas 5
assessment by UNDP and UNRWA preliminary estimates
refer to 113,366 damaged housing units divided between
3 “Detailed Infrastructure Damage Assessment of the 2014 Gaza War” - UNDP
1 Ministry of social affairs 4 “Detailed Infrastructure Damage Assessment of the 2014 Gaza War” - UNDP cross referenced
2 UNOSAT Assessment cross referenced with the “Detailed Infrastructure Damage Assessment with CMWU Assessment
of the 2014 Gaza War” - UNDP 5 “Detailed Infrastructure Damage Assessment of the 2014 Gaza War” - UNDPWastewater: A total of 15,000m of sewerage pipelines functionality. The capacity of these areas to provide basic
have been damaged throughout the strip, along with level of services and adequate living environment to their
12 pumping stations that were partially damaged. Gaza, residents is severely reduced, if not completely ceased to
Rafah and Bait Lahia wastewater treatment plans were also exist in parts of these areas.
damaged1. The concentration of the damages is similar to Based on the available data, past and ongoing needs
that of water networks 2. assessment, the following municipalities/neighbourhoods
Roads3: In total, 39, 56 Km of asphalted municipal and or parts of them can be rendered as localities with
regional roads have been damaged, in addition to 11.1km severely difficult living conditions that need immediate
of interlock-tiled roads that were destroyed by the war interventions to bring them back to an acceptable level
and the war aftermath throughout the Gaza Strip. The of urban functionality. These areas lack adequate level of
concentration of damages was to the Eastern side of Salah mobility due to closed internal roads, and lack functioning
El Dein Road, mainly in Al Shuja’iya neighbourhood, Khuzaa, water and wastewater services. They also suffer from severe
Bani Suhaila ,Qarara and Beit Hanoun. Despite that most electricity outage, in addition to massive destruction of
damaged roads have been opened for traffic by removing structures that cripple housing
debris, they are still not asphalted. Movement of people and other urban and commercial
and goods remain difficult in the Eastern parts. Internal functions: 1
1
roads in Beit Hanoun, Al Shuja’iya and Khuzaa remain closed 1
due to the massive destruction inside these areas. North Gaza Governorate:
Electricity4: During the war, the damages of Gaza power 1 Bait Hanoun
Gaza Governorate:
station fuel tanks and feeder lines resulted in a complete 2
2 Gaza City (Al Shuja’iya
electricity outage throughout the strip. This was partially neighbourhood)
fixed by Gaza Electricity Distribution Company (GEDCO) by 3 Wadi Gaza
October 2014. However, Gaza is left with a deficit of 65% Deir Al Balah Governorate :
of the current peak demand of 350MW. As of October 18th, 3
4 Al Musaddar
due to the damages, and lack of spare parts and materials, Khan Younis Governorate:
Gaza power plant is out of service, depending only on supply 5 Khuzaa
Rafah Governorate: 4
from Egypt and Israel with outages exceed 18 hours /day.
In addition, 20-25% of Gaza population have no electricity. 6 Ash Shoka
Education5 More detailed urban profiling
Out of the existing 520 education facilities in Gaza, 261 of these areas is needed to have
were damaged. Damages were widespread across the better understanding of the 5
government and UNRWA preliminary and secondary damages impacts and identifying
schools. In total, over 559,000 students were affected by the of priority interventions, in
war impacts. Damages were concentrated in the eastern addition to capturing any 6
parts of Gaza Governorate, where 3 schools were totally potential development
destroyed, 4 were severely damaged and 83 were partially opportunities and neighborhood
damaged. The war also impacted schools operation in re-planning options to build
general. The school year started on September 14th three back better Gaza.
weeks later than planned, as 113 schools were used as
shelters for IDPs. As of October 18th, 18 UNRWA schools are Identifying Priority Areas and Interventions
still used as collective shelters for IDPs. Although the most dysfunctional areas represent prioritiy
for interventions, other factors need to be considered.
Health6 Aspects of population size and density, as well as poverty
The Ministry of Health and the World Health Organization rates in localities are important factors. For example,
identified 87 health facilities (hospitals and clinics) to be considering that poverty rates in As Shoka and Khuzaa
assessed. 77 of these were damaged, while 25 were either exceed 40 % gives these two areas priorities for support
totally destroyed or suffered from severe and major damages. and it also impacts the nature of immediate and long terms
The most affected facilities were in Gaza Governorate, where interventions and their components
10 hospitals and 17clinics were damaged.
The following sections of this document aim at using the
Urban Functionality available pre- crisis and damages data available so far to set
In addition to the impacts of infrastructure and social the background for further analysis of these priority areas
| 26
services damages that caused temporary or permanent upon more data and resources availability.
disruption of the services across the Strip, the war
resulted in severe combined impacts on particular areas
and neighbourhoods that hindered/are hindering their
1 “Detailed Infrastructure Damage Assessment of the 2014 Gaza War” - UNDP cross referenced
with CMWU Assessment
2 “Damages Assessment Report Water and Wastewater Infrastructure/CMWU
3 To date, no detailed geo referenced data available. The included data are taken from the UNDP
“Detailed Infrastructure Damage Assessment of the 2014 Gaza War”
4 As 3 above
5 As 3 above
6 As 3 above| 27
3. MUNICIPAL LEVEL ANALYSIS                                                      N

       3.1 Gaza Municipality
       3.1a Governorate Context
       Administrative boundaries, strategic land use                Scale 1:50000
                                                                         Governorate boundary
       The population of Gaza governorate                                Municipal boundary
       is 606 749 (PCBS projection for                                   Statistical divisions
       2014, with an estimated annual
       growth rate of around 3.2%). 90%                                  Historical site
       of the inhabitants live in Gaza                                   Crossing point
       municipality, which is the largest
       municipality in the Gaza strip.

                                                             Gaza

                                                                                            N

              Al Mughraqa

                                                                         Built-up area
                          Az Zahra
                                                                         Urban development
                                                                         Recreation
        The map                               Wadi Gaza                  Agricultural land
        indicates                           (Juhor ad Dik)
                                                                         Wadi Gaza (reserve)
        current and
                                                                         Fisheries site
        future land use
        according to the                                                 Existing industial area
        National Spatial                                                 Proposed industrial area
        Plan from the                                                    Proposed harbour site
        Ministry of Planning.                                            Proposed treatment site
| 28

                                                                                    Topography
                                                                                    1:100000
                                                                                         0

                                                                                         90
The map indicates land ownership classification
in Gaza governorate. Vast majority of the land is
privately owned.
Public
Private
Waqf
Population
Land ownership
1:100000 < 20 000
20 000 - 30 000
30 000 - 40 000
40 000 - 50 000
14 > 50 000
08 09
07
06 10 11
05
04 01
03 12
3.1b Pre-conflict Situation 13
Based on data from the 2007 census (PCBS) 02
Population
The population of Gaza municipality in 2007 was 443 095.
According to PCBS projections, there are 549 070 inhabitants
in 2014 (with an average growth rate of 3.1% per year). The statistical division 12 & 13, population density is not the
population is distibuted quite evenly between different best indicator of overcrowding or levels of urbanisation.
geographical areas. The interest area for detailed analysis – The most densely populated areas in Shuja’iyya are located
statistical division 12 & 13 – had a combined population of between the Old City/Salah ad Dein street on one side, and
93 952 (21.2% of the total). Al Karame street on the other side.
| 29
Household size Tenure
There were 67 997 housing units in Gaza municipality Gaza municipality has the lowest percentage of owner-
at the time of the census (2007), resulting in an average occupied units in the region (76%). This could be due
household size of 6.6. Of these units, 12 776 (18.1%) were to multi-storey developments and economic migration
located in statistical division 12 & 13, resulting in an average into the city. 9% of housing units in the municipalities are
household size of 7.4 (the highest in the municipality). identified as rent-paying. In statistical division 12 & 13, only
Density 1 out of every 5 non-owner-occupied units were identified
Because of the amount of agricultural lands included in as paying rent in the 2007 census.3.1c Land Use
Built-up areas and agricultural land with parcels
35 916 buildings were registered in Gaza municipality during the 2007 census. Agriculture - 34%
Around 10% of these (7 966 buildings) were located in statistical division 12 and
13 (but containing 17% of the total number of housing units).
Built-up - 56%
5986
Number of buildings (2007)
Bare - 10%
Per statistical division
14
4286
08
3680
09
3366
3120
07
2813
2686 06 10
11
2195
2224
05
1838
04 01
1734
03 12
1273
13
02
326
389
Legend
Agriculture
Arable land
Grassland/scrub
Statistical divisions
Plot boundaries
| 30
Access-restricted area3.1d Damage Assessment Damaged structures 400-600
Based on UNOSAT data from 28/29 August 2014 1000
divisions. Satellite-based damage assessment data from 14
UNOSAT shows that these areas have been affected very
differently by the conflict, with high concentrations of 08 09
structural damages to the south-east. Statistical division
07
12 and 13, covering the area known as Shuja’iyya, require
particular attention and support due to the amount and 06 10
11
concentration of damages (see detailed map below). 05
04 01
03 12
13
02
Area Sum
12 420 337 288 1045
13 482 332 367 1181
N
Scale 1:20000
| 31
Damage level
Total
Severe
Moderate3.1e Photos
Taken during field visit on September 30, 2014
Some photos illustrate the difficulties of mapping damages from satellite images
1 2
The building to the left is mapped as severly damaged, Burned out houses is an example of difficult damages to
while the 2 floor building to the right is moderately map from aerial imagery. A severely damaged mosque is
damaged. seen in the background.
damaged.
On the right: a building calssified as severely damaged Another example of the difficulties of mapping damages
but not destroyed by UNOSAT. A partially destroyed gvt. from satellite imagery. The building in front can look intact
school in the back. from above.
| 32Al Morabteen Al Rey
a dh Str
eet
ma
nora
a
p
0˚
18
1
| 33
180 panoramic viewYou can also read