Potential to shift goods transport from cars to bicycles in European cities - cyclelogistics - moving Europe forward
←
→
Page content transcription
If your browser does not render page correctly, please read the page content below
cyclelogistics – moving Europe forward

  Potential to shift goods transport from cars to
            bicycles in European cities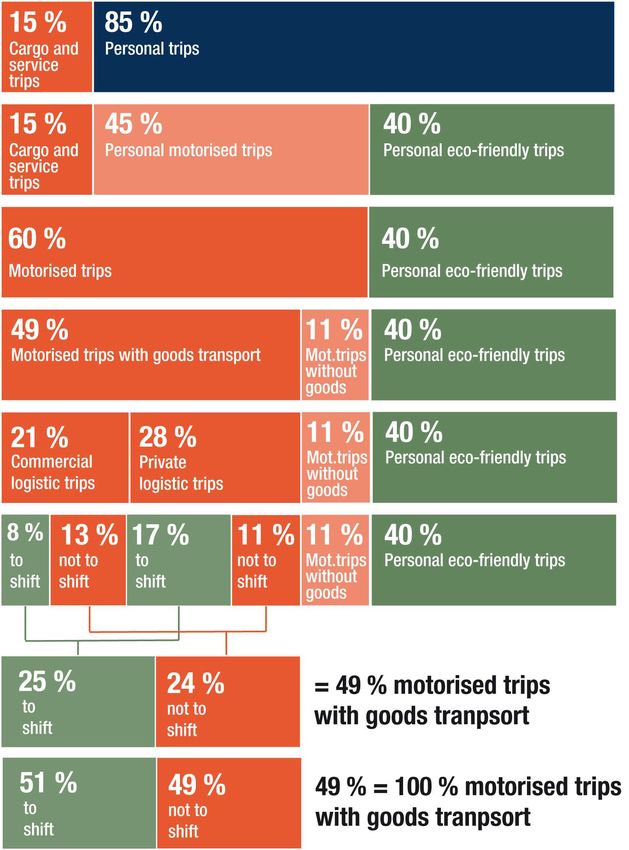
D7.1 A set of updated IEE Common
             performance indicators including their
           baseline and assumptions for extrapolation

Grant agreement no:         IEE/10/277/SI2.589419
Project acronym:            Cyclelogistics
Project title:              Moving Europe forward

Start date of the action:   03.05.2011                                 Duration:     36 months
End date of the action:     04.05.2014                                    Version:   4
Date                        February 2014                           Prepared by:     Karl Reiter (FGM-AMOR)
                                                                                     Susanne Wrighton (FGM-AMOR)
                                                               Quality check by:     Randy Rzewnicki (ECF)

Project coordinator:        Karl Reiter                                    Status:   Final
                            0043 316 810 451 23
                            reiter@fgm.at                    Dissemination level:

                                                  www.cyclelogistics.eu
D 7.1: Performance indicators and baseline assumptions

Baseline and assumptions for the calculation of energy
and CO2 savings related to Cyclelogistics

General introduction
The definition of Logistics is the transport of goods from A to B. Currently no commonly accepted
definition of urban logistics exists. Some studies define it as the movement of freight vehicles with
the main purpose of goods transport in urban areas. For Cycle Logistics a broader definition of
goods transport in urban areas is used, independent of the vehicle type.
Logistics can be further distinguished by the type of goods that are transported and by the purpose
of the trip:

1)   Transport services of professional carriers like freighters, haulage firms, postal companies and
     international delivery services like DHL or TNT. In urban context, trips often concern the first or
     last mile delivery within a longer transport chain.
2)   Freight transport carried out by the producers or traders themselves. The main activity of these
     companies is therefore located in a different field and the delivery transport only supports their
     business activity. An example for that would be Pizza delivery services.
3)   A special form of goods transport is generated by transport trips where no freight is picked up
     or delivered, but goods or tools are transported to carry out certain services. An example
     would be craftsmen, but also communal services like park maintenance.
4)   Private trips associated with the transport of goods are often not considered as logistics but
     are nevertheless part of this category. Both types of trips are associated with the transport of
     goods whether goods are transported home by a delivery service or by private individuals
     themselves. Shopping is the most common form of private logistics, but often goods are also
     transported in the area of leisure traffic.

www.cyclelogistics.eu                            Page 1 of 26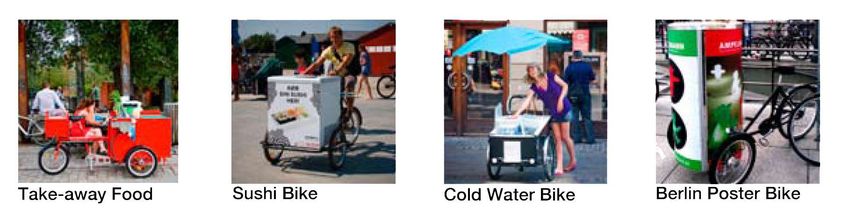
D 7.1: Performance indicators and baseline assumptions

Characteristics of cargo cycling
The field of moving goods by bicycle is related to professional activities as well as to transport
activities by private persons.
The project deals with trips in urban areas and the fact that the bicycle has many advantages over
the car/lorry, in urban areas.
     It can use a denser road network (e.g. one-way roads in both directions, bus lanes – if
     allowed, cycle lanes, etc.)
     It needs less parking space and there are no access restrictions e.g. to deliver in pedestrian
     zones
     It is faster on short distances routes (up to 4 km) and especially at peak hours

For that reasons cyclelogistics is dealing with urban trips and not with long-distance trips. Long-
distance trips are only concerned if they are part of an intermodal trip. These long-distance trips
will be done by train and only the last mile by bicycle.

Definition/demarcation by weight/volume
The second definition concerns the weight and volume of the transported goods. The weight of the
transported goods is defined through the maximal load allowance for bicycles. For commercial
bikes it amounts to 80 – 200 kg, in exceptional cases up to 400kg. But the weight also is an
important factor with regard to determining whether a bike is a suitable means of transport,
especially on hilly terrain.
The transport volume is predefined by the design type of the bicycle and varies between 400 – 800
litres depending on the bike.

Definition of used terms
Personal Transport: refers to commuter (work/education) travel, shopping trips, leisure trips and
business trips. These trip purposes are usually established within household surveys and lead to
modal split results by means of transport and trip purposes (TEMS databasei).
Freight & Service Transport: refers to both freight trips for supply and demand transport within a
city (like delivery or waste collection) and service trips done by business providers associated for
the transport of goods and tools for the execution of their business (e.g. plumber, road
maintenance etc.). These data usually result from business surveys.
Private Transport: Private transport refers to refers to commuter (work/education) travel,
shopping trips and leisure trips. These are all personal trips, without business trips.
Commercial Transport: includes Freight & Service Transport including business trips.
Motorised Trips: all trips done by lorry, van, personal car and motorised 2-wheeler.
Eco-friendly Trips: all trips done by walking, cycling or public transport

www.cyclelogistics.eu                            Page 2 of 26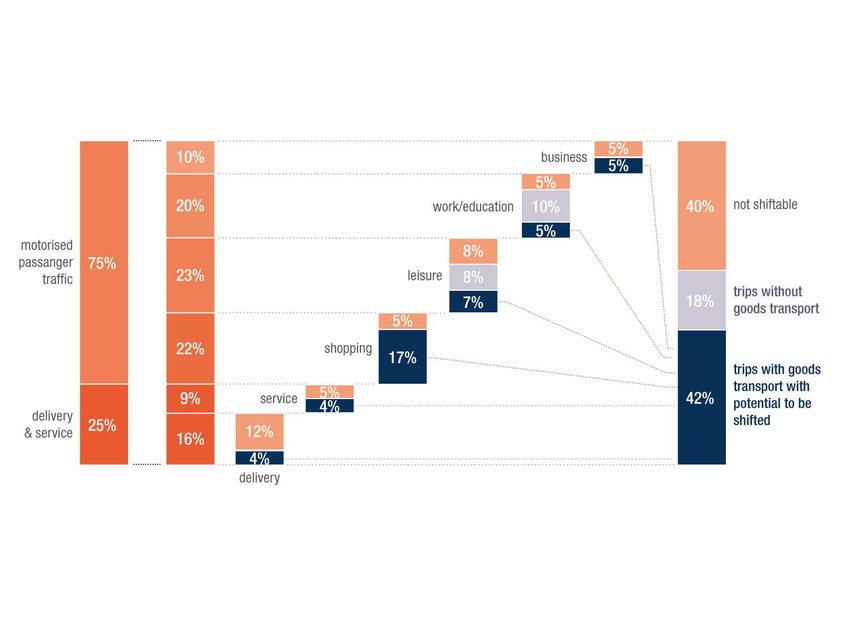
D 7.1: Performance indicators and baseline assumptions

Definition distance and area
In the various surveys used as a basis for this document the term urban is used in a different
context. Sometimes urban refers to an agglomeration and in other surveys urban refers to a city
itself. In this study we use the term urban with regard to a city. Especially the transport behaviour
of individuals that is described here has been based on surveys done in cities (TEMS database).
For cargo bikes, e-bikes and bicycle a distance of 7 km was defined as acceptable and therefore
used within the calculation of the shift potential in this document.

Statistics about urban freight & service transport
High quality statistics are available for long-distance freight transport and for passenger transport
also in urban context. For short-distance freight transport very few data are available. Regarding
the share of urban good trips as part of overall trips, conflicting data exist. This may also be caused
by the different definitions of cargo transport.
In the BESTUFS reportii (2006), a share (of urban good trips as part of overall trips) of 9-15% was
reported for urban areas in France. The “Study on Urban Freight Transport”iii reports that 8-15% of
all trips are done by freight vehicles. The share for Switzerland was 15%iv. For Berlinv and for Graz
the reported share was 20%. An analysis for the City of Stuttgartvi reports commercially motivated
trips in their city amount to 25 – 30% (service trips, business trips and cargo trips). This relates well
to the 15% of cargo trips that is stated within the BESTUF analysis.
Taking into account the different sources an average share for urban freight trips of 15% (10-20%)
has been assumed for the Cyclelogistics Baseline Study. The other 85% of trips are related to
personal transport (business, commuter, shopping, etc).

In the freight category, BESTUFS reported that 1/3 of the trips are related to heavy freight transport
(>3,5t) and 2/3 of the trips are urban freight trips with vehicles weighing less than 3,5 tons.
However, a comprehensive study on motorised transport in Germanyvii states that 60% of all
motorised commercial freight trips (cargo trips, service trips, business trips) are carried out by
regular passenger cars or estates. 25 % are related to vehicles with less than 3,5 t and only 8 % of
all commercial motorized are related to vehicles >3,5 t (and 7% are allocated to vehicles that are
not relevant for the urban context). This means according to this study that less than 1/5 of all
cargo trips are related to heave vehicles (>3,5 t).
In relationship to the overall share of trips in cities this means 12% of all urban trips are deliveries
of light goods. Whereby, in light goods delivery there is a lower degree of capacity utilization
(28%). Out of these 12% of light goods transport there is a big potential for logistics by bicycles,
especially because the vans carry much less load than they are constructed for. Also, goods
transport is often done with vehicles the size of passenger vehicles. Very often these cars are used
for deliveries attached to another core business, like pizza delivery services, or something similar.
Taking the results of existing data into account the urban trips for professional goods transport can
be divided in three categories (1/5 heavy goods with >3,5t vehicles, 1/3 trips with lorries/vans of
less than 3,5t weight that means a load of 0,8-1,5t, and slightly less than every second trip within
urban freight transport is related to very light goods done in small vans, estate cars etc.). It is
evident that the very light urban cargo trips are of great importance for the cycle logistic potential.
But also to some extent the cargo trips in lorries and vans below 3,5 tons (0,8-1,5t load capacity)

www.cyclelogistics.eu                            Page 3 of 26
D 7.1: Performance indicators and baseline assumptions

are of interest for the cycle logistics potential because of the low average load factor in urban
delivery transport.

Vehicles by weight                                                          Share within all urban trips
Share of heavy freight vehicle trips >3,5t                                              3%
Share of trips freight vehicles < 3,5 tons (vans)                                       5%
Share of logistic trips done by cars, small vans, estate car                            7%
Share of urban freight & service transport in relation to all urban trips         15% (10-20%)

Goods transport by bike is mainly suited for short distances and light goods. Therefore, this form of
transportation can play an appropriate role in urban areas and especially in city centres.
Within the general professional urban logistic there seems to be a trend for an increased use of
smaller delivery vehicles. Research in Swissviii cities found out that the number of small delivery
vehicles is remarkably increasing while the number of heavy vehicles is more or less constant.

This can be used as good indicator for the potential of cycle logistics applications. One explanation
for this might be that e-commerce is increasing and more light goods have to be transported that
were purchased directly in shops in the past. On the other hand logistics companies might have
realized that small vehicles are more appropriate for deliveries in cities.

www.cyclelogistics.eu                                    Page 4 of 26
D 7.1: Performance indicators and baseline assumptions

Urban delivery trips, environmental impact and energy use
While the share of goods delivery trips sumps up to 15% of all urban trips the share of energy use
is 30% of all urban transport energy consumption.
The reason is that urban freight transport is almost exclusively done with vehicles that rely on fossil
fuels (diesel and petrol).
According to BESTUFS 20-30% of urban emissions from the transport sector are attributed to
                                  ix
goods transport. In Switzerland it is even 40%. This means that urban freight transport also has a
very high share with regard to environmental impact and energy consumption. Delivery by bicycle
already exists in urban areas e.g. for postal services. I can be assumed that the share of these
trips will be less than 1% of all delivery trips so we calculated with 99% motorised trips for this trip
category.

Urban goods delivery in context with the overall urban transport

Share of trips of urban freight transport                                       15% (10-20%)

Share of km of urban freight transport                                          20% (15-25%)

Share of energy use and emissions of urban freight transport                    30% (20-40%)

Urban personal mobility
With regard to how people travel and transport their personal goods in urban areas it is possible to
distinguish the following transport purposes:
        Business trips related to the transport of goods – these are people pursuing their business,
        e.g. craftsmen or service providers
        Shopping transport
        Leisure transport
        Commuter transport to work and school

There exist various good data for personal transport in urban areas. For this report the results from
Social Datax and from MiD 2008xi for German cities were used, also data from the National Travel
Survey in Finlandxii, mobility data from the EPOMM database TEMSxiii and from the allinx web
platformxiv, as well as the mobility survey from Graz.xv
Taking the different sources into account following proportions arise:

Share of trips                                                                All passenger trips

Business trips                                                                       8%

Shopping trips                                                                       24%

Leisure trips                                                                        27%

Commuter trips (work and school)                                                     26%

Total                                                                                85%

www.cyclelogistics.eu                               Page 5 of 26
D 7.1: Performance indicators and baseline assumptions

The TEMS data of 322 European cities show an average amount of motorised passenger trips of
45% (out of 85%) of all passenger trips. There are plenty of data available concerning the modal
split for the number of trips in European cities. But the methods on how these data are collected
and analysed differ remarkably. No uniform standard method on carrying out surveys on mobility
behaviour in cities /urban areas exists. In 2010 a country wide survey, in 27 EU-countriesxvi,
analysed the main mode of transport. It resulted in a 3 % higher share of motorisation that the
average of the TEMS cities. This can be used as a plausibility check for our calculations, because
the motorisation in cities is usually lower than the country average.

     15 %               85 %
     Cargo and          Personal trips
     service
     trips
                                 Share of all trips in an average European city

Trips done by car and lorry
The share of motorized transport that is involved in trips associated with the transport of goods is
calculated for each trip purpose. To calculate the rate of motorisation per trip purpose surveys
were considered that are close to the mean value of the 322 European cities taken from the TEMS
databasexvii,xviii.
                              xix xx]                                             %
Motorisation by trip purpose     ,
Level of motorization in urban freight and services                               99%
Level of motorization in business transport                                       73%
Level of motorization in shopping transport                                       56%
Level of motorization in leisure transport                                        53%
Level of motorization in commuter transport                                       46%

The average number of all trips done by car, weighted against the share of trips that can be shifted
results in an average factor for the choice for motorized means of transport. This factor, 0.6, was
used for the calculation of the long term outcomes.

www.cyclelogistics.eu                                 Page 6 of 26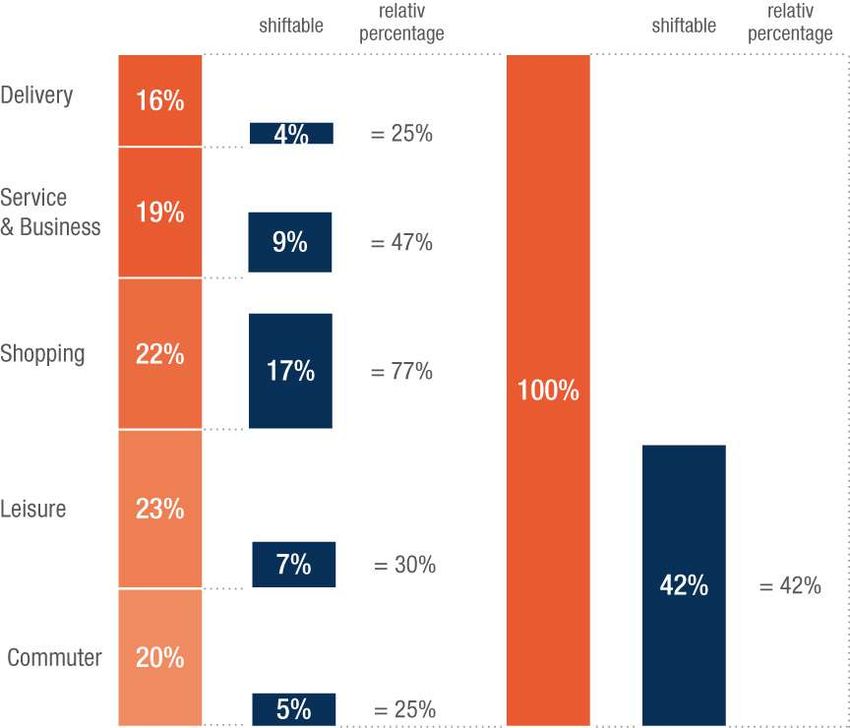
D 7.1: Performance indicators and baseline assumptions
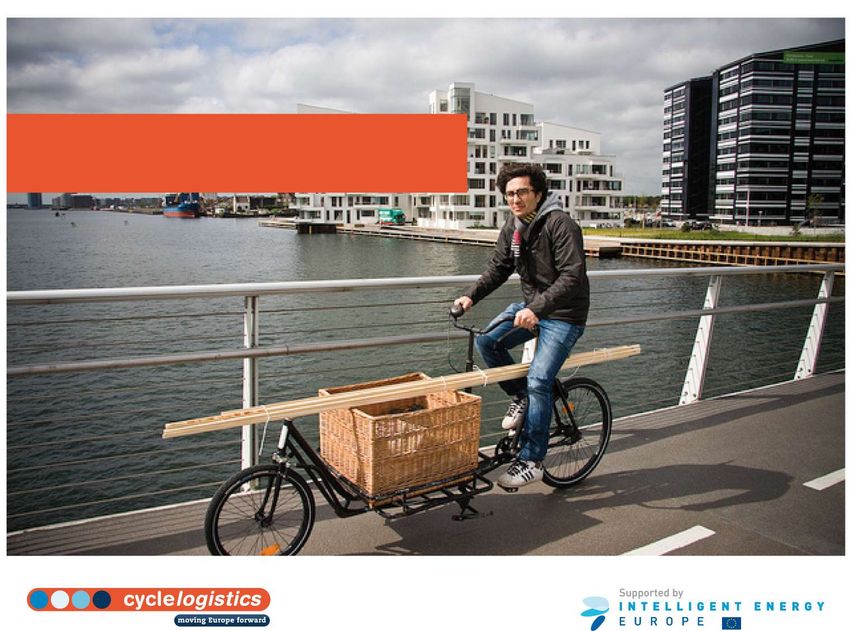
Composition of trips in European cities
15 % 85 %
Cargo and Personal trips
service
trips
15 % 45 % 40 %
Cargo and Personal motorised trips Personal eco-friendly trips
service
trips
60 % 40 %
Motorised trips Personal eco-friendly trips
Share of trips by mode
Freight or goods transport is not only relevant for supply and disposal transport but also for
personal transport connected with the transport of goods.
15% of trips in European cities are related to goods transport done by professional carriers (supply
and disposal) and on average 85% are related to private transport (business, commuter, shopping,
etc.). The private trips are partly also related to transport of goods. The fact that they are carrying
cargo or goods is obvious in the business sector and for shopping trips. But it it important to note that
also leisure trips and commuter trips include a certain share of light goods transport.
For a shift to cycle logistics only motorised trips are of interest for further calculation.
Taking all motorised trips as the basis (60% =100%) of the trips the following split into trip
purposes can be calculated for an average European city.
Share of trips Motorised trips
Business trips 10%
Shopping trips 22%
Leisure trips 23%
Commuter trips (work and school) 20%
Freight/Delivery/Cargo trips 25%
Total of motorised trips 100%
www.cyclelogistics.eu Page 7 of 26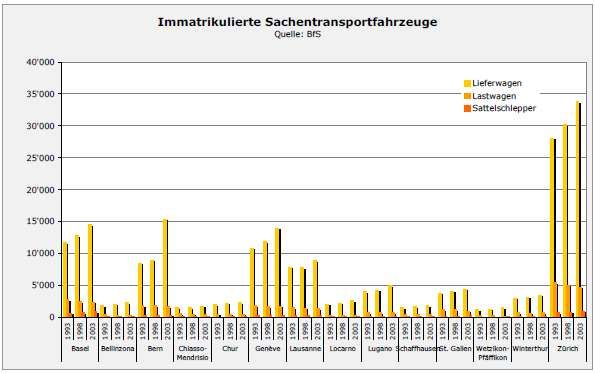
D 7.1: Performance indicators and baseline assumptions

Personal trips in cities involving the transport of goods and their
potential for cycling
Shopping transport
Shopping transport has a share of 22% of all urban motorised trips, and thus represents a high
share of the trips related to light goods transport in a city. While1/5 of all shopping trips result in no
purchasexxi, nevertheless, the possibility of a purchase exists for all shopping trips. So even trips
result in no purchase they need to be taken into consideration also for these cases.
           xxii
Research shows that a car is only required for 6% of all shopping trips. This survey, carried out
in Graz in 2009, had surprising results. Out of 1600 purchases from shopping trips 80% could have
been transported by cycle. Some (14%) the volumes were big they would have required a bicycle
trailer. But only in 6% of the cases was a car necessary to transport the purchases home. Despite
that 77% of all these shopping trips were done by car.

                                        Shopping goods could be        Shopping goods        A car is necessary to
                                        carried in a bike basket /   could be carried in a    carry the shopping
                                                 panniers               bicycle trailer              goods

 Shopping in hardware stores and                  80%                        14%                     6%
 supermarkets related to the required
 means of transport
 Shopping in Supermarkets related to              87%                        12%                     1%
 the required means of transport

The majority of all shopping trips involve the transport of daily goods (food and toiletries)xxiii. In fact,
9 out of 10 shopping trips are done for daily supplies, available in supermarkets. In urban areas
supermarkets are usually located within the catchment area of bicycle traffic. Therefore, the existing
data demonstrate a high potential for shopping transport, both, with regard to transport volumes and
the trip distance. About 1/6 of the shopping trips for daily supplies are done as part of trip chains
and cannot easily be shifted and are therefore not taken into consideration. Shopping trips that are
connected to commuter trips would also require a change of the transport mode used for the trip to
work. These complex shifts are part of the overall potential but not easy to realise.

www.cyclelogistics.eu                               Page 8 of 26
D 7.1: Performance indicators and baseline assumptions
Leisure and commuter trips
Insufficient data are available on leisure transport connected with the transport of equipment is.
Leisure transport consists of many different types. It ranges from holiday trips to day trips to regular
leisure activities like sport, culture, meeting friends etc. In total 27% of all urban trips are attributed
to leisure transport. Based on all motorised trips the leisure transport represents 23% of all
xxiv xxv
motorised trips of citizens. ,
The need for transport is mainly attributed to the area of sports activities and visits but also to day
xxvi
trips or leisure time activities (e.g. picnic). Based on the data of a Swiss survey it was calculated
that 2 out of 3 motorised leisure trips involve the transport of goods. From the 2/3 of trips that
involve goods transport every second trip has the potential to be done by bicycle (taking into
consideration weight/volume and trip length).
Share of leisure time activities in urban areas
High relevant to transport of goods Partly/little relevant to transport of goods
Visits 19,5% Restaurant, Pub 23,5%
Active Sports 14,5% Culture, leisure centres, passive sports 8,3%
Excursions, Holidays, non-paid work etc. 7,4% Non sport activities in the living environment 7,5%
Combined leisure activities 4,4% Activities in member associations , religion 4,9%
Commuter trips to work and school represent 26% of all urban trips. Related to the share of
motorised trips the number is 20 % (15% trips to work, 5% trips to educational sites, mainly school
children as passenger in their parent’s car). For the motorised educational trips the school bag was
identified as light goods. The other part of the potential is related to the trips to work. There are
some target groups that regularly carry work related belongings. For instance, teachers often state
the need to use their car for the transport of their teaching materials. Sometimes the use of the car
is justified solely by the possibility that working materials might have to be transported, when in
reality there is often no need for it, or the materials could easily be transported on a bike. These
assumptions were also taken into account when the potential for goods transport related to
commuter transport was calculated. So every second motorised commuter trip involves goods
transport and every 4th trip can be identified as having the potential to be shifted to the bike.
It would be possible to provide guidance for this target group during the cyclelogistics project with
product information about bicycle baskets, panniers, etc.
www.cyclelogistics.eu Page 9 of 26D 7.1: Performance indicators and baseline assumptions
Trip lengths as a limiting factor for the shift towards
cyclelogistics
Surveys carried out in German and Austrian cities showed that every second trip of private
individuals done with motorised vehicles is shorter than 5 km and 70% of all car trips are shorter
than 7 km.
So 7 out of 10 private car trips fall within the distance criteria formulated within CycleLogistic.
For light goods transport done by professional carriers the trip distance between stops amounts
xxvii
on average to 6 km . Another research result found that most deliveries have trip distances
between 2 and 9 kilometresxxviii. These delivery trips might or might not involve a trip chain.
Therefore, the trip distance is not the only factor that has to be taken into consideration when
estimating the potential of goods delivery trips for a shift to cyclelogistics. However, a French
analysis determined that only 3 out of 10 deliveries trips are part of delivery round or trip chainsxxix
Therefore, it can be concluded that a high share of motorised cargo trips fall within the
bicycle/pedelec distance of 7 km.
xxx
The average trip length for business transport in Graz is 18km. However, this also includes
business trips to other conurbation centres. A survey among businesses in Grazxxxi showed that
37% of the trip lengths of the businesses in question are shorter than 5 km long and 47% are less
than 7 km long (catchment area for Pedelecs).
Shopping transport can be split into 85% relating to trips for daily supplies, 10% relating to goods
like clothes, sports equipment etc. Both taken together thus amount to 95%. Only 5% relate to
shopping for goods that are only purchased once or twice a year, like furniture, etc. Trips for daily
supplies are short trips and are all less than 7 km. This means they all have the potential to be
shifted to the bike the same is true for the 10% related to goods like cloths and sports equipment.
This means that if we apply the distance criteria 95% of all shopping trips are relevant.
For leisure time transport trip distances of the population of Grazxxxii are used for the calculation
and therefore, it is assumed that every second trip is shorter than 5km. A Swiss study about leisure
time transport assumes an average trip length of 11 kmxxxiii, however this includes all leisure time
trips and is not restricted to urban leisure trips. Therefore, our calculations are based on the
mobility survey done in Grazxxxiv.
The same is true for the potential with regard to commuter transport. Educational trips (including
school trips and parent taxi) are identified as trips within the cycle logistics distance criteria (about a
quarter of all motorised commuter trips). Commuter trips (to work) on average involve longer
distances than the average of all car trips carried out within a city. This is confirmed by surveys from
cities within the TEMS database. And data from company transport surveys show that on average 2
out of 3 motorised work trips are shorter than seven kilometres.
To be on the safe side, with regard to the calculations of the specific savings in the area of leisure
trips, an average distance of 5 km was assumed for the trips that have the potential to be shifted
from the car to the bike.
www.cyclelogistics.eu Page 10 of 26D 7.1: Performance indicators and baseline assumptions
Calculation of the potential for Cycle Logistics
The share of motorised trips in European urban areas is on average 60% of all trips. 40% are done
by Public transport, cycling or walking.
Taking all motorised trips as basis for the calculation (60% =100%) we find that 42% of all
motorised trips could be potentially shifted to bicycle transport. Because these trips are:
• Related to light goods transport (more than a handbag less than 200 kg)
• Are short enough (less than 5 km for bike, less than 7 km for e-bike)
• Are not part of a complex trip chain that involves usage of a car.
•
Taking into consideration all motorised trip purposes the percentages shift. For cargo trips this
means that the percentage within this new basis is now 25% because most of them are done with
motorised vehicles. The situation is similar for business trips that also have a high share of
motorisation.
Motorised trips and potential for shifting (Basis: 60% = 100% motorised trips)
Motorised trips Trips to shift to Trips, no goods Motorized trips;
purpose bike/cargo bike involved not to shift
Commuting 20% 5% 10% 5%
Leisure 23% 7% 8% 8%
Shopping 22% 17% 5%
Business 10% 5% 5%
Cargo & Service 25% 8% 17%
Total 100% 42% 18% 40%
This shift of potential is illustrated below. Moreover, this graph shows in detail the potential of shift
from motorized vehicle to bicycle (dark blue) in each of the different trip purpose categories. Trips
with no potential for a shift (light orange) are those trips that are excluded due to the
weight/volume, trip length or trip chain parameter. Trips that do not involve any transport of goods
are represented in gray.
www.cyclelogistics.eu Page 11 of 26D 7.1: Performance indicators and baseline assumptions
Shift of trips to bike and Cargo bike out of all urban motorised trips
www.cyclelogistics.eu Page 12 of 26D 7.1: Performance indicators and baseline assumptions
With regard to the potential the amount of logistic trips carried out by private persons is
remarkable. Seven out of ten trips are related to private transport like shopping goods or leisure
equipment. The biggest potential can be found within shopping trips. Four out of ten trips that have
the potential be shifted are related to this trip purpose. This is more than the entire potential for
commercial logistics (three out of ten trips).
Shift able motorised Shift able
Shift able
Share of trips within all motorised trips
motorised trips
potential motorized trips with within all
within all trips
goods transport motorized trips
Shopping trips 40% 21% 17% 10%
Leisure & commuter trips 29% 14% 12% 7%
Private logistics 69% 35% 29% 17%
Goods delivery and service 19% 10% 8% 5%
trips
Business trips 12% 6% 5% 3%
Professional logistics 31% 16% 13% 8%
Total 100% 51% 42% 25%
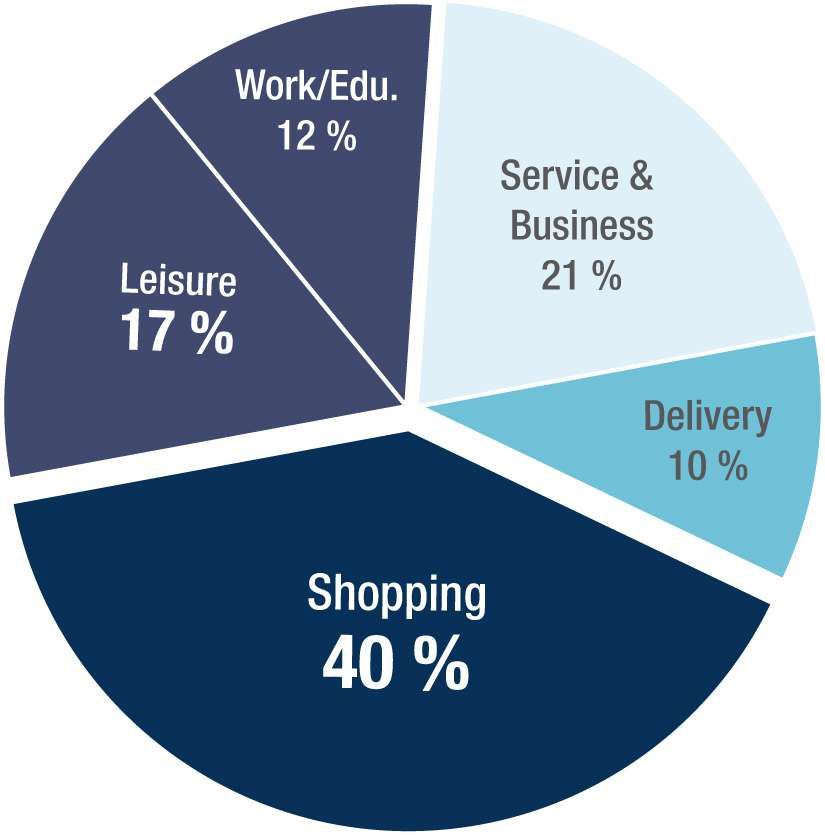
Share between all shift able trips related to trip purpose
Within the potential for Cycle Logistics the private
logistic trips amount to over 2/3 (69%) of the potential
Commercial
trips for a shift towards the bicycle while the professional
31 % logistic sector could contribute 1/3 of the potential.
Private trips Assessing the overall picture the shopping trips could
69 % play a very important role when it comes to measures
to achieve the potential.
Within the private trips the shopping trips are of high
importance. Shopping trips alone represent a bigger
potential for change than all commercial trips
together. But with the increase of online shopping this
sector is changing and parts of the shopping trips will
be replaced by delivery trips of online shopping
items.
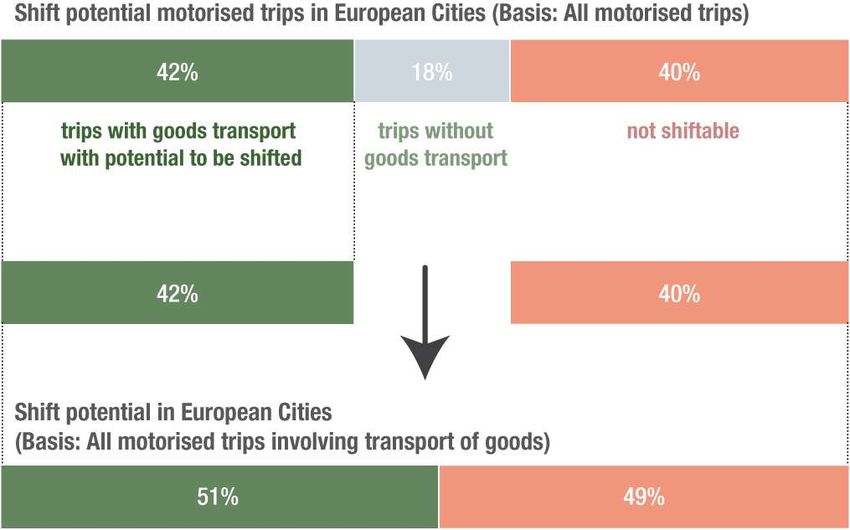
www.cyclelogistics.eu Page 13 of 26D 7.1: Performance indicators and baseline assumptions Taking into account trip distance, weight and volume of goods every second motorized trip in urban areas that involves goods transport has the potential to be shifted to the bicycle! www.cyclelogistics.eu Page 14 of 26
D 7.1: Performance indicators and baseline assumptions

                 Potential for Shifting Trips to Bike and Cargo Bike
                                     in a step by step diagram view

www.cyclelogistics.eu                           Page 15 of 26
D 7.1: Performance indicators and baseline assumptions Limitations of the analysis of the potential The potential for the above calculations was generated by applying the following indicators: - weight/volume of transported goods (everything above 200 kg/m3 was excluded) - trip lengths (everything above 7 km were excluded) - trip chains (were partly excluded) However other limiting factors affecting the use of bicycles (like negative attitude towards cycling, absence of cycling infrastructure, weather conditions, topography, etc.) were not taken into consideration, because these factors vary greatly in different European cities. On the other hand factors that could have a positive influence on the use of bicycles for goods transport (like the existence of cargo bikes that can transport weights up to 400 kg, the availability of high volume cargo bike trailers and the positive effect of micro-consolidation centres for the distribution of goods by bicycle). Would these limiting and/or favouring indicators have been applied to the calculations as well the resulting numbers for the potential might vary slightly. Many data and surveys are available regarding the motorisation or the split of trip purposes in urban areas of private trips. And the present analysis is heavily based on those data. Few data exist on the number of commercial trips and the trip purpose within commercial trips. In this area the calculations were based on the limited amount of data and logical conclusions and reasoning. www.cyclelogistics.eu Page 16 of 26
D 7.1: Performance indicators and baseline assumptions

Breakdown of savings for the strategic savings until 2020
The assumptions on the strategic level were done in a very general way. For this, the proposition
made in various EU-publications that states that 70% of all Europeans live in urban areas was
used as a basis for the calculations.
It is a well know fact from various surveys done in urban areas that inhabitants of cities make 3-4
trips per day. The number for Graz is e.g. 3,7 trips per day plus a 15% value for goods transport
(see baseline chapter in this deliverable) this therefore results in 4,26 trips/day.
This means that the value of 5 trips per day needs to be reduced to the value of 4,3 trips per day.

Share of light good trips
The statements in the baseline study at the beginning of this report demonstrate that the potential
for light goods transport is 60% of all trips in urban areas. If restrictions due to distances, trip
chains and motorisation are also taken into account the potential is reduced to 25% of all trips
(which is equal to 42% of all motorised trips). If electric support for bicycles and cargo cycles will
be used in bigger numbers this amount might even rise. However, all further calculations will be
done with a value of 0,25 (share of shift).

Average trip distance
The assessment of the average trip length is connected with the chosen shift criterion for
reasonable distances for the transport of goods by bike. According to cyclelogistics partner
Outspoken delivery and subcontractor Gnewt logistics, 1,9 km is an average distance for light
goods transport in the delivery sector. If trips with a distance of up to 5 km for bicycles and 7 km for
electric assisted bicycles are considered reasonable, an average trip distance of 2,5 km / 3.5 km
has to be used for the calculations. The same is true for the transport of tools and materials in the
area of private business transport.
For shopping transport the numbers are lower (1,5 km) due to the fact that the share of trips for
daily supplies is high. Where leisure transport is concerned, the trip length is higher (on average 4
km) and the same value has also been used for commuter transport. This results in an average trip
distance of 2,3 km for motorized traffic that could be shifted to bicycles and is related to the
transport of goods.

Average litres of fuel in light goods transport xxxv
The average consumption of fuel was calculated on the basis of the fuel consumption of small
lorries and vans (13l/100km) and the consumption of personal cars for short urban distances
(9l/100km).
Weighted by trip length and trip purposes this leads to an average fuel consumption of 10,4l/100km
of goods related urban transport.

www.cyclelogistics.eu                           Page 17 of 26
D 7.1: Performance indicators and baseline assumptions

Litres into tons (www.aral.de)xxxvi
Density of diesel:      0,845 kg/l
Density of petrol:      0,747kg/l
Weighted by consumption and the fact that diesel is also used for private transport an average
value of 0,796 kg/l fuel is used for the strategic calculations.

Days per year
For goods transport, private business transport and commuter transport the amount of 220 working
days/year are used for the calculations. However, for shopping and leisure transport Saturdays
have also been considered (280 days) too.
For the strategic calculations a value of 220 days per year has been used.

How many trips can be shifted?
Following is an explanation for why we assume that 1 out of 1000 trips will be shifted form car to
cycle transport.
The number 1 of 1000 is already taken form the potential trips – this means trips from an area
where change is really possible.
We have made this assumption because we expect only a small change in behaviour in the next few
years. The European trend still shows an increase in the energy consumption related to transport.
The savings calculated for the cyclelogistics project should be regarded in the light of this trend.
Certainly the numbers can only give an overview and should be considered as one reference point
because different areas in Europe show great differences. In Copenhagen (520.000 inhabitants)
for example 35.000 cargo bikes are in use already. And during the cyclelogistics kick-off-meeting
we were told by Copenhagen logistics experts that even there they see a bigger potential.
Delivery services that utilize cargo bikes have a big effect on the public and on the media.
However, the biggest potential for a shift from the car to the bike is attributed to private logistics
with regard to shopping transport. Here there are no big investments necessary. The purchase of
stable bicycle baskets, panniers or, if necessary, a bicycle trailer, is sufficient. Shopping by bike
can be done in all European cities and regions as long as adequate conditions for bicycle traffic are
available (safe transport options, bicycle parking facilities, etc.). However, it is important to
consider an interaction between the different areas. In Copenhagen, for instance, cargo bikes are
used for different purposes: to transport children, goods, or both at the same time.
With regard to cyclelogistics, we note that forerunner nations like the Netherlands and Denmark
will have an influence on the effect throughout Europe. Not only the Netherlands or Denmark are
represented as partners within the cyclelogistics consortium but there are also subcontractors
from metropolitan centres like Paris and London. Things that happen in these two cities have an
influence on the public perception in the rest of Europe. It is difficult to predict if all regions will be
motivated by the project activities to the same degree – therefore, the assumptions made in this
report are rather conservative. Based on these data and the careful calculations the proposed
savings in fuel presented in Annex I of the CycleLogistics project is about 15.000 tons/year and
the reduction on CO2 emissions is about 37.000 tons/year.

www.cyclelogistics.eu                           Page 18 of 26
D 7.1: Performance indicators and baseline assumptions

Performance indicators and targets of the CycleLogistic project
Long-term outcomes and impact
Strategic objective(s)                        Target by 2020

− Stakeholders in the urban environment       − By 2020 more than 1000 stakeholders in Europe are not only aware
  are aware of the possibility and the          of the possibilities created by cyclelogistics but also integrate them
  advantages of using cargo bikes               into their daily activities and decision making processes.
− European Metropolitan cities should be      − cyclelogistics with partners in Paris, Copenhagen and London will
  the trendsetter for cargo cycling             be established as trend setters in the field
  because of the international media          − Contents applied and promoted within cyclelogistics will applied in
  recognition                                   more than 200 cities within Europe
− Large scale application of cargo bicycles   − 10% of European cities with more than 100.000 inhabitants will
  for delivery services, for communal and       take up bicycles for communal and business services or set up
  business services and integration in the      new/extension of existing delivery services and integrate their use
  local transport policies                      in the local transport agendas
− Raise the number of intermodal              − 1000 trips a year will be shifted to intermodal deliveries.
  deliveries
− Bicycles will be used more for private      − 20% of all shopping trips (= 3% of overall trips), involving goods
  goods transport like shopping because         transport will be shifted from the car to cycling
  more bicycles with e-support will be
  utilised
− To reach a critical mass of sold cargo      − The purchase numbers of cargo bikes and related equipment will
  bikes and bike equipment related to           increase by 10% per year
  goods transport
− To reduce fuel consumption for trips        Energy savings / CO2 savings
  that are related to goods transportation    EU 27 population                                          500.000.000
  and to realize the corresponding CO2
  savings                                     Living in urban areas                                          0,7
                                              Trips a day incl. freight/goods                                4,3
                                              Done by car/lorry                                              0,6
                                              Share of light goods trips to shift                            0,4
                                              Average trip distance km                                       2,3
                                              Average litre fuel/km in urban goods transport                0,104
                                              litre to tons                                               0,000796
                                              (Working)days /year                                            220
                                              Theoretic saving potential/t fuel                          15.130.200
                                              1 out of 1000 trips will be shifted                           0,001
                                              Savings until 2020 / t fuel/year                             15.130
                                              Savings until 2020/ t CO2 per year                           37.370

www.cyclelogistics.eu                                Page 19 of 26
D 7.1: Performance indicators and baseline assumptions Assumptions for specific savings during the project lifetime of the CycleLogistics project AA1 – Goods delivery The savings in AA1 range from the expansion of activities of existing cycle logistic businesses to the initiation of new applications in companies and the initiation of intermodal transports combining bike and rail. It is assumed that 100 new cargo bikes will be in use thanks to the cyclelogistics project. Both, the number of trips as well as the trip length are extrapolated from information available from already existing delivery services. Thereby already existing services will have a higher number of trips compared with newcomers in the field. This number will also vary depending on the number of businesses that transport their goods themselves (e.g. pizza delivery) will shift from motorized vehicles to the bike. We assume a low shift for co-modal trips because at the moment it is not yet clear if Outspoken will actually receive all expected commissions in this application area. However, in the case of a positive development the number could be much higher. For the distance of co-modal trips data from the bicycle couriers from Graz have been used for the calculations. The average fuel consumption of vans was determined by using data from relevant websites that provide real data (www.spritmonitor.de). For urban trips a 15% increase in consumption was assumed. This number coincides with a mean value from test reportsxxxvii. For vans this results in a real consumption of 13l/100km as a calculation basis. The conversion from tons of fuel to tons CO2 has been based on the value for diesel. Working days (weekdays) per year were used as a basis for the calculation. According to our calculations 292 tons will be saved in AA1 per year. AA2 – Municipal services & service providers AA2 deals with the use of cargo bikes for municipal services and services with the need to transport goods or tools. For municipal services a rather moderate number of 20 cargo bicycles were taken as a basis for calculations. We use this figure despite the fact that this is the number of cargo bikes in use for road maintenance services in Copenhagen alone. (Copenhagen uses many more cargo bikes for other city services.) With regard to cargo bikes in use in private businesses it was estimated that 120 bikes would be in use during the project lifetime with an average trip length of 4km. This mean value is rather small for private business services, however it was chosen in order to guarantee a conservative number for fuel savings. All other parameters were the same as in AA1. In AA2 savings of 71 tons are predicted. AA3 – Private goods transport It is assumed that during the 2-3 test months (on average 65 days) 3000 people participating in the “Shop-by-bike” campaign will contribute to savings in the area of shopping transport. It is also assumed that every third participant of this test campaign will maintain this shopping behaviour (1000 persons). In addition it is assumed that 300.000 members of NGOs over Europe are reached during the project lifetime and some of them will also change their shopping behaviour. For this a www.cyclelogistics.eu Page 20 of 26
D 7.1: Performance indicators and baseline assumptions

careful assumption was made on the basis of discussions with the Austrian NGOs. It was only
assumed that every 20th person would change the behaviour and in addition it was also taken into
account that about 56% of all shopping transport are currently done by car . This implies that out of
300.000 people reached 9.300 might actually change their behaviour. A further assumption
concerns word-of-mouth propaganda between family members and friends. Therefore, it is
assumed that every 40th person reached through NGO media will motivate persons in his or her
immediate surroundings to switch from the car to the bike. This too, is a very conservative
assumption and will be verified during the evaluation of the project.
The calculation of trips was done as follows: number of average trips per day 3,7 x share of
shopping transport 0,27xxxviii = an average number of shopping trips per day of 0,99. For people
induced through NGOs to shift from the car to the bike it was assumed that only 70% of the trips
will be substituted. This makes 0,69 trips/day. Where shopping transport is concerned Saturdays
were also included in the calculation and this resulted in 280 days/year as a basis for the
calculation. The average fuel consumption assumed for short urban shopping trips was 9l/100km
and the numbers for petrol were used for the calculations to convert fuel into CO2.
In total this leads to a prediction of 634tons of savings in the area of shopping transport.

Savings in the area of leisure time transport.
For leisure transport connected with goods transport the cautious assumption was made that every
30th NGO member, reached through cyclelogistics activities, will change his behaviour. Further, it
was taken into account that 48% of all leisure trips are currently done by car. This leads to an
estimated number of 4800 people who will change their behaviour. In addition it is assumed that
there will be a spill-over effect from persons that have changed their shopping behaviour into the
area of leisure transport. It was estimated that this spill-over effect will amount to 20%xxxix . This
means that an estimated number of 1560 people will change their behaviour.
The number of trips was calculated the following way: 3,7 trips per day x 0,33 (33% leisure time
trips) x 0,3 (every third trip is affected) = 0,407 affected leisure time trips per day. The average trip
length is 5 km.
In total this should lead to 204 tons of savings in the area of leisure time trips associated with the
transport of goods.
The following conversion factors were used for diesel and petrol, respectively:

                        1 litre diesel = 2,62 kg CO2; 1 litre petrol = 2,32 kg CO2

This leads to specific savings of 1200t/fuel and 3743 t/CO2 per year (see also table below).

www.cyclelogistics.eu                           Page 21 of 26
D 7.1: Performance indicators and baseline assumptions
Fuel savings and CO2 savings within the project duration
Extension of activities of CycleLogistics delivery partners and subcontractors area 1
Nr. Bikes Trips a day Average distance Days per year Liter fuel per km Density fuel Fuel saving tons CO2 tons
100 23 2,1 220 0,13 0,832 115 362
New cargo bike activities triggered by CycleLogistics activities in area 1
Nr. Bikes Trips a day Average distance Days per year Liter fuel per km Density fuel Fuel saving tons CO2 tons
150 20 2 220 0,13 0,832 150 472
Co-modal trips shiftert from Lorry to Bike and train - area1
Trips / year Distance /km Liter fuel per km Density fuel Fuel saving tons CO2 tons
1.000 250 0,13 0,832 27 85
Municipal services shift to cycling (maintainance, social services) area 2
Nr. Bikes Trips a day Average distance Days per year Liter fuel per km Density fuel Fuel saving tons CO2 tons
20 15 2 220 0,13 0,832 14 43
Bicycle for bussiness services; triggered by all consortium partners and subcontractors - area 2
Nr. Bikes Trips a day Average distance Days per year Liter fuel per km Density fuel Fuel saving tons CO2 tons
120 5 4 220 0,13 0,832 57 180
Private Logistics shopping test month - area 3
Average distance to
Persons Shop Trips a day 2,5 test month Liter fuel per km Density fuel Fuel saving tons CO2 tons
shop & home
3.000 0,999 3 65 0,09 0,748 39 122
Private Logistics shopping permanent shift of test users - area 3
Average distance to
Persons Shop Trips a day Year Liter fuel per km Density fuel Fuel saving tons CO2 tons
shop & home
1.000 0,999 3 215 0,09 0,748 43 135
Private Logistics shopping permanent shift by reaching the target group with info from area 4
Concerned Average distance to
Shop trips a day Year Liter fuel per km Density fuel Fuel saving tons CO2 tons
people shop & home
9.300 0,6993 3 280 0,09 0,748 368 1.141
Private Logistics shopping permanent shift by talking to other people
Concerned Average distance to
Shop trips a day Year Liter fuel per km Density fuel Fuel saving tons CO2 tons
people shop & home
4650 0,6993 3 280 0,09 0,748 184 570
Private Logistics leisure trips by spill over effects from peole who changed schopping travel behaviour
Concerned Average distance to
Shop trips a day Year Liter fuel per km Density fuel Fuel saving tons CO2 tons
people shop & home
1860 0,407 4 280 0,09 0,748 57 177
Private Logistics leisure trips permanent shift by reaching the target group with info from area 4
Concerned Average distance to
Shop trips a day Year Liter fuel per km Density fuel Fuel saving tons CO2 tons
people shop & home
4800 0,407 4 280 0,09 0,748 147 457
Sum of all savings 1.201 t/fuel 3.743 t/CO2
www.cyclelogistics.eu Page 22 of 26D 7.1: Performance indicators and baseline assumptions
References
i
TEMS – The EPOMM Modal Split Tool (322 European Cities), www.epomm.eu, Last investigation in
September 2013
ii
Schoemaker, J.; et.al.; BESTUFS II (Best Urban Freight Solutions); Quantification of Urban Freight
Transport Effects I; 2004
iii
MDS Transmodal Limited, DG MOVE: Study on Urban Freight Transport, Final Report; 2012
iv
Dietrich, W.; Güterverkehr in Städten – raumplanerische Lösungsbeiträge; Disp 124; 1996
v
Grießbach, A., Energie im Stadtverkehr: Einflussbeschreibung und Maßnahmenabschätzung, TU-
Dresden, 2009
vi
Eichhorn, C. and Waßmuth, V., Innenstadtlogistik mit Zukunft, Maßnahmen für einen funktionierenden
Wirtschaftsverkehr in der Stadt Stuttgart; 2012
vii
Wermuth, M. Hautzinger, H. and Lenz, B.; Kraftfahrzeugverkehr in Deutschland 2010. Schlussbericht.
Braunschweig; 2012
viii
Martin Ruesch, Nachhaltiger Güterversorgung und Transporte in Agglomerationen, Präsentation
Tagung: Städtischer Güterverkehr – Handlungsbedarf und Massnahmen, 9. Juni 2009
ix
Dietrich W., Güterverkehr in Städten – raumplanerische Lösungsbeiträge; Disp 124; 1996
x
Social Data; Travel behaviour of more than 150 cities and regions (focus on Germany)
www.socialdata.de
xi
MiD Mobilität in Deutschland 2008, Bundesministerium für Verkehr, Bau und Stadtentwicklung, Bonn
und Berlin; 2010
xii
Viinikainen, T.; Kalenoja, H.; National Travel Surveys in Finland, Paper in the XXVII International
Baltic Road Conference Riga, 2009
xiii
See TEMS; 2013
xiv
www.allinx.eu, Data on share of trips for different trip purposes and modal split of shopping trips in
Germany, last view Dec.2011
xv
Sammer, G.; et.al; Mobility behavior of the citizens of Graz; ZIS+P; 2008
xvi
The Gallup Organisation Hungary, Future of Transport, Flash EB Series #312, 2011
xvii
HHS Ingenier GmbH, Mobilitiätserhebung Aachen 2011
xviii
Ingenierbüro Helmert, Mobilitätsbefragung Stadt Bielefeld 2010
xix
Ohne Auto einkaufen. Nahversorgung und Nahmobilität in der Praxis, Werkstatt: Praxis Heft 76, Hrsg.:
Bundesministerium für Verkehr, Bau und Stadtentwicklung, Berlin 2011
xx
ARGUS Steiermark (NGO); Observational study: Shopping behaviour in Graz and the surrounding
areas;2009
xxi
See ARGUS Steiermark (NGO); 2009
xxii
See ARGUS Steiermark (NGO); 2009
xxiii
Reiter, K.; Pressl, R.; Study: Mobility & Marketing concept for the Energy Region; 2009
www.cyclelogistics.eu Page 23 of 26D 7.1: Performance indicators and baseline assumptions
xxiv
See source: Social Data; www.socialdata.de
xxv
See Sammer, G.; Mobility behavior of the citizens of Graz; ZIS+P; 2008
xxvi
Bundesamt für Raumentwicklung ARE, Faktenblatt Strategie Freizeitverkehr des Bundes, 2012
xxvii
See Schoemaker, J.; et.al.; 2004
xxviii
Figliozzi, Miguel Andres, Analysis of Freight Tours in a Congested Urban Area Using Disaggregated
Data : Characteristics and Data Collection Challenges, 2007
xxix
Delivering the Goods, 21st Century Challenges to Urban Goods Transport, OECD 2003
xxx
See telephone interview with Dr. Röschel; 2010
xxxi
Master Thesis: Bicycle Logistic – Potential for Bicycle Delivery Transport in Graz; Stephanie
Mühlbacher; 2010
xxxii
See Sammer, G.; et.al; 2008
xxxiii
Data sheet: Leisure transport – additional evaluation of the mircocensus regarding mobility behaviour;
Bundesamt für Raumentwicklung; Switzerland; 2009
xxxiv
Telephone interview with Dr. Röschel, Creator of Mobility Survey, Graz; FGM-AMOR; 2010
xxxv
Energiesparend Fahren, Brochure of the Home Office; Baden-Würtenberg
xxxvi
Websites: www.spritmonitor.de; www.aral.de;
xxxvii
See Sammer, G.; Mobility behavior of the citizens of Graz; ZIS+P; 2008
xxxviii
See Social Data; www.socialdata.de
xxxix
Mobility management in corridors; R. Aschermann, et.al. 2011
www.cyclelogistics.eu Page 24 of 26You can also read