Shoalwater Bay Defence Training Area Dugong Research Program Underwater Blast Measurements
←
→
Page content transcription
If your browser does not render page correctly, please read the page content below
Shoalwater Bay Defence Training Area
                Dugong Research Program
             Underwater Blast Measurements

                Phillip Box, Frank Marian and Darren Wiese

                       Maritime Platforms Division
               Aeronautical and Maritime Research Laboratory

                                 DSTO-TR-1024

                                  ABSTRACT

Defence training in Shoalwater Bay, Queensland includes the training of RAN
clearance divers in underwater explosives demolition. Shoalwater Bay is also a
significant dugong habitat and concerns have been raised about the impact of diver
training on resident dugong.
Shock parameters resulting from underwater detonations during a clearance diver
training exercise were measured. The methodology, results, analysis and
recommendations are presented.

                            RELEASE LIMITATION

                             Approved for public release
Published by

DSTO Aeronautical and Maritime Research Laboratory
PO Box 4331
Melbourne Victoria 3001 Australia

Telephone: (03) 9626 7000
Fax: (03) 9626 7999
© Commonwealth of Australia 2000
AR-011-556
August 2000

APPROVED FOR PUBLIC RELEASE
Shoalwater Bay Defence Training Area
             Dugong Research Program
          Underwater Blast Measurements

                           Executive Summary
Detonations underwater are an integral component of RAN Clearance Diver Training.
Regular training exercises are conducted in Shoalwater Bay, Queensland on Triangular
Island in the east of the Shoalwater Bay Defence Training Area. Shoalwater Bay is also
the home to the largest population of dugongs in the Great Barrier Reef Marine Park
south of Hinchinbrook Channel.
Concerns raised about the possible impact on the dugong population of defence
activities within Shoalwater Bay resulted in Defence managing four dugong research
projects. As part of one of these projects shock parameters were measured during a
RAN Clearance Diver training exercise.
The methodology, results and analysis are presented. Recommendations for clearance
diver explosive demolition training activities are discussed. Results indicate that the
safe distance for dugong would be less than 1 km from the detonation site.
Authors
Phillip Box
Maritime Platforms Division
Phillip has conducted evaluations of explosives and the effects of
explosives on platforms, structures and components, including the
measurement of shock and blast parameters from detonations in air
and underwater for over 19 years.
Phillip currently manages the Maritime Platforms Division high
explosives experimental infrastructure and instrumentation.
____________________ ________________________________________________
Frank Marian
Maritime Platforms Division
Frank commenced work at AMRL in 1969 and has been involved
in a diverse range of activities. Since 1987 he has worked in the
area of specialised instrumentation and has conducted field trials
and laboratory experiments to measure transient parameters
associated with air and underwater blast. In more recent times his
work area has focused on experiments related to structural
response of naval platforms to underwater detonations.
____________________ ________________________________________________
Darren Wiese
Maritime Platforms Division
Darren graduated from Western Metropolitan College of TAFE
with an Associate Diploma of Business (Computer Programming).
Since joining AMRL in 1982 he has been involved in explosives
research as an explosives firing officer and with instrumenting
explosives experiments. He has developed software packages for the
analysis of blast parameters for air and underwater detonations.
More recently Darren manages the transient data acquisition
capability within MPD.Contents
1. INTRODUCTION ............................................................................................................... 1
2. EXPERIMENTAL PROCEDURE ...................................................................................... 1
2.1 Location ...................................................................................................................... 1
2.2 Explosive Events ....................................................................................................... 3
2.3 Transducers................................................................................................................ 3
2.4 Transducer Calibration............................................................................................ 4
2.5 Transducer Cabling .................................................................................................. 5
2.6 Transducer Locations ............................................................................................... 5
2.7 Recording Instrumentation..................................................................................... 6
2.8 Recording Synchronisation..................................................................................... 6
2.9 Event Description ..................................................................................................... 6
2.9.1 Event 1......................................................................................................... 7
2.9.2 Event 2......................................................................................................... 7
2.9.3 Event 3......................................................................................................... 7
2.9.4 Event 4......................................................................................................... 7
2.9.5 Event 5......................................................................................................... 8
2.9.6 Event 6......................................................................................................... 8
2.9.7 Event 7......................................................................................................... 8
2.9.8 Event 8......................................................................................................... 8
2.9.9 Event 9......................................................................................................... 8
2.9.10 Event 10....................................................................................................... 8
2.9.11 Event 11....................................................................................................... 9
2.9.12 Event 12....................................................................................................... 9
2.9.13 Event 13....................................................................................................... 9
2.9.14 Event 14....................................................................................................... 9
3. RESULTS ........................................................................................................................ 9
3.1 Analysis of Pressure Records ................................................................................. 9
3.2 Time of Arrival........................................................................................................ 10
3.3 Peak Pressure........................................................................................................... 11
3.4 Impulse ..................................................................................................................... 11
3.5 Event Results ........................................................................................................... 14
3.5.1 Event 1....................................................................................................... 14
3.5.2 Event 2....................................................................................................... 14
3.5.3 Event 3....................................................................................................... 14
3.5.4 Event 4....................................................................................................... 14
3.5.5 Event 5....................................................................................................... 14
3.5.6 Event 6....................................................................................................... 15
3.5.7 Event 7....................................................................................................... 15
3.5.8 Event 8....................................................................................................... 15
3.5.9 Event 9....................................................................................................... 15
3.5.10 Event 10..................................................................................................... 16
3.5.11 Event 11..................................................................................................... 16
3.5.12 Event 12..................................................................................................... 16
3.5.13 Event 13..................................................................................................... 16
3.5.14 Event 14..................................................................................................... 164. DISCUSSION..................................................................................................................... 17 5. RECOMMENDATIONS .................................................................................................. 20 6. ACKNOWLEDGMENTS ................................................................................................. 21 7. REFERENCES..................................................................................................................... 21 APPENDIX A: PRESSURE-TIME HISTORIES ............................................................. 23 APPENDIX B: PEAK PRESSURE V DISTANCE GRAPHS ....................................... 41 APPENDIX C: IMPULSE V DISTANCE GRAPHS ...................................................... 49
DSTO-TR-1024

                                  1. Introduction
Triangular Island, within the Shoalwater Bay Defence Training Area (SWBTA) in
Queensland, is used by the RAN to train clearance divers in underwater demolition and
mine disposal techniques. The two intertidal bay sites used at Triangular Island are
considered a key asset to Defence because they permit convenient and safe, yet highly
realistic and rigorous training conditions. Clearance Diver training exercises generally take
place over a two-week period, two to three times a year.

Shoalwater Bay is also home to the largest dugong population in the Great Barrier Reef
Marine Park south of the Hinchinbrook Channel. In 1997, to address the apparent major
decline in dugong numbers in the southern half of the GBR, sixteen dugong sanctuaries
were declared along the Queensland coast. The Shoalwater Bay Dugong Sanctuary was
declared as a category ‘A’ sanctuary and is considered crucial to the stabilisation and
recovery of local dugong numbers.

Concerns have been raised about the possible impact of Clearance Diver Training on the
local dugong population. Therefore, as part of the executive level arrangement between
Defence, the Great Barrier Reef Marine Park Authority and the Queensland Department of
Environment & Heritage, Defence agreed to manage four dugong research projects
relating to its activities within Shoalwater Bay, and particularly to clearance diver training
and the detonation of underwater ordnance at Triangular Island. The four projects
comprised dugong tracking by satellite telemetry, aerial monitoring of dugong movements
during training exercises, an anatomical study to determine dugong auditory sensitivity,
and measurement of underwater shock parameters during a diver training exercise. For
the latter project, personnel from Aeronautical and Maritime Research Laboratory
(Maritime Platforms Division) conducted underwater blast measurements during a
clearance diver training exercise in November 1999.

This report discusses the technology, methods and results of these measurements.

                         2. Experimental Procedure
2.1 Location

Shoalwater Bay is located on the central Queensland coast, approximately 550 km north of
Brisbane and 115 km north of the Tropic of Capricorn. The semi-enclosed, triangular-
shaped bay is bounded in the east by a narrow and hilly peninsula and, off its northern
extremity, Townshend Island which is separated from the peninsula by Strong Tide
Passage. Triangular Island consists of two low wooded islets located on the south and
inner side of Strong Tide Passage.

Diver training at Triangular Island involves the finding of explosive ordnance, relocation
to a suitable disposal position and then the disposal of the ordnance by detonation.
Although the whole island could be used to locate the ordnance, the detonation of it was
primarily conducted in four locations: Big Bang Beach, Little Bang Beach, Barricade
Passage and Liclic Beach. Barricade Passage is at the western end of Little Bang Beach and
Liclic Beach is on the western end of the island. (Figure 1)

                                                                                                 1
DSTO-TR-1024
P4
P4'
Boat Channel
P3
Ev4
Ev9
P2
Ev Ev
Ev 12 10 ac
h
P1 8 Be
a ng
Ev14 e B
tl
Ev 6 Li t
& 13 Triangular
Barricade Island
Passage
Li c h
lic B eac
Be B ang
a ch Big
Ev 1
&3 Ev2 Ev11
Ev5
Boat Secondary
Channel Ev7 Boat Channel
P1
P3'
P2
P3
Approx.
North
P4'
P4
500 m
P5'
P5
Figure 1 Location of Transducers and Detonation Sites
2DSTO-TR-1024
2.2 Explosive Events
This experiment was conducted on an opportunity basis during Clearance Diver training
exercises on Triangular Island. As such a number of detonations were conducted for which
it was not possible to record blast parameters. Recording of blast parameters was
attempted for a total of 14 detonations. Some of these were specifically located to achieve
the worst case blast scenario to maximise the blast pressure records and were initiated
with DSTO equipment to ensure synchronisation with the recording instrumentation. The
remaining detonations were initiated either non-electrically or electrically with RAN
shrike firing units as part of the diver training. Non-electric firings use safety fuse that
burns along its length until it initiates a detonator that consequently initiates detonating
cord and the main explosive charge. The burn times for the safety fuse are only
approximate. Synchronisation with the recording instrumentation for these events proved
difficult. Two methods were attempted as described below.
2.3 Transducers
The transducers used to record the underwater blast pressure-time profiles were PCB
Integrated Circuit Piezoelectric transducers, model No. 138A01, with a dynamic range of 7
MPa. These transducers utilise a tourmaline crystal housed in a tygon tube filled with
silicone oil. The silicone oil, in which the crystal is situated, is of similar shock impedance
to the surrounding water. These transducers have been used extensively to characterise
and quantify the shock environment during research into shock loading of RAN platforms,
structures and components.
These transducers were designed to be suspended vertically and weighted to maintain
their position, usually with a fishing sinker. DSTO use a sinker with a mass of 340 grams.
This deployment method uses the water surface as a datum and transducers are usually
deployed to a set depth. Due to the large tidal movements in Shoalwater Bay the
transducers could not be deployed in the normal manner. During this experiment the
transducers were deployed from the seabed and ”floated” to maintain a consistent height
above the seabed. A polystyrene float of 100 mm diameter produces approximately 300
grams of flotation and hence similar tension on the transducer as in other applications.
This deployment method was a compromise between the worst case for a mammal (a
dugong) feeding on sea grass, ie on the seabed, and having sufficient free water around
the transducer to produce a clean pressure-time history that could be interpreted.
Transducers were deployed at a height of 1 meter above the seabed.
A transducer deployed on the mud flats of Little Bang Beach is shown in Figure 2.
3DSTO-TR-1024
Transducer
Coaxial
Cable
Float
Diver’s
Weight
Figure 2 Transducer deployed on mud flat at low tide.
2.4 Transducer Calibration
Prior to shipment for the experiment each of the underwater pressure transducers was
broken down, baked in a vacuum oven as per the transducers instruction manual (this
removes any moisture from the crystal) and then calibrated against a transfer standard.
The transfer standard is calibrated traceable to NIST in compliance with ISO 10012-1. This
process involves subjecting the transducer to a series of pseudo dynamic pressure pulses
in a purpose built calibration device that consists, in its simplest form, of a cylinder with
ports for the insertion of the transducer and transfer standard and a piston onto which a
weight is dropped. The resultant half sine-wave pulses from both the transfer standard
and the transducer are analysed and the amplitudes used to determine the transfer
characteristic of the transducer. The transducers are subjected to at least three pulses at
each of five different amplitudes covering the nominal range of the transducer. A linear
regression is then used to calculate the sensitivity of the transducer.
4DSTO-TR-1024
2.5 Transducer Cabling
Coaxial cabling, RG59, was deployed from the transducers to the recording
instrumentation located in the bunker on the island. Cables, 500 metres in length, were
pre-fitted with BNC connectors at both ends. The longest transducer-instrumentation
length was 1.5 km in three 500 m sections. The cabling was simply deployed from a cable
reel over the transom of a dinghy where possible. Deployment of cabling on Little Bang
Beach involved walking the cable out over the mud flats. The connections between the
cable lengths were waterproofed by wrapping the BNC to BNC join in amalgamating tape
and then covering this with a cold shrink rubber insulation with a silicone compound
injected into the void space around the cable inside the cold shrink.
The connection of the cable to the transducer required a BNC to 10/32 Microdot adaptor,
model no. 070A03. Initially the end of the transducer, the adaptor and the BNC connector
were waterproofed using amalgamating tape. However, several connectors were found to
be affected by water ingression. After the affected cable was disposed of and a new
connector fitted, amalgamating tape was re-applied and then covered with a section of
cold shrink rubber insulation to water proof the connection.
The cabling was left on the seabed, through the water, and on the island suspended above
head height to limit damage from other activities.
2.6 Transducer Locations
Transducers were deployed in approximately a southwest direction from Big Bang Beach,
which heads towards the East Ridge Bank; a known dugong feeding ground, and a
northwesterly direction from Little Bang Beach, towards Strong Tide passage; a probable
dugong migratory path. Deployment of transducers in these directions attempted to
ensure measurements from detonations in the four main detonation areas and at the same
time allowed cables to be deployed in areas where damage from the training activities
would be unlikely.
The locations of the transducers were measured using a theodolite positioned on the shore
at the western ends of both Big Bang Beach and Little Bang Beach. In this way the relative
location of the transducers and detonation sites could be plotted, as is shown in Figure 1.
The transducers were numbered P1 to P5 on Big Bang Beach side of the island and P1 to P4
on the Little Bang Beach side. The transducers P3 to P5 on the Big Bang side required
reconnection of the cable connector after water ingression and were consequently moved.
Their positions are indicated as P3’, P4’ and P5’. The same is relevant for P4’ on Little Bang
Beach side of the island.
The intention was to conduct most of the detonations at high tide but due to numerous
reasons some detonations were delayed. The water level on some events was mid tide and
consequently no pressure time records were obtained for those events.
5DSTO-TR-1024
2.7 Recording Instrumentation
Pressure signals were recorded on Digistar III digital data recorders. The Digistar
recorders provided transducer excitation, amplification, analog-to-digital conversion and
digital storage of the data for one transducer. Ten recorders were deployed on the island
with each transducer connected directly via the coaxial cable. The data were recorded
using a digital sample rate of 1 Million, 16 bit samples per second providing 4 seconds of
recording time for each channel.
The Digistars are computer controlled and subsequent to recording the pressure signal, the
data were transferred to the computer, converted to ASCII format and analysed using the
Origin software package.
2.8 Recording Synchronisation
The recording of pressure signals from detonations requires the synchronisation of the
detonation with the instrumentation. DSTO normally perform this synchronisation by
using explosive firing systems designed to interface with instrumentation and electronic
units with which fixed time delays can be programmed. These units are known as Delay
Pulse Generators (DPG). For some events it was possible to utilise DSTO’s firing system
but was not possible, for most events, without compromising the diver training. Many
events were initiated using safety fuse. Safety fuse is a slow burning chemical fuse, which
allows personnel, in close proximity to the explosives, to start the burning and then
relocate to a safe distance before the detonation.
Initially the recording of pressure-time signals was attempted by using the pressure signal
to initiate the recording in the Digistar recorders. This is known as “internal triggering”.
Unfortunately the pressure signal levels were lower than expected and the trigger levels
could not be set to successfully record signals in this way.
For later detonations personnel manually triggered the recorders when the detonations
were heard. The recorders were configured to stop recording immediately the trigger
signal was received. This enabled the recording of the pressure signals but had the
disadvantage of not having any precise time relationship with the detonation.
2.9 Event Description
The following describes each of the detonations where blast measurements were
attempted. The equivalent mass of TNT is quoted for each detonation using the
equivalence ratios used by RAN and shown in Table 1.
6DSTO-TR-1024
Table 1 Explosive Composition to TNT Equivalence Ratios.
Explosive TNT Equivalence
Ratio
Composition B 1.5
PETN 1.45
(detonating cord)
Plastic Explosive 1.2
HBX-3 1.1
H-6 1.24
ANFO 0.56
Hose Charges 1.5
2.9.1 Event 1
The explosives detonated consisted of ten 5”/54 shells, each containing 3.4 kg of
Composition B explosive, laid out parallel to each other and connected by short lengths of
detonating cord. The total explosive quantity was 34.2 kg, the equivalent of 51.3 kg TNT.
The shells were located on the rim of the ‘staff swimming hole’ on Liclic Beach. The
explosives were initiated using safety fuse.
2.9.2 Event 2
The explosives detonated consisted of one Mk 44 Torpedo Warhead, containing 31.8 kg of
HBX-3 explosive, 4 sticks of plastic explosives (920 g), and 80 m of detonating cord (800 g).
The total explosive quantity was 33.5 kg, the equivalent of 37.2 kg TNT. The warhead was
positioned on the western side of the boat channel on Big Bang Beach and was initiated
electrically using DSTO explosive firing equipment.
2.9.3 Event 3
The explosives detonated consisted of one Mk 44 Torpedo Warhead, containing 31.8 kg of
HBX-3 explosive, five 5”/54 shells, each containing 3.4 kg of Composition B explosive, 9
sticks of plastic explosives (2070 g), and 40 m of detonating cord (400 g). The total
explosive quantity was 51.3 kg, the equivalent of 63.5 kg TNT. The explosives were
positioned in the ‘staff swimming hole’ on Liclic Beach and were initiated using safety
fuse.
2.9.4 Event 4
The explosives detonated consisted of one Mk 44 Torpedo Warhead, containing 31.8 kg of
HBX-3 explosive, five 5”/54 shells, each containing 3.4 kg of Composition B explosive, 9
sticks of plastic explosives (2070 g), and 40 m of detonating cord (400 g). The total
explosive quantity was 51.3 kg, the equivalent of 63.5 kg TNT. The explosives were
positioned on the western edge of the boat channel on Little Bang Beach and were initiated
using safety fuse.
7DSTO-TR-1024
2.9.5 Event 5
The explosives detonated consisted of three Mk 44 Torpedo Warheads, each containing
31.8 kg of HBX-3 explosive, eight 5”/54 shells, each containing 3.4 kg of Composition B
explosive, and 14 sticks of plastic explosives (3220 g). The total explosive quantity was
125.8 kg, the equivalent of 149.6 kg TNT. The explosives were positioned on the western
edge of the boat channel on Big Bang Beach and were initiated using safety fuse.
2.9.6 Event 6
The explosives detonated consisted of five 5”/54 shells, each containing 3.4 kg of
Composition B explosive, 80 sticks of plastic explosives (18.4 kg), two Mk AN 8-3 flexible
hose charges, each containing 23.1 kg of explosive, and 60 m of detonating cord (600 g).
The total explosive quantity was 82.2 kg, the equivalent of 116.9 kg TNT. The explosives
were positioned in Barricade Passage at the western end of Little Bang Beach and were to
be initiated using safety fuse. This charge did not fire when planned and was later fitted
for electrical firing and was initiated electrically using DSTO explosive firing equipment.
2.9.7 Event 7
The explosives detonated consisted of one Mk 82 Bomb, containing 89 kg of H-6 explosive,
4 sticks of plastic explosives (920 g), and 180 m of detonating cord (1800 g). The total
explosive quantity was 91.7 kg, the equivalent of 114.1 kg TNT. The bomb was positioned
on the western side of the boat channel on Big Bang Beach and was initiated electrically
using DSTO explosive firing equipment.
2.9.8 Event 8
The explosives detonated consisted of two Mk 44 Torpedo Warheads, containing 31.8 kg of
HBX-3 explosive, 4 sticks of plastic explosives (920 g), and 80 m of detonating cord (800 g).
The total explosive quantity was 65.3 kg, the equivalent of 72.2 kg TNT. The warheads
were positioned on the western side of the boat channel on Big Bang Beach and were
initiated electrically using DSTO explosive firing equipment.
2.9.9 Event 9
The explosives detonated consisted of six 5”/54 shells, each containing 3.4 kg of
Composition B explosive, and 126 sticks of plastic explosives (29 kg). The total explosive
quantity was 49.4 kg, the equivalent of 65.4 kg TNT. The explosives were positioned in the
boat channel on Little Bang Beach and were initiated using safety fuse.
2.9.10 Event 10
The explosives detonated consisted of 80 kg of ANFO, and 80 sticks of plastic explosives
(18.4 kg) and 30m of detonating cord (300 g). The total explosive quantity was 98.7 kg, the
equivalent of 66.3 kg TNT. The explosives were positioned in the boat channel on Little
Bang Beach and were initiated electrically using DSTO explosive firing equipment.
8DSTO-TR-1024
2.9.11 Event 11
The explosives detonated consisted of one Mk 82 Bomb, containing 89 kg of H-6 explosive,
one Mk 44 Torpedo Warhead, containing 31.8 kg of HBX-3 explosive, eight 5”/54 shells,
each containing 3.4 kg of Composition B explosive. The total explosive quantity was 148
kg, the equivalent of 186.1 kg. The explosives were positioned in the secondary boat
channel on Big Bang Beach and were initiated using safety fuse.
2.9.12 Event 12
The explosives detonated consisted of one Mk 44 Torpedo Warhead, containing 31.8 kg of
HBX-3 explosive, eight 5”/54 shells, each containing 3.4 kg of Composition B explosive.
The total explosive quantity was 59 kg, the equivalent of 75.8 kg. The explosives were
positioned in the ‘boat harbour’ on Little Bang Beach and were initiated using safety fuse.
2.9.13 Event 13
The explosives detonated consisted of six Mk 44 Torpedo Warheads, containing 31.8 kg of
HBX-3 explosive, eight 5”/54 shells, each containing 3.4 kg of Composition B explosive, 32
sticks of plastic explosive (18.4 kg), and 60 m of detonating cord (600 g). The total
explosive quantity was 237 kg, the equivalent of 173.6 kg TNT. The explosives were
positioned in Barricade Passage at the western end of Little Bang Beach and were initiated
using safety fuse.
2.9.14 Event 14
The explosives detonated consisted of one Mk 82 Bomb, containing 89 kg of H-6 explosive,
4 sticks of plastic explosives (920 g), and 80 m of detonating cord (800 g). The total
explosive quantity was 90.7 kg, the equivalent of 112.6 kg TNT. The bomb was positioned
on the western side of the boat channel on Little Bang Beach and was initiated electrically
using DSTO explosive firing equipment
3. Results
3.1 Analysis of Pressure Records
The methods used to interpret underwater blast records when assessing the loading of
structures in free water revolve around the impulse of the pressure pulse and then
calculating the energy flux density of this signal. Other parameters analysed from
underwater pressure records include the peak pressure, the arrival time, the time constant
of the decaying pressure-time signal and the bubble period. These parameters are
relatively easily derived from pressure-time records recorded from detonations in free
water with the explosive charge and transducers at depth. In most cases experiments are
designed to acquire as close as possible to classical free water blast pressure records.
9DSTO-TR-1024
This experiment was conducted in shallow water both for the detonating explosives and
the transducers. In most cases the detonating explosives were positioned in deep holes, as
is normally the case in the diver training exercises. This positioning focuses the blast
towards the surface therefore promulgating less blast into the surrounding water than
would otherwise be the case.
The complex structure of inconsistent seabed and inconsistent depth along with shallow
overall water depths has generated complex pressure-time histories. The one obvious
complexity of the pressure-time histories, compared to those of deep-water detonations, is
the disturbance of the shock wave by the reflections from the seabed and the rarefractions
from the sea surface. This has resulted in numerous short duration peaks and troughs in
the pressure data, as opposed to a single classical shock wave as depicted in Figure 3.
P re ssu re
T im e
Figure 3 A Classical Pressure-time history
The pressure-time histories for all results obtained are contained in Appendix A.
3.2 Time of Arrival
For the events that were initiated using DSTO equipment the time of arrival could be
measured. The time-of-arrival is the time between the explosives detonating and the time
of the shock front arriving at the transducer. The recording instrumentation was triggered
simultaneously with the electrical energy being discharged through the electric detonator.
This is known as Time Zero (TZ). Hence the time axis on the pressure-time histories is
referenced to TZ. These detonations used a length of detonating cord between the
detonator and the main explosive charge. To calculate a predicted time-of-arrival the
length of detonating cord has been accounted for. The Velocity-of-Detonation of the
detonating cord is very consistent and for the detonating cord used during these exercises
the Velocity-of-Detonation was 7900 m/s. Hence for an eighty metre length of detonating
cord, the time from the detonator to the main charge was 80 divided by 7900 which equals
10.1 ms.
The time for a shock wave to travel through water can be calculated using the following
formula [1]:
Vs = 1449.1 + 4.572 (T) –0.04453 (T2) + 1.398 (S-35) + 0.017d
10DSTO-TR-1024
Where: T is the water temperature in Celsius;
S is the salinity of the water in parts per thousand;
and d is the depth of water at the point of interest.
The water temperature was measured as 21° C (with very little variation day to day) and
salinity 35.2 ppt. Using an average depth of 3 m the calculated shock velocity is
1525.8 m/s. The explosive to transducer distance and the calculated arrival times are
shown in the tables below.
3.3 Peak Pressure
The peak pressures were calculated for each pressure-time history by taking the baseline
before any significant excursion as zero pressure and then simply calculating the highest
positive peak. This is the blast pressure above the hydrostatic pressures as a result of the
detonation.
In the classical pressure pulse Figure 3 the largest pressure value is the first data peak but
in this experiment secondary peaks in some cases were the greatest value. The peak
pressure quoted is the greatest value in the data. Time-of-arrival and peak pressure results
are shown in Table 2.
The blast pressure predictions have been calculated using the similitude equations and
coefficients for TNT quoted in Swisdak [1]
3.4 Impulse
The analysis of underwater blast records includes the calculation of the impulse or area
under the curve of the pressure pulse. For the classical pressure pulse, as depicted in
Figure 3, this calculation is straightforward. The pressure-time histories recorded during
this experiment, as stated above, are not classical in shape. The impulse analysis
conducted involved the calculation of the area under the curve for both the positive and
negative regions of the pressure-time histories for up to five oscillations after the initial
peak. This appears to include all significant pressure excursions from the baseline. As the
worst case scenario the positive and negative impulses were added to calculate the
maximum impulse possible from these results. The impulse values and the accumulated
impulses for the positive and negative portions as well as the accumulated absolute values
have then been compared with predicted values for impulse from deep-water detonations.
The results are shown in Table 3. The blast pressure predictions have been calculated
using the similitude equations and coefficients for TNT quoted in Swisdak [1]
11DSTO-TR-1024
Table 2 Time-of-Arrival and Peak Pressure (kPa) Results
Event Explosive Transducer Explosive Predicted Measured Predicted Peak
# Mass # Time-of- Time-of- Peak Pressure
Transducer
(TNT Arrival Arrival Pressure Measured
Distance
equivalent) (deep water)
(kg) (ms) (ms) (kPa) (kPa)
(m)
1 51.3 1 308.1 201.9 N/A 360DSTO-TR-1024
Table 3 Impulse Results
Absolute Impulse
Accumulated +ve
Accumulated -ve
Transducer #
Accumulated
Charge mass
Transducer
Predicted
Charge -
Impulse
Impulse
Event #
+ve
+ve
+ve
+ve
+ve
-ve
-ve
-ve
-ve
-ve
(kg) (m) (Pa.s) (Pa.s) (Pa.s) (Pa.s) (Pa.s) (Pa.s) (Pa.s) (Pa.s) (Pa.s) (Pa.s) (Pa.s) (Pa.s) (Pa.s) (Pa.s)
2 37.3 P1 151.3 11 33.36 46.01 48.17 74.7 53.51 47.1 97.76 293.4 232.8 526.2 650
P3 357.4 0.23 1.37 1.33 0.96 1 0.44 2.56 2.77 5.33 300
6 93.8 P1 121.7 0.01 0.04 0.14 0.12 0.02 0.29 0.13 0.52 1.08 0.19 2.27 1400
P2 99.2 2.32 4.45 4.88 3.33 2.71 1.85 1.15 11.06 9.63 20.69 1680
P3 201.9 0.04 0.03 0.03 0 0.04 0.02 0.04 0.05 0.15 0.1 0.25 890
7 112.3 P1 96.2 145.4 494.7 692.2 837.6 494.7 1332 1930
P2 209.8 74.18 124.1 15.38 56.8 61.7 95.45 85.43 236.7 276.3 513 970
P5 1282 0.07 0.74 1.24 0.31 1.32 1.7 3.03 3.55 5.66 6.3 11.96 190
8 72.3 P1 49.3 16.67 32.13 26.21 21.15 42.88 53.28 96.16 2660
P2 127.4 3.87 5.26 6.72 8.71 8.94 11.25 7.34 26.87 25.22 52.09 1140
P3 315.8 0.61 1.44 2.33 2.34 1.49 1.36 1.51 1.81 5.94 6.95 12.89 510
P4 685 0.04 0.07 0.07 0.06 0.05 0.07 0.11 0.11 0.27 0.31 0.58 260
9 65.4 P1 93.7 2.1 3.25 4.84 5.7 6.57 5.55 5.88 4.99 19.39 19.49 38.88 1410
P2 117.6 0.066 1 1.53 1.34 1.13 1.22 2.01 2.57 2.1 2.7 6.84 8.83 15.67 1150
P3 290.2 0.41 0.38 0.36 0.76 0.66 1.43 1.14 2.57 510
P4 654.1 0.02 0.05 0.03 0.05 0.05 0.1 250
10 66.9 P1 104.3 1.48 3.73 5.07 5.26 4.52 4.11 11.07 13.1 24.17 1300
P2 180.5 0.29 0.69 1.56 2.27 2.94 3.15 2.9 2.56 7.69 8.67 16.36 800
P3 367 0.06 0.19 0.36 0.68 0.75 0.86 0.83 0.85 1.02 1.27 3.02 3.85 6.87 420
P4’ 740.8 0.03 0.04 0.05 0.04 0.08 0.08 0.16 230
11 185.8 P1 246 0.2 0.25 0.26 0.06 0.12 0.32 0.32 0.18 0.9 0.81 1.71 1150
P2 360 0.03 0.08 0.05 0.01 0.15 0.23 0.09 0.31 820
12 75.8 P1 84.6 1.39 1.99 2.54 2.86 2.28 2.47 2.55 2.1 8.76 9.42 18.18 1690
P2 155.3 0.05 0.18 0.17 0.23 0.25 0.43 0.42 0.36 0.44 1.33 1.2 2.53 990
P3 340 0.07 0.05 0.11 0.17 0.19 0.24 0.18 0.19 0.16 0.71 0.65 1.36 490
13 260.5 P1 108 5.65 10.99 8.35 7.69 4.68 3.92 18.68 22.6 41.28 2960
P2 78.5 0.36 0.47 0.36 0.48 0.81 0.69 1.53 1.64 3.17 3940
P3 197.9 0.04 0.01 0.04 0.01 0.05 1730
14 112.3 P1 63.7 24.95 3.22 73.78 60.22 20.1 8.99 46.5 165.3 72.43 237.73 2790
P2 141.7 3.17 10.37 9.12 6.3 9.69 7.33 10.2 6.28 6.05 38.18 30.28 68.46 1370
P3 330.3 0.58 1.86 2.91 3.37 3.6 2.81 2.8 2.57 9.89 10.61 20.5 640
13DSTO-TR-1024
3.5 Event Results
The following paragraphs discuss the results from each event individually.
3.5.1 Event 1
Triggering of the recording instrumentation was attempted using the pressure signals
from each of the transducers. The instrumentation was configured on the basis of
predictions for underwater blast in free water for the total explosive quantity detonating
simultaneously. Subsequent to the detonation the explosives configuration was
determined to be individual shells connected via approximately 0.5 m of detonating cord.
This would result in approximately 70 microseconds between the detonation of each shell.
Consequently the blast would be less than that for the total quantity of explosives
detonating simultaneously. As a consequence the recorders did not trigger. The only result
that can be concluded from this event is that the pressure levels did not exceed those
quoted in Table 2.
3.5.2 Event 2
The explosives were electrically initiated and the instrumentation triggered using DSTO
equipment. Pressure time records were obtained for P1, P3 and P5. Transducer P5
functioned correctly but the signal level obtained was too low to discern impulse but the
peak is approximately 1 kPa. The pressure pulses correlated well with the predicted
arrival times but the signal amplitudes were significantly smaller than those predicted for
open water detonations.
3.5.3 Event 3
The detonation was delayed for over three hours after the high tide and consequently the
surrounding water level was lower than that in the “pool” in which the explosives were
deployed. This meant that there was no continuous water medium through which the
shock wave could propagate hence no pressure records were obtained.
3.5.4 Event 4
This detonation was conducted at the same time as Event 3. The first three pressure
transducers on Little Bang Beach were laying on the mud flats exposed to the air at the
time of detonation. There was little water cover over the explosives and therefore the
shock wave did not propagate along the narrow channel, that still contained water at this
stage of the tide, with sufficient magnitude to record any signal at the fourth transducer in
Strong Tide Passage.
3.5.5 Event 5
Triggering of the recording instrumentation was attempted using the pressure signals
from each of the transducers. The signal levels used were reduced to the point at which
some of the recorders were triggering on the electrical noise on the transducer inputs. At
the time of detonation the recorder for P5 had already triggered. The others did not trigger
14DSTO-TR-1024
so consequently the only results that can be determined from this event are similar to
event one, that the pressure signal amplitudes were below the trigger levels set as shown
in Table 2.
3.5.6 Event 6
The explosives were initiated using DSTO electrical equipment allowing synchronisation
with the data recorders. Records were obtained from all 4 transducers. Although
transducer P4 functioned correctly the signal level obtained was too low to discern any
meaningful data. Due to the explosives being deployed in Barricade Passage the closest
transducer was P2. The results correlate well for arrival times but the peak pressures are
well below those predicted for similar detonations in open water.
3.5.7 Event 7
The bomb was deployed on the edge of the boat channel on Big Bang Beach so as the
resultant blast could propagate directly from the bomb to the transducers to maximise the
blast pressure results. The explosives were electrically initiated and the instrumentation
triggered using DSTO equipment. Pressure time records were obtained for P1, P2 and P5
allowing measurements over a range of distance to beyond 1200 m. The pressure pulses
correlated well with the predicted arrival times but the signal amplitudes were smaller
than those predicted for open water detonations. The amplitudes were closer to
predictions than some of the other detonations at the closest transducer but the attenuation
due to the shallow water reduced the amplitude significantly for the distant transducers.
3.5.8 Event 8
The two warheads detonated for this event were deployed on the edge of the boat channel
on Little Bange Beach again so as the resultant blast could propagate directly from the
bomb to the transducers to maximise the blast pressure results. The explosives were
electrically initiated and the instrumentation triggered using DSTO equipment. Pressure
time records were obtained for all four transducers. The pressure pulses correlated well
with the predicted arrival times but the signal amplitudes were smaller than those
predicted for open water detonations. The amplitudes were closer to predictions than
some of the other detonations at the closest transducer but the attenuation due to the
shallow water reduced the amplitude significantly for the distant transducers.
3.5.9 Event 9
The data recorders for this event were triggered manually on hearing the detonation. This
was successful but due to using this method arrival times can not be determined. The
resulting pressure-time histories have negative time on the time axis because the recorders
were configured to stop recording at the trigger signal. Pressure time records were
obtained for all four transducers. The pressure signal amplitudes were much smaller than
those predicted for open water detonations.
15DSTO-TR-1024
3.5.10 Event 10
The explosives were electrically initiated and the instrumentation triggered using DSTO
equipment. Pressure-time histories were obtained for all four transducers. The pressure
pulses correlated well with the predicted arrival times but the signal amplitudes were
much smaller than those predicted for open water detonations. The explosives for this
event were positioned in a hole on Little Bang Beach and were covered with numerous
sandbags. This positioning and covering has focussed the blast upwards, due to being in a
hole, and attenuated the blast due to the sandbags.
3.5.11 Event 11
The data recorders for this event were triggered manually on hearing the detonation. This
was successful, except for P5, but due to using this method arrival times can not be
determined. The resulting pressure-time histories have negative time on the time axis
because the recorders were configured to stop recording at the trigger signal. Pressure
time records were obtained for three transducers. Transducer P3 failed to function and the
recorders were manually triggered prior to the shock wave reaching the furthest
transducer P5. The explosives for this event were positioned in the “Secondary Boat
Channel” on Big Bang Beach. This area is a deep narrow channel and the blast from
detonations in this location would be directed upward and to a lesser extent outward
along the channel, which is approximately a southerly direction. The pressure-time
histories are consequently very much smaller than predictions for detonations in open
water.
3.5.12 Event 12
The data recorders for this event were triggered manually on hearing the detonation. This
was successful but due to using this method arrival times can not be determined. The
resulting pressure-time histories have negative time on the time axis because the recorders
were configured to stop recording at the trigger signal. Pressure time records were
obtained for three transducers. The amplitude of the signals is again significantly smaller
than predictions for deep-water detonations.
3.5.13 Event 13
The data recorders for this event were triggered manually on hearing the detonation. This
was successful but due to using this method arrival times can not be determined. The
resulting pressure-time histories have negative time on the time axis because the recorders
were configured to stop recording at the trigger signal. Pressure time records were
obtained for three transducers. Due to the explosives being deployed in Barricade Passage
the closest transducer was P2. The amplitude of the signals is an order of magnitude
smaller than predictions for deep-water detonations.
3.5.14 Event 14
The bomb detonated for this event was deployed in the boat channel on Little Bang Beach.
The bomb was electrically initiated and the instrumentation triggered using DSTO
16DSTO-TR-1024
equipment. Pressure time records were obtained for three transducers. Transducer P4
operated correctly but there was no discernible pressure signal above the electrical signal
noise. The pressure pulses correlated well with the predicted arrival times but the signal
amplitudes were smaller than those predicted for open water detonations. The amplitudes
were closer to predictions than some of the other detonations at the closest transducer but
the attenuation due to the shallow water reduced the amplitude significantly for the
distant transducers.
4. Discussion
This experiment was conducted on an opportunity basis and therefore not planned to best
suit the needs of analysis of underwater blast parameters. Each event had different
explosive composition, explosives mass, explosive casing, distances to the pressure
transducers, water depths, seabed structure around the explosives, and containment of the
explosives. Most of the detonations contained numerous explosive items that were
connected by lengths of detonating cord and as a consequence the entire explosive mass
was not detonated simultaneously for these events.
As a consequence of the variability of the detonations and the numerous parameters
associated with them it is not possible to reduce the data obtained to determine scaling
factors, specifically for this area, with which blast parameters could be predicted
accurately for future detonations.
It is possible however to compare the results obtained with well-established predictions
for deep-water detonations for each event recorded individually. These comparisons do
indicate effects of changing some of the parameters of the detonations.
The plots of the Peak Pressure v Distance, from the explosive charges, are shown in
Appendix B and the plots of Impulse v Distance are shown in Appendix C:
It is evident from the plots of Peak Pressure that the shock wave cannot propagate through
shallow water as it does in deep water and as a consequence peak levels are reduced. It is
worth noting that some events (events 2, 7, 14 and to some extent 8) the peak pressure
from the closest transducer, although still smaller than predicted, is of significant
amplitude. For these events the explosives were deployed on the mud flats or on ridges at
the edge of the boat channels and the blast shock wave could propagate horizontally
through the water. In contrast, for most of the events the explosives were deployed in
channels or holes and hence the shock wave had to traverse a mound or ridge before
propagating through the water. Explosives deployed in Barricade Passage or the
Secondary Boat Channel on Big Bang Beach were further contained by the geometry of the
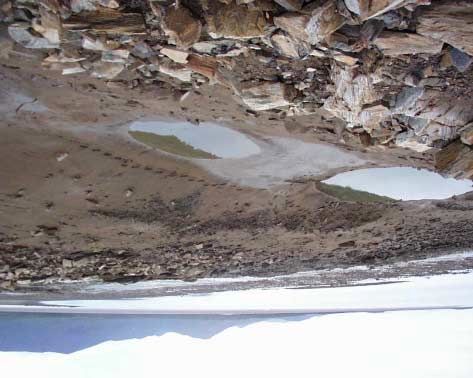
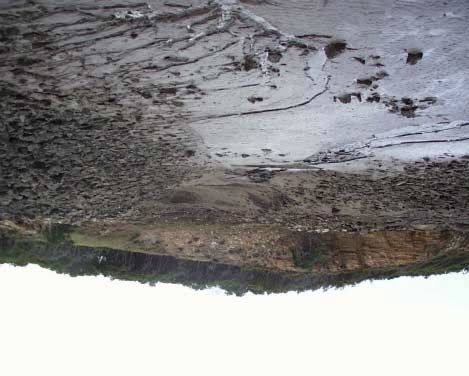
surroundings to further absorb energy. Barricade Passage is shown in Figure 4, and
Secondary Boat Channel is shown in Figure 5 and Figure 6.
The peak pressures recorded for these events are markedly less than the predictions for
deep water.
17DSTO-TR-1024
Figure 4 Barricade passage at low tide
Figure 5 Secondary Boat Channel at low tide; looking down from side of channel.
18DSTO-TR-1024
Figure 6 Secondary Boat Channel at low tide; from seaward.
The impulse results plotted in Appendix C:, remembering that these are the accumulated
impulses, and noting that the graphs have a logarithmic impulse scale are significantly less
than the predictions for every result. This is to be expected as the reflections from the
complex seabed and rock ledges, together with the rarefractions from the sea surface will
disrupt the blast shock wave significantly. The graphs have a “threshold” drawn at the 34
Pa.s impulse level as that level at which “no injuries” should occur for mammals diving
beneath the water surface [2].
The only events where impulses greater than this threshold were measured were the four
events discussed in the paragraph above. For these events the accumulated impulse was
greater than the threshold level for varying distances. Event 7 exhibits impulse above the
threshold level to a distance of nearly 1000 m from the explosives. Event 7 was the
detonation of a Mk 82 bomb positioned on the western ridge of the boat channel on Big
Bang Beach. The bomb was positioned further from Big Bang Beach than any other
explosive during this exercise, some 150 m from the high water mark. This was at the
request of the DSTO personnel to enable the measurement of a shock wave with little
interference of the surrounding geography. This placed the bomb clear of the rocky point
on the western end of Big Bang Beach with considerably more water over the bomb than
other explosives during this exercise. The other events where impulses were measured
above the threshold also had the explosives deployed in the open as opposed to in holes
and channels.
The amplitude of the impulse for every event reduces with distance at a greater rate than
the predictions for deep water. This is further evidence that the shallow water disrupts the
blast shock wave as it propagates through the water.
19DSTO-TR-1024
The events with the greatest explosive quantities, Events 11 and 13, did not produce the
greatest peak pressures or impulse. These two events were positioned in the Secondary
Boat Channel and in Barricade Passage respectively; both locations provide containment of
the blast and focus the shock upward to the water surface.
It appears that the normal mode of operation for the Clearance Diver training at
Triangular Island provides the best attenuation of blast by placing munitions in deep holes
and channels. In addition the separation of explosive items and the connection of them by
detonating cord broadens the time over which the detonation occurs and limits the shock
wave produced. The limit on the size of munitions used to Mk 82 bombs would also assist
in limiting the blast effects to the surrounding environment.
From the available evidence it appears that the clearance diver training conducted at
Triangular Island would not generate underwater blast shock waves of significant
amplitude to be injurious to mammals at distances greater than 1 kilometre. The greatest
pressure levels recorded were from events contrived to produce maximum pressure
transmission. When following normal procedures the safe distance would be much less
than 1 km.
5. Recommendations
The practise of deploying explosives in the natural and man-made channels and holes on
Triangular Island is recommended.
It is not possible to recommend maximum explosive limits on the evidence produced from
this exercise but explosives quantities used during the November 1999 exercise as reported
produced no significant pressure levels at distances over 1 km. When following normal
procedures the safe distance would be much less than 1 km.
20DSTO-TR-1024
6. Acknowledgments
The authors wish to thank the Officers and personnel from the RAN Dive School, HMAS
Penguin for their willingness to assist the DSTO personnel and provide advice and details
of their operations throughout this exercise.
7. References
1. Swisdak, Michael M. Jr (1978) Explosion Effects and Properties: Part II – Explosion
Effects in Water Technical Report NSWC/WOL TR 76-116 Naval Surface Weapons
Centre, Dahlgren, Virginia, USA.
2. Lewis, John. A. (1996) Effects of Underwater Explosions on Life in the Sea. General
Document DSTO-GD-0080, Aeronautical & Maritime Research Laboratory, Melbourne
21DSTO-TR-1024 22
DSTO-TR-1024

Appendix A: Pressure-Time Histories

                                               23
DSTO-TR-1024 24
DSTO-TR-1024

         25
DSTO-TR-1024 26
DSTO-TR-1024

         27
DSTO-TR-1024 28
DSTO-TR-1024

         29
DSTO-TR-1024 30
DSTO-TR-1024

         31
DSTO-TR-1024 32
DSTO-TR-1024

         33
DSTO-TR-1024 34
DSTO-TR-1024

         35
DSTO-TR-1024 36
DSTO-TR-1024

         37
DSTO-TR-1024 38
DSTO-TR-1024

         39
DSTO-TR-1024 40
DSTO-TR-1024

Appendix B: Peak Pressure v Distance Graphs

                                                  41
DSTO-TR-1024
Peak Pressure for Event 1
450
400
Predicted Peak Pressure
Determined Peak Pressure
350
300
Pressure (kPa)
250
200
150
100
50
0
200 400 600 800 1000 1200 1400
Distance (m)
Peak Pressure for Event 2
800
700
Predicted Peak Pressure
Measured Peak Pressure
600
500
Pressure (kPa)
400
300
200
100
0
0 200 400 600 800 1000 1200 1400
Distance (m)
42DSTO-TR-1024
Peak Pressure for Event 5
1400
1200
Predicted Peak Pressure
Determined Peak Pressure
1000
Pressure (kPa)
800
600
400
200
0
100 200 300 400 500 600 700 800 900
Distance
Peak Pressure for Event 6
1800
1600
Predicted Peak Pressure
Measured Peak Pressure
1400
1200
Pressure (kPa)
1000
800
600
400
200
0
80 100 120 140 160 180 200 220
Distance (m)
43DSTO-TR-1024
Peak Pressure for Event 7
2000
1800
Predicted Peak Pressure
1600
Measured Peak Pressure
1400
1200
Pressure (kPa)
1000
800
600
400
200
0
0 200 400 600 800 1000 1200 1400
Distance (m)
Peak Pressure for Event 8
3500
3000
Predicted Peak Pressure
Measured Peak Pressure
2500
Pressure (kPa)
2000
1500
1000
500
0
0 100 200 300 400 500 600 700
Distance (m)
44DSTO-TR-1024
Peak Pressure for Event 9
1600
1400
Predicted Peak Pressure
Measured Peak Pressure
1200
1000
Pressure (kPa)
800
600
400
200
0
0 100 200 300 400 500 600 700
Disrtance (m)
Peak Pressure for Event 10
1600
1400
Predicted Peak Pressure
Measured Peak Pressure
1200
1000
Pressure (kjPa)
800
600
400
200
0
0 100 200 300 400 500 600 700 800
Distance (m)
45DSTO-TR-1024
Peak Pressure for Event 11
800
700
Predicted Peak Pressure
Measured Peak Pressure
600
500
Pressure (kPa)
400
300
200
100
0
200 300 400 500 600 700 800 900 1000
Distance (m)
Peak Pressure for Event 12
2000
1800
Predicted Peak Pressure
1600
Measured Peak Pressure
1400
1200
Pressure (kPa)
1000
800
600
400
200
0
50 100 150 200 250 300 350
Distance (m)
46DSTO-TR-1024
Peak Pressure for Event 13
3500
3000
Predicted Peak Pressure
Measured Peak Pressure
2500
Pressure (kPa)
2000
1500
1000
500
0
0 50 100 150 200 250
Distance (m)
Peak Pressure for Event 14
3000
2500
Predicted Peak Pressure
Measured Peak Pressure
2000
Pressure (kPa)
1500
1000
500
0
0 50 100 150 200 250 300 350
Disatnce (m)
47DSTO-TR-1024 48
DSTO-TR-1024

Appendix C: Impulse v Distance Graphs

                                                 49
DSTO-TR-1024
Impulse for Event 2
1000
Accumulated Positive Impulse
Accumulated Negative Impulse
100 Accumulated Absolute Impulse
Predicted Impulse
Threshold
Impulse (Pa.s)
10
1
140 190 240 290 340
Distance from Charge (m)
Appendix D:
Impulse for Event 6
10000
1000
Accumulated Positive Impulse
Accumulated Negative Impulse
Accumulated Absolute Impulse
100 Predicted Impulse
Distance (m)
Threshold
10
1
80 120 160 200 240
0.1
Impulse (Pa.s)
50You can also read