7.1 NABARD in rural infrastructure financing

Page created by Lorraine Burke
 
CONTINUE READING
7.1 NABARD in rural infrastructure financing
7
   We must invest in
   infrastructure development
   and rebuilding communities to
   create jobs.
                              —Carol Moseley Braun¹

                                                                                                     FINANCING RURAL INFRASTRUCTURE
7.1 NABARD in rural infrastructure financing
NABARD has emerged as an important player in rural infrastructure financing over time,
leveraging various funds that Government of India (GOI) has vested in it. India’s rural
infrastructure landscape changed forever with a creative policy masterstroke in FY1996 that
mopped up the priority sector lending (PSL) shortfall of commercial banks to institute the Rural
Infrastructure Development Fund (RIDF) for reviving stalled fund-starved irrigation projects.
Started with a corpus of just `2,000 crore in FY1996 for financing irrigation, flood control, and
watershed management projects, RIDF was later extended to cover 37 activities to serve a gamut
of rural infrastructure needs; its journey has been marked by many impactful achievements.
Endorsing the need to scale up infrastructure at this juncture, NABARD pitched for a higher
corpus for RIDF in FY2022. The GOI allocated a corpus of `40,000 crore for XXVII RIDF
Tranche (FY2022), a big jump from `29,763 crore in FY2021.

    The PSL shortfall funds have since been used for warehousing, food processing, as also for
catalysing short-term and long-term credit by augmenting loanable funds of cooperatives and
regional rural banks. In 26 years, RIDF has funded states, state-owned corporations, and other
eligible agencies to reach a cumulative sanction of `4.1 lakh crore (including `18,500 crore under
Bharat Nirman), disbursing `3.2 lakh crore for financing projects pertaining to agriculture,
connectivity, and social infrastructure.
Table 7.1: Sanctions and disbursements under various infrastructure funds of NABARD (` crore)

 Fund                                FY2020                                    FY2021                               Cumulative
                                                                                                              (as on 31 March 2021)
                        Sanctions         Disbursements          Sanctions         Disbursements           Sanctions         Disbursements
 RIDF                    30,342.0             26,266.0            34,830.0              29,193.0          4,09,063.0           3,23,677.0

 LTIF                     6,094.9             10,469.8              2,461.8              7,761.2            84,326.6             52,479.7

 MIF                       2,841.6                 0.0               1,128.6             1,827.5             3,970.2               1,827.5

 PMAY–G                  20,000.0              10,811.0           20,000.0              19,999.8            61,975.0             48,819.0

 SBM–G                         0.0             3,600.0                  0.0                  0.0            15,000.0             12,298.2

 WIF                       1,056.0               844.0                200.0                909.0             9,728.0               7,621.0

 FPF                        149.0                 43.0                116.5                 53.2                701.2               409.4

 DIDF                       564.6                670.0                943.6                120.7             3,665.9              1,230.7

 FIDF                       348.0                  0.0                  0.0                193.8               348.0                193.8

 NIDA                     4,382.3              3,727.1             22,767.8              7,506.1            57,724. 3            22,800.1

 RIPF                          0.0                  1.2                25.0                 20.0                 25.0                37.9

 Total                  65,778.4              56,432.1            82,473.3              67,584.3         6,46,527.2           4,71,394.2

Notes: DIDF = Dairy Processing and Infrastructure Development Fund; FIDF = Fisheries and Aquaculture Infrastructure Development Fund; FPF = Food
       Processing Fund; LTIF = Long Term Irrigation Fund; MIF = Micro-Irrigation Fund; NIDA = NABARD Infrastructure Development Assistance;
       PMAY–G = Pradhan Mantri Awaas Yojana–Gramin; RIDF = Rural Infrastructure Development Fund; RIPF = Rural Infrastructure Promotion Fund;
       SBM–G = Swachh Bharat Mission–Gramin; WIF = Warehouse Infrastructure Fund.

    To ensure regional balance and sectoral diversity,                     7.2 Rural Infrastructure Development
we developed and refined an objective decision tool for                        Fund
allocating scarce resources across states. To determine
the quantum of RIDF sanction to a state, the tool                          7.2.1 Trends and patterns
took into consideration a host of factors such as its                      Despite the pandemic, our sanctions during FY2021
geography, demography, current level of infrastructure                     grew by 15% over FY2020, with states prioritising
development, past performance under RIDF, and share                        investments in irrigation and social infrastructure,
of agricultural infrastructure under RIDF.                                 perhaps as a counter-pandemic strategy. Disbursements
                                                                           too grew at an impressive 11.1% in FY2021, recovering
   In response to the high demand for rural
                                                                           from a decline in FY2020 (over FY2019).
infrastructure financing, NABARD has also instituted
other funds such as the NABARD Infrastructure                                  Cumulative data since inception of RIDF reveals that
Development       Assistance   (NIDA)     and    Rural                     fund utilisation (ratio of disbursements to sanctions)
Infrastructure Promotion Fund. As on 31 March 2021,                        is high at 78% for ongoing tranches and 93% for closed
the cumulative sanctioned amount under rural                               tranches (I–XIX). The Reserve Bank of India (RBI) has
infrastructure portfolio stood at `6.5 lakh crore with                     allowed NABARD to use the undrawn balance, if any, at
disbursements of `4.7 lakh crore (Table 7.1).                              the time of closure of any RIDF tranche, to the full extent
                                                                           of the corpus; this has freed up an additional amount of
                                                                           `9,665 crore, which can be disbursed to projects under
                                                                           subsequent tranches on an ongoing basis, spurring
                                                                           growth in sanction and disbursement.

        annual report 2020—21                                         86
Figure7.2: Projects under Rural Infrastructure
                                                                                        Development Fund by Sector in FY2021
    NABARD sanctioned `34,830 crore under RIDF                                       Figure 7.2: Projects under Rural Infrastructure
XXVI during the FY2021 as compared to `30,342 crore                                              Development Fund by sector in FY2021
in  FY2020
 Figure7.1:    and `30,485
            Sanctions         crore
                      under Rural      in FY2019 (Figure 7.1).
                                  Infrastructure
                                                                                                                Agriculture and
Development Fund by Sector, FY2019 to FY2021 (` crore)
                                                                                                                related activities,
Figure 7.1: Sanctions under Rural Infrastructure                                                                1,554; 5%
            Development Fund by sector, FY2019 to
            FY2021 (` crore)
                                                                  34,830
30,485                           30,342
                                                                                                                        Irrigation,
                                                             9,664        28%                                           8,613; 26%
    6,801                        8,270                                                        Social
                                                                                              infrastructure,
                                                             6,354
    7,912                                                                 27%                 19,069; 58%
                                 7,141                                                                                                   Rural bridges,
                                                             3,086
                                                                                                                                         835; 3%
    2,641                        2,023
                                                                                                                             Rural roads,
                                                             12,671                                                          2,757; 8%
    9,811                        9,828                                    45%

    3,320                        3,080                       3,055
FY2019                           FY2020                           FY2021
                                                                                        Disbursements under RIDF peaked at `29,193
                                                                                     crore in FY2021 with agriculture (including irrigation)
         Agriculture and related activities               Irrigation                 accounting for 43% share (Figure 7.3).
         Rural bridges                                    Rural roads
                                                                                        Agriculture including irrigation has been the most
         Social infrastructure                            Total
                                                                                     important sector for RIDF assistance since inception
                                                                                     with agriculture and related sector projects accounting
    Agriculture and related projects including irrigation                            for 44% of cumulative funding followed by rural
accounted for 45% of the sanctions with irrigation                                   connectivity (38%) and social sector projects (18%).
being the single-most preferred investment. At the
same time, social sector seemed to be on priority of                                     A recent study commissioned by NABARD revealed
state governments with a 58% share in the number of                                  wide inter-state disparities in rural infrastructure
 Figure7.2: Projects under Rural Infrastructure                                      development and suggested sector-wise reprioritisation
sanctioned     projects during FY2021 (Figure 7.2).
 Development Fund by Sector in FY2021                                                of fund allocation for better outcomes (Box 7.1).
                                              Figure7.3: Disbursement under Rural Infrastructure
                                              Development Fund by Sector, FY2019 to FY2021 (` crore)
Figure 7.3: Disbursement under Rural Infrastructure Development Fund by sector, FY2019 to FY2021 (` crore)
                         Agriculture and
                         related activities,
                         1,554; 5%                                                                    29,193
                                          27,623
                                                                           26,266
                                                                                                                27%
                                                6,020                                              7,902
                                                                           5,928

                                                9,211                      8,532                   8,764        30%
                                  Irrigation,
                                  8,613; 26%
                                                 9,697                     9,402                    9,959
     Social                                                                                                     43%
     infrastructure,
     19,069; 58%                                  2,695                  2,404                      2,568
                                                     Rural bridges,
                                            FY2019                      FY2020                         FY2021
                                                     835; 3%
                                         Rural roads,
                                         2,757; 8%Agriculture and related activities              Irrigation
                                                  Rural connectivity                              Total
                                                  Social infrastructure

                                                                                87                                      Financing Rural Infrastructure
Box 7.1:    Renewed effort at the construction of state-wise rural infrastructure indices

   The study aimed to construct state-wise rural infrastructure indices (RIIs) and use them to develop a scheme for state-
   wise Rural Infrastructure Development Fund (RIDF) allocation. This study took into account 9 components captured by
   71 indicators of rural infrastructure, which were broadly grouped into agriculture and allied activities including irrigation,
   rural connectivity, and rural social sector.
       The study revealed wide interstate disparity in rural infrastructural development, indicating that if the quantum of
   loans to state governments from RIDF were to be scientifically derived, based on their RII, it would greatly rationalise fund
   allocation while maximising impact.
       The study classified states into top 10, middle 10, and bottom 10 on the basis of their share in RIDF allocation. Populous
   states such as Uttar Pradesh, Bihar, and Madhya Pradesh, occupied positions in the top category with sizable share in
   RIDF assistance across almost all components of rural infrastructure. The bottom states included those from the North
   East with very low share.
       For a more equitable and balanced approach, the study recommended that 2%–3% of the total RIDF outlay be reserved
   for each of the 10 poorest performing states in terms of RII and the remaining be distributed to other states in accordance
   with their respective shares.
         The study suggested that of the total RIDF funding,
   •     rural social infrastructure such as health care system and delivery, provision of drinking water and sanitation, and
         educational facilities receive 38.3%,
   •     agriculture and allied activities including irrigation receive 34.5%, and
   •     rural road connectivity be allocated 11.4%.

   Source: Dennis J. Rajakumar, Vijayata B. Sawant, and S.L. Shetty (2020), Construction of State-wise Rural Infrastructure Indices, Economic
   and Political Weekly Research Foundation, Mumbai (sponsored by NABARD).

    A quick look at Figure 7.4 reveals that between                           Box 7.2:     Rural Infrastructure Assistance to State
FY2019 and FY2021, Eastern India received the highest                                              Governments
share of both sanctioned as well as disbursed funds
(25%), while the North East including Sikkim received                         In the wake of the announcements made by
the lowest (7%). However, the fact that the share of the                      Prime Minister Narendra Modi regarding the
East and North East in sanctions and disbursements is                         investment of `100 lakh crore in infrastructure with
double their respective shares in net sown area reflects                      the objective of making India a $5 trillion economy by
NABARD’s emphasis on alleviating regional disparities                         FY2025 and unveiling of the report of the Task Force
through strategic RIDF deployment. Continuing its                             on National Infrastructure Pipeline by the Union
efforts towards promoting greater regional balance and                        Finance Minister, it was felt that NABARD could play
                                                                              a more significant role in boosting investments in
ensuring adequate investments in rural infrastructure
                                                                              rural infrastructure. Against this backdrop, NABARD
for supporting livelihoods, NABARD has instituted the
                                                                              decided to institutionalise a new product viz., Rural
Rural Infrastructure Assistance to State Governments
                                                                              Infrastructure Assistance to State Governments (RIAS),
(Box 7.2).
                                                                              to create infrastructure that supports livelihoods.
    Over the years, the cumulative RIDF sanctions                                 The RIAS will initially focus on Eastern India
to the regions with low credit–deposit ratio have                             including Bihar, Jharkhand, Odisha, Chhattisgarh,
witnessed a steady upward trend. Credit-starved states                        West Bengal, and Eastern Uttar Pradesh because not
of the Central, East, and the North East have benefitted                      only are these areas more deficient in physical and
immensely from RIDF and the combined share of these                           social infrastructure but also under maximum pressure
regions has gone up in the RIDF cumulative sanctions.                         from pandemic-induced reverse migration from other
During FY2021, the ground level credit (GLC) in East,                         parts of the country.

       annual report 2020—21                                          88
Figure7.4: Region-wise Sanctions and Disbursements under the Rural
    Infrastructure Development Fund (in ₹ crore)

Figure 7.4: Region-wise sanctions and disbursements under the Rural Infrastructure Development Fund (` crore)

                     Northern                                                                               North Eastern & Sikkim

                        FY2019      4,464                                                                               FY2019    2,323
        Sanctioned      FY2020      4,661                                                               Sanctioned      FY2020    1,961
        (14.8%)                                                                                         (7.1%)
                        FY2021      5,027                                                                               FY2021    2,495

                        FY2019      3,577                                                                               FY2019    1,725
         Disbursed                                                                                      Disbursed
                        FY2020      3,314                                                                               FY2020    1,881
        (13.6%)                                                                                         (7.0%)
                        FY2021      4,426                                                                               FY2021    2,234

                      Western                                                                                         Eastern

                        FY2019      4,783                                                                               FY2019    6,883
        Sanctioned                                                                                      Sanctioned
                        FY2020      4,854                                                                               FY2020    7,319
        (14.9%)                                                                                         (24.6%)
                        FY2021      4,643                                                                               FY2021    9,319

                        FY2019      3,614                                                                               FY2019    7,252
         Disbursed                                                                                       Disbursed
                        FY2020      4,496                                                                               FY2020    6,417
        (14.5%)                                                                                         (25.4%)
                        FY2021      3,923                                                                               FY2021    7,472

                     Southern                                                                                         Central

                        FY2019      6,374                                                                               FY2019    5,659
        Sanctioned                                                                                      Sanctioned
                        FY2020      5,880                                                                               FY2020    5,667
        (20.1%)                                                                                         (18.5%)
                        FY2021      7,015                                                                               FY2021    6,330

                        FY2019      5,988                                                                               FY2019    5,467
         Disbursed                                                                                       Disbursed
                        FY2020      5,548                                                                               FY2020    4,609
        (20.8%)                                                                                         (18.6%)
                        FY2021      5,721                                                                               FY2021    5,417

Note:   Figures in parentheses represent the region’s share in total sanction/disbursement during FY2019–FY2021.

North East, and Central zones was 25% of the total GLC                           It may also be pertinent to observe that RIDF loans
in the country, whereas the RIDF sanctions to these                           in the credit-starved backward districts, as identified
regions was to the tune of 52% of the total sanctions.                        by the Internal Working Group of the RBI, constituted
                                                                              about 20% of the total RIDF sanctions during FY2019

                                                                         89                                        Financing Rural Infrastructure
and 15% over the five-year period ended FY2020, which                7.2.2 Economic and social impact
is much healthier than the reported share of these                   The RIDF projects consistently deliver positive outcomes
districts in the total outstanding priority sector credit of         for rural production, productivity, income, employment,
only 3.1%.                                                           environment, and sustainability (Figure 7.5 and
                                                                     Showcases 7.1–7.3).
   Figure 7.5: Economic and social impact
Figure 7.5: Economic and social impact of the Rural Infrastructure Development Fund

                                                                                     Bridge length
                                      Non-recurring                                 12.3 lakh metre
       Irrigation
                                       employment
       potential                                                                                          Non-recurring
                                      1,42,175 lakh
      349 lakh ha                                                 Road length                             employment
                                       person days
                                                                  4.9 lakh km                             63,390 lakh
                                                                                                          person days

                                                                                         Rural
                      Irrigation                                                      connectivity

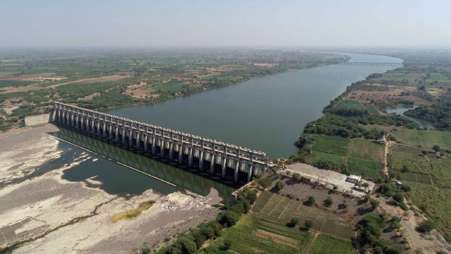
  Showcase 7.1: Narmada–Malwa–Gambhir link, the first prepaid metered irrigation project in
                Madhya Pradesh

  Objective

  To provide piped irrigation up to 40 ha chak to the water deficit areas in
  the upper reaches of the Chambal basin.

  Financials
     •   Total financial outlay: `2,187.3 crore
     •   Rural Infrastructure Development Fund loan
         ❖ Phase I `1,035 crore (Tranche XX)
         ❖ Phase II `931 crore (Tranche XXI)

  Project description
     •   This single turnkey project, linking rivers Narmada and Gambhir,
         is in the last stage of implementation.
     •   Water is lifted from the Omkareshwar Project reservoir on the
         Narmada in the Nimar region and delivered to the river Gambhir
         to meet the irrigation and drinking water needs of the Indore
         and Ujjain districts of the Malwa region.
     •   The gross command area under the project is 83,000 ha.
     •   The cultivable command area is 50,000 ha.
     •   Annual irrigation across 78,000 ha in the Indore and Ujjain
         districts is planned along with water supply for both drinking
         and industrial use.                                                                                    (Continued)

    annual report 2020—21                                       90
•    Narmada Valley Development Authority is in the process of forming ‘water user associations’ to look after the operation
       and management of the project.

Prepaid metering process
  •    Under the project, assured irrigation is available through prepaid connections at the farmer’s field.
  •    Details of the beneficiary farmers and their land are entered in the software operated and managed from the command
       centre at Khargone (Nimar region).
  •    Water user charges are levied by land area and cropping pattern of each farmer.
  •    The farmers recharge their irrigation accounts digitally using their mobile phones.
  •    Every group of 15–20 farmers in a 40 ha chak is represented by a team leader.
  •    Irrigation water is released from the command area on the telephonic request of the team leader.

Impact
  •    The project is expected to benefit 158 villages from 6 tehsils of Indore and Ujjain districts.
  •    Irrigation to 26,000 ha has been made available covering about 65,000 farmers.

  Note: The command area of an irrigation outlet is called chak, which is a basic unit for irrigation management. Establishing layouts
  of the chaks in the command of a given channel is the first step of the irrigation planning process.

Showcase 7.2: Reclamation of waterlogged areas in Sri Muktsar Sahib, Fazilka, and Ferozpur districts
              of Punjab

Objective

To rejuvenate agriculture production systems by reclaiming seasonally or
permanently waterlogged areas of south-western districts of Punjab.

Financials
   •   Total financial outlay: `60 crore
   •   Rural Infrastructure Development Fund assistance: `51.3 crore

Project description
   •   Under the project, water from waterlogged areas is tapped to augment
       canal irrigation of water-deficit areas.
   •   The canal water is carried to tail-end farmers through underground
       pipelines for conveyance efficiency.
   •   The project received the Sustainable Development Goals Action Award
       from the Sustainable Development Goal Coordination Centre of the
       United Nations under the category ‘Integration, Convergence, Joint
       Action and Holistic Solutions Approach’.

Impact
   •   The project aims to benefit 7,551 ha of land cultivated by 6,090 farmers
       from 91 villages of Sri Muktsar Sahib, Fazilka, and Ferozpur districts.
   •   It has already resulted in a significant increase in crop productivity
       (approximately 18% for paddy and 52% for wheat).
   •   On an average, 36.1% water is being saved in the paddy fields and 43.3% in wheat fields.
   •   The underground pipelines have reduced both labour cost and drudgery for the farmers.
   •   Land-use saving by around 3%; elimination of water logging near the channel (1.5%); elimination of additional wells
       in the area; and higher safety in operations are additional benefits.

                                                                  91                                     Financing Rural Infrastructure
Showcase 7.3: Modernisation of tea processing centres in Tamil Nadu

  Objective
     •   To facilitate phased technological upgrade of industrial
         cooperative tea processing centres of INDCOSERVE
         (Nilgiris district, Tamil Nadu), which is the largest
         cooperative federation of small tea growers in India.

  Financials
     •   Rural Infrastructure Development Fund assistance:
         `16.8 crore

  Project description
     •   The project aimed to replace existing crush–tear–curl
         lines in four factories and switch to orthodox line in
         one.
     •   Modernisation of pre-processing facilities involved
         automation of grading of green tea leaves using
         artificial intelligence.
     •   The project also entailed automation of packaging
         facilities.
     •   Besides improvements through civil works, major
         infrastructure upgrade included installation of new
         machinery at the collection centres and processing
         lines.

  Impact
     •   Benefits were secured for 8,985 small tea growers spread across 68 villages of Nilgiris district.
     •   Improvements in processing and marketing techniques led to better price realisation by small and marginal tea
         farmers.

7.3 Long Term Irrigation Fund
Announced in the Union Budget FY2017, Long Term                     share has been fully funded through market borrowings.
Irrigation Fund (LTIF) is meant to fast track 99                    The loans are extended to state governments at 6%
irrigation projects and augment irrigation potential by             interest per annum.
34.6 lakh ha. NABARD has been providing assistance
for meeting both central and state government shares of
funding required to complete stalled priority irrigation               Funding under LTIF has been
projects. The central share is provided to the National
Water Development Agency, under the aegis of                                instrumental in creating
Ministry of Jal Shakti, GOI, whereas state governments
concerned can choose to avail loan towards their share.                       irrigation potential of
(Figure 7.6).                                                         21.3 lakh ha during 2016–2020
    From 1 April 2018, loans towards central share have
                                                                             —Ministry of Jal Shakti, Government of India.
been entirely funded through extra-budgetary resources
in the form of fully serviced GOI bonds while the state

    annual report 2020—21                                      92
Figure 7.6: State-wise funds sanctioned and released under Long Term Irrigation Fund as on 31 March 2021 (` crore)

Figure 7.6: State-wise funds sanctioned and released under Long Term Irrigation Fund as on 31 March 2021
            (` crore)

     25,000                                                                                                                                             State share
                         22,648.8                                                                                                                       Central share
                                                                                                                                                        T otal
     20,000

     15,000                        13,157.2
                                               11,769.5               11,093.2
     10,000                                               9,246.5
                                                                                   7,107.0          7,366.0
                                                                                                                          6,400.7
                                                                                                              4,658.7
      5,000                                                                                                                                        3,478.8
                                                                                                                                      1,895.0
                                                                                                                                                                673.9
             0
                     S              R           S             R        S            R               S            R         S            R           S            R
                    Maharashtra                     Gujarat           Uttar Pradesh                     Odisha           Madhya Pradesh             Telangana

     2,500               2,365.1                                                                                                                        State share
                                                                                                                                                        Central share
                                                                                                                                                        T otal
     2,000                                    1,837.3

                                                                      1,507.8
     1,500                    1,274.8
                                                          1,183.3
                                                                                                939.0
     1,000                                                                         829.1
                                                                                                                          700.3
                                                                                                              581.1                    598.4
       500                                                                                                                                         311.0
                                                                                                                                                                115.7
         0
                     S              R           S             R        S            R               S            R         S            R            S           R
                      Jharkhand                  Karnataka              Rajasthan               Andhra Pradesh                 Manipur                   Assam

      300.0                                                                                                                                             State share
                     245.8                                                                                                                              Central share
      250.0                                     240.0
                                                                                                                                                        T otal

      200.0
                                                              146.1     143.7
      150.0

      100.0
                                    62.8                                                70.5
                                                                                                     57.3                      48.7
                                                                                                                 46.3
       50.0
                                                                                                                                                         17.6
                                                                                                                                            2.7                      3.8
        0.0
                      S             R            S            R            S            R               S            R         S            R            S           R
                     Chhattisgarh                    Bihar                     Punjab                   Jammu and                  Kerala                    Goa
                                                                                                          Kashmir

Notes:
    1. S = Sanctioned; R = Released
    2. Loans sanctioned across the 18 states in the figure: central share `32,588 crore, state share `38,582 crore
    3. Loans released across the 18 states in the figure: central share `14,921.9 crore, state share `26,731.0 crore

                                                                                               93                                                 Financing Rural Infrastructure
Figure 7.8: Sector share in NIDA as on 31 March 2021

  In addition to the 99 projects identified initially, four                             Figure 7.8: Sector share in NIDA as on 31 March 2021
new projects have been brought within the ambit of
LTIF (Figure 7.7).                                                                                                          Sector sh
                                                                                                                                     are
                                                                                                                                               in a
                                                                                                                                                      mo
                                                                                                                  2%   4%                                 un
                                                                                                           2%                                               ts
Figure 7.7: Funds sanctioned and released under Long Term Irrigation                                                                                          an
 Figure
Fund      7.7: Funds
     for additional      sanctioned
                    projects           and released
                             as on 31 March            under Long
                                            2021 (` crore)

                                                                                                                                                                 ct
                   Term Irrigation Fund for additional projects

                                                                                                                                                                    io
                                                                                                                                   13%

                                                                                                                                                                   ne
                                                                                                 14%          18%                                          43%

                                                                                                                                                                     d
                   as on 31 March 2021 (` crore)                                                                       Sector share
                                                                                                                                      in
                                                                                                                                           n
                                                         Sanctioned                               1%

                                                                                                                                           o.
  12,000

                                                                                                                                               of
               10,465.8                                  Released
                                                                                                   3%

                                                                                                                                               pro
  10,000                  9,898.4

                                                                                                                                                  jects
   8,000
                                                                                                   11%
   6,000                                                                                   17%
                                                                                                                                                       47%
   4,000
                                                                                                         7%
   2,000                    1,378.6
                                       721.2   485.4 207.5   826.8
        0                                                               0.0
               Polavaram       North Koel Shahpurkandi Relining of
                               Reservoir      Dam     Sirhind Feeder
                                                                                                                    18%
                                                      and Rajasthan
                                                          Feeder

Note:       These loans were extended towards ‘central share’ in entirety.                           Irrigation                                Power distribution
                                                                                                     Power transmission                        Communication
                                                                                                     Drinking water                            Others
                                                                                                     Roads and bridges
7.4 NABARD Infrastructure
Figure 7.8: Sector share in NIDA as on 31 March 2021

    Development Assistance                                                              Note: ‘Others’ include rural housing, wind power, solar power,
NABARD Infrastructure Development Assistance                                                   warehousing, hydro power, sewerage, watershed development,
                                                                                               and development of market yard.
(NIDA) offers flexible long-term loans to well-managed
                                     Sec r sh
public sector entities for financing torural     areinfrastructure,
                                                     in a
                                                          mo
including projects for agriculture
                          2% 4%           infrastructure,    un rural
                       2%                                      ts
connectivity, renewable     energy, power transmission,           an
                                                                                           Cumulatively, 111 projects have been sanctioned
drinking water and sanitation, and other social and
                                                                              ct

                                                                                        under NIDA with term loan of `57,724.3 crore, of which
                                                                              io

                                              13%
                                                                               ne

commercial infrastructure.
             14%        18% Inclusion of public–private       43%
                                                                                 d

                                    tor shar
                                                                                        `22,800 crore has been disbursed so far (Figure 7.8).
                              S e c
partnership (PPP) and non-PPP projects       e in      (undertaken
                                                  n
by registered entities like corporates/companies,                                           NIDA has created profound socio-economic impact
               1%
                                                         o.

cooperatives, etc.) has further broadened NIDA’s scope                                  by enhancing agri-production and productivity, better
                                                             of

               3%
                                                             pro

of funding.                                                                             connectivity, employment, and also facilitating access
                                                                jects

                                                                                        to improved sanitation and assured supply of water,
   During FY2021, term loan of `22,767.8 crore                                          with implications for reducing child malnutrition and
               11%
was sanctioned
        17%
                 for eight irrigation projects (60.9%;                                  child mortality as well as improving female enrolment
`13,865 crore); four drinking water 47%        projects                                 in schools. The NIDA projects are also instrumental in
(21.7%; `4,931.5 crore);
                   7%     three  transmission  projects                                 achieving targets under Sustainable Development Goal
(3.9%; `893.7 crore); and one each under rural                                          6 of Clean Water and Sanitation (Figure 7.9).
connectivity (5.1%; `1,158.5 crore), rural housing
(3.5%; `792.4 crore), sewerage (0.3%; `64.9 crore), and
communication sector (4.1%;
                         18% `1,061.7 crore).

                          Irrigation                         Power distribution
                          Power transmission                 Communication
                          Drinking water                     Others
                          Roads and bridges
        annual report 2020—21                                                      94
Figure 7.9: Impact of NIDA projects

 Figure 7.9 Impact of NIDA projects

           Irrigation                 Micro-irrigation                   Renewable energy                        Power transmission

                                                                         1,242.3 MW
                                                                   generation capacity built                 52 projects in 15 states
          13,83,013 ha                    1,39,000 ha                                                       assisting in modernising
                                                                    via 4 solar and 5 wind
           benefitted                     area covered                                                     transmission infrastructure
                                                                   power projects in 7 states

                                                                       Warehousing and cold
        Rural connectivity         Drinking water supply                                                             Sanitation
                                                                         storage capacity

                                                                                                              15 million litres per day
      7,410 km road                 33,758 habitations                                                            capacity of sewer
    length and 7.9 km                 with doorstep                       29,600 tonne                         treatment facility with
    bridge length built                   supply                         capacity created                      associated sewer lines

7.5 Funding warehouse infrastructure                                            Loans amounting to `909 crore were disbursed under
NABARD provides financial support under the                                  WIF during the year as against `844 crore in FY2020.
Warehouse Infrastructure Fund (WIF) to state                                 Further, a term loan of `200 crore was also sanctioned
governments, state-owned agencies, and corporates for                        to the Government of Madhya Pradesh in FY2021. As
the creation of scientific warehouse capacity to support                     part of pandemic response, NABARD extended relief
value chains in agriculture (Table 7.2 and Figure 7.10).                     by deferring principal and interest repayments to two
This investment is instrumental in aiding farmers’                           borrowing entities to the tune of `38.9 crore in line with
access to finance through negotiable warehouse                               the relief measures announced by the RBI.
receipts. Foodgrains production has grown more than
six times since 1950 and trends indicate that by 2030                            NABARD developed a web-based agri-storage
it will cross 350 million tonne. To accommodate the                          infrastructure information system that captures geo-
increase in production, there will be sustained demand                       spatial coordinates and provides physical details,
for investment in storage during the current decade.                         amenities, and contact information of each storage asset
                                                                             (Box 7.3).

Table 7.2: Loan sanctions and disbursement under Warehouse Infrastructure Fund as on 31 March 2021 (` crore)

 Tranche                                      Corpus allocated                         Sanctions                   Cumulative disbursement
 FY2014                                              4,481                               4,535                              3,237
 FY2015                                             5,000                                5,193                              4,384
 Total                                              9,481                                9,728                              7,621

Note:    Of the `5,000 crore corpus of the WIF Tranche FY2014, `519 crore was refunded to commercial banks.

                                                                        95                                       Financing Rural Infrastructure
Figure 7.10: Region-wise performance of Warehouse Infrastructure Fund (capacity in '000 tonne)

Figure 7.10: Region-wise performance of Warehouse Infrastructure Fund (capacity in ‘000 tonne)

                       All India                                              Northern                       North Eastern & Sikkim

             No. of projects        7,601                         No. of projects                 198    No. of projects                166
             Capacity               5,742                         Capacity                        435    Capacity                        22

                                                                               No. of projects      3                No. of projects      2
                                                                  Share (%)                              Share (%)
                                                                               Capacity created     8                Capacity created 0.4

                                                                               Western                                Eastern

                                                                  No. of projects                1,855   No. of projects                878
                                                                  Capacity                        748    Capacity                      1,027

                                                                               No. of projects     24                No. of projects     12
                                                                  Share (%)                              Share (%)
                                                                               Capacity created 13                   Capacity created 18

              Multi-state projects                                            Southern                                Central

        No. of projects                      22                   No. of projects                3,825   No. of projects                657
        Capacity                            365                   Capacity                       3,146   Capacity                          -

                      No. of projects         -                                No. of projects     50                No. of projects      9
        Share (%)                                                 Share (%)                              Share (%)
                      Capacity created        6                                Capacity created 55                   Capacity created      -

Note:     Share (%) represents the region’s share in all India.

                                   Box 7.3:       Geo-tagging of agri-storage infrastructure across India

    NABCONS, a subsidiary of NABARD, has developed a web-based agri-storage infrastructure information system which
    enables
    •     efficient use of existing warehousing capacity,
    •     integration of small farmers with the commodity value chain,
    •     reduction in post-harvest losses in agriculture and allied commodities, and
    •     uberisation of warehousing given the scalability of the platform.
        Since the information system captures location, capacity, facilities, and contact details of each warehouse, geo-tagging
    has also led to the development of a farmers’ app (Kisan Bhandar). The app helps farmers and other stakeholders locate
    the nearest storage structure within a radius of 30 km, enabling them to take a conscious decision in choosing the right
    storage structure for holding their produce.

        annual report 2020—21                                                 96
7.6 Funding food processing                                                   `409.4 crore. While investing in infrastructure within
    infrastructure                                                            DFPs helps prospective entrepreneurs save on capital
                                                                              expenditure, financing individual units helps both DFPs
NABARD provides affordable credit under the Food
                                                                              and enterprises become viable.
Processing Fund (FPF) to public and private players
for setting up agro-processing clusters in designated                            As on 31 March 2021, NABARD has sanctioned term
food parks (DFPs) notified by the Ministry of Food                            loan of `701.2 crore for 12 mega food parks, 10 agro-
  Figure 7.11: Loan
Processing          sanctions and
                Industries,   GOI,disbursement under Food Processing
                                     and for establishing    food             processing clusters, and 10 individual food processing
  Fund as on 31 March 2021 (` crore)
processing units therein (Figure 7.11). Cumulative                            units (Showcase 7.4).
disbursement as on 31 March 2021 through FPF is

  Figure 7.11:            Loan sanctions and disbursement under Food Processing Fund (` crore)

                                           Sanctioned                                                      Disbursed

      % Achieved                                                              % Achieved
                                   85.3                         77.7                               34.6                    46.3

          200                                                                       200
                           175.0
          160                      149.3              150.0                        160
                                                                                           125.0
                                                              116.5                                                115.0
          120                                                                      120

             80                                                                     80
                                                                                                                           53.2
                                                                                                    43.3
             40                                                                     40

               0                                                                     0
                             FY2020                     FY2021                               FY2020                    FY2021
                                      Target         Achieved                                        Target        Achieved

  Showcase 7.4: Gurukripa Mega Food Park, Ladhowal, Ludhiana district, Punjab
                      Figure 7.12: Rural houses built under PMAY–G
  Objective as on 27 February 2021 (in crore)
      •   To set up a mega food park (MFP) in Ludhiana.

  Financials
          Targeted

                                                                       2.95
      •   Total financial outlay: `117.6 crore
      •   Food Processing Fund term loan: `27.1 crore to
          Punjab Agro Industries Corporation Limited
          Completed

  Project description                          1.3

      •   The MFP was planned on an area of 100 acres with common facilities on 46 acres.
      •   Ten sheds for micro, small and medium enterprises were provided over an area of 2,619 square meters so that minor
          food processing units could access the plug-and-play infrastructure.
      •   Four primary processing centres (based on hub-and-spoke model) enabled procurement of raw material for the food
          processing units.
                                                                                                              (Continued)

                                                                         97                                    Financing Rural Infrastructure
•       The project led to the creation of
                     ❖ 2,900 tonne of cold storage capacity (including
                       cold store, spiral freezer etc.),
                     ❖ 20,000 tonne of dry warehouse and silos
                       capacity, and
                     ❖ 100 tonne of ripening chambers capacity along
                       with incubation centres and testing lab.
             •       The MFP provided backward and forward linkages to
Figure 7.11: Loan sanctions
                food growersandacross
                                disbursement  underofFood
                                      12 districts        Processing
                                                      Punjab.
Fund as on 31 March 2021 (` crore)

       Impact
             •       The MFP brought together stakeholders to create infrastructure for food processing and maximise gains for farmers
                     through the agri-value chain.
             •       The food processing sector in Punjab received impetus through the creation of supply chain infrastructure including
                     collection centres, primary processing centres, central processing centres, and the cold chain.
                                        Sanctioned                                                     Disbursed
             •       Besides these services, the availability of fully developed plots for entrepreneurs contributed to making food processing
                     units commercially viable.
             •       The MFP will potentially provide direct as well as indirect employment to 12,000 persons.
    % Achieved                                                             % Achieved
                                 85.3                        77.7                             34.6                   46.3

        200                                                                      200
                         175.0
    7.7160Housing149.3
                  for all by 2022
                             150.0                                               160
    The Pradhan Mantri Awaas Yojana–Gramin        (PMAY-G)                       31 March125.0
                                                                                           2021, NABARD has sanctioned `61,975 crore
                                          116.5                                                            115.0
        120                                                                       120
                                                                                 and released `48,819 crore for this purpose.
    aims at providing a pucca house with basic amenities
    to all80houseless households and those living in kutcha                       80
                                                                                                                     53.2
                                                                                                43.3
                                                                                 7.8
                                                                                  40 Dairy Processing and Infrastructure
    and dilapidated houses, by 2022. The scheme envisages
         40
    construction of 2.95 crore houses: 1 crore houses under
    Phase0 I (FY2017 to FY2019) and 1.95 crore under                               0 Development Fund
                   FY2020
    Phase II (FY2020                  FY2021
                        to FY2022) (Figure 7.12).                                           FY2020 and Infrastructure
                                                                                 Dairy Processing             FY2021 Development Fund
                                   Target         Achieved                                       Target    Achieved
                                                                                 set up in NABARD envisages creation and modernisation
       NABARD has been extending support to the National                         of milk processing facilities and other dairy related
    Rural Infrastructure Development Agency, a special                           infrastructure within an implementing period of up to
    purpose vehicle of the GOI, towards part funding of the                      FY2023.
    central share under the PMAY–G since FY2018. As on
                                                                                     Cumulatively, as on 31 March 2021, 43 projects in
                                                                                 11 states have been sanctioned to the National Dairy
                    Figure 7.12: Rural houses built under PMAY–G
    Figure 7.12: Rural houses built under PMAY–G as on                           Development Board and the National Cooperative
           as on 27 February 2021 (in crore)
    		 27 February 2021 (in crore)                                               Development Corporation with loan amount of
                                                                                 `3,644.5 crore for an investment of `5,256.5 crore in
                                                                                 the dairy processing sector. The cumulative amount
        Targeted

                                                                                 disbursed is `1,230.7 crore. The sanctioned projects are
                                                                    2.95
                                                                                 expected to create milk-processing capacity of 162.7 lakh
                                                                                 litre per day (LLPD), modernisation of existing plants
                                                                                 of 10.6 LLPD, value addition capacity of 2,794.8 metric
        Completed

                                                                                 tonne per day (MTPD), and milk drying capacity of
                                            1.3                                  300 MTPD in implementing states (Figure 7.13).

    Source: Ministry of Rural Development, Government of India.

          annual report 2020—21                                             98
Dairy Processing and Infrastructure Development Fund as on 31 March 2021 (` crore)

Figure 7.13: Cumulative state-wise sanctions and disbursement under Dairy Processing and Infrastructure
		 Development Fund as on 31 March 2021 (` crore)
          1,800
                    1,626.2
          1,600

          1,400                                  1,370.7

          1,200
                                                           1,062.8
          1,000               920.0

            800                       722.6
                                                                                 663.7
            600                                                                          549.4
                                                                                                               488.9
            400                                                                                                                               322.7
                                                                                                                       282.9                          254.4
            200                                                      163.7                                                     140.4                           141.2
                                                                                                 0.0
              0
                         Karnataka                        Gujarat                      Tamil Nadu                 Maharashtra                         Punjab

                                                      Project outlay                    Loan amount                     Disbursement

            300

                   261.5
            250

            200                               194.4

                           156.7                      155.5
            150
                                                                       130.0
                                                                               104.0
            100                                                                                  97.8
                                                                                                        78.2
                                                                                                                          74.7
                                                                                                               51.8              59.8
             50
                                                                                                                                                      26.0
                                                                                                                                                              20.8
                                                              6.9                                                                       4.2
                                      0.0                                               0.0                                                                           0.0
              0
                       Telangana                 Haryana                 West Bengal             Andhra Pradesh                Rajasthan                     Kerala

                                                      Project outlay                    Loan amount                     Disbursement

Note:     For the 11 states in the figure, the total project outlay is `5,256.5 crore, loan amount is `3,665.8 crore, and disbursement is `1,230.8 crore.

7.9 Other Infrastructure Initiatives
                                                                                          provisions of Pradhan Mantri Krishi Sinchayee Yojana–
                                                                                          Per Drop More Crop.
7.9.1 Per Drop More Crop
Micro-Irrigation Fund (MIF), operationalised in                                              During FY2021, loan amount of `1,128.6 crore
NABARD in FY2020, has, in this fiscal too, continued                                      was sanctioned to four states, viz., Haryana, Punjab,
to support efforts of state governments in mobilising                                     Uttarakhand, and West Bengal. Further, loan amount of
additional resources for expanding coverage under                                         `1,827.5 crore was released to the states of Andhra Pradesh,
micro-irrigation and incentivising its adoption beyond                                    Gujarat, Haryana, and Tamil Nadu during the year.

                                                                                   99                                              Financing Rural Infrastructure
This fund ensures water-use efficiency and water                   As on 31 March 2021, the cumulative sanction
conservation while increasing irrigation coverage. As              under SBM–G stood at `15,000 crore and release at
on 31 March 2021, the cumulative sanction under MIF                `12,298.2 crore. The loan assistance from NABARD has
stood at `3,970.2 crore and release at `1,827.5 crore. The         facilitated construction of 3.3 crore household toilets.
implementation of sanctioned projects will facilitate
expansion of micro-irrigation to an area of 12.8 lakh ha.
                                                                   7.10 Rural infrastructure, key to a
7.9.2 Developing fisheries and aquaculture                         		 $5 trillion economy
      infrastructure                                               As India’s economy strives to sustain through the
NABARD, being one of the nodal loaning entities                    pandemic, the role of infrastructure development as
under the Fisheries and Aquaculture Infrastructure                 an essential enabler for economic growth, income
Development Fund, will fund the public infrastructure              augmentation, and improved standard of living becomes
components to the tune of `2,508 crore through                     more pertinent. Infrastructure development and
state governments/UTs for various fishery-based                    upgrading will be key to raising India’s competitiveness
infrastructure activities. NABARD has executed                     and achieving the target of a $5 trillion economy by
tripartite memoranda of agreement with nine state                  FY2025.
governments, viz, Tamil Nadu, West Bengal, Andhra
Pradesh, Gujarat, Karnataka, Kerala, Maharashtra, Goa,                 NABARD has been playing a significant role
and Haryana.                                                       in expanding rural infrastructure through various
                                                                   programmes and funds like RIDF, LTIF, WIF, and
    So far, NABARD has sanctioned `348 crore and                   NIDA, and shall continue its support for infrastructure
disbursed `93.8 crore for the development of three                 development in the country. NABARD’s strategy in the
fishing harbours in Tamil Nadu. The proposed fishing               infrastructure space is unique as it focuses on expansion
harbours are expected to provide employment to 12,115              to achieve scale and diversification to cater to new and
sea-going fishermen and additional employment to                   emerging rural needs.
9,000 persons in shore-based establishments related
to distribution and marketing of fish and crustacean
products.                                                          Notes
                                                                   1.   Carol Elizabeth Moseley Braun is an American diplomat,
7.9.3 Swachh Bharat Mission–Gramin                                      politician and lawyer who represented Illinois in the
                                                                        United States Senate from 1993 to 1999.
Under Swachh Bharat Mission–Gramin (SBM–G),
                                                                   2.   e-NAM = Electronic National Agricultural Market.
NABARD has extended loans to the National Centre for
Drinking Water, Sanitation, and Quality during FY2019
and FY2020 towards part funding of central share for
construction of 3 crore household toilets.

    annual report 2020—21                                    100
You can also read