A Public Dataset for YouTube's Mobile Streaming Client
←
→
Page content transcription
If your browser does not render page correctly, please read the page content below
A Public Dataset for
                     YouTube’s Mobile Streaming Client
                        Theodoros Karagkioules∗† , Dimitrios Tsilimantos∗ , Stefan Valentin∗ ,
                Florian Wamser‡ , Bernd Zeidler‡ , Michael Seufert‡ , Frank Loh‡ and Phuoc Tran-Gia‡
                                      ∗ Paris
                                          Research Center, Huawei Technologies France
                                        † LTCI,
                                            Télécom ParisTech, Université Paris-Saclay
                                            ‡ University of Würzburg, Germany

                Email: firstname.lastname@{huawei.com∗ , telecom-paristech.fr† , informatik.uni-wuerzburg.de‡ }

   Abstract—Datasets are a valuable resource to analyze, model       and application layer. The data were generated with YouTube’s
and optimize network traffic. This paper describes a new public      native Android application on two Smartphone models, at two
dataset for YouTube’s popular video streaming client on mobile       locations in Europe, for over 5 months. Currently, 374 hours of
devices. At the moment, we are providing 374 hours of time-
synchronous measurements at the network, transport and appli-        curated data are available, of which about 25% are manually
cation layer from two controlled environments in Europe. After       labeled according to the buffer state of the player.
describing our experimental design in detail, we discuss how            At the application layer, we extracted a wide range of
to use our dataset for the analysis and optimization of HTTP         adaptive streaming parameters from YouTube’s mobile client.
Adaptive Streaming (HAS) traffic and point to specific use cases.    This was possible by our recently introduced Wrapper App
To assure reproducibility and for community benefit, we publish
the dataset at [1].                                                  [6], which allows remote control and monitoring of YouTube’s
                                                                     native Android application. The source code of our tool can
                         I. I NTRODUCTION                            be downloaded at [1] along with the dataset. At the transport
   Datasets for Internet traffic are more valuable than ever for     and network layer, we used the common tool tcpdump [11]
communication research. They provide important insight into          to record unfiltered packet logs on the Smartphones and a
network and application behavior, especially when covering           gateway. During our entire measurement period, YouTube
large-scale Internet services. One of such services is YouTube,      deployed QUIC, rather than Transmission Control Protocol
a video streaming platform that is generating more than 20%          (TCP), for transporting the streaming data. Consequently, most
of the mobile data traffic [2]. According to YouTube’s own           of the recorded logs refer to User Datagram Protocol (UDP)
statistics, its users are streaming a billion hours of video every   traffic.
day, with over half of these requests coming from mobile                Our aim is not to cover realistic yet loosely controlled
devices [3].                                                         scenarios, such as field tests in mobile networks. Instead, the
   Interestingly, the mobile use of YouTube’s service has            focus of our dataset is on the synchronous measurement at the
been only rarely covered by public datasets. Instead, most           network, transport and application layer in tightly controlled
available data were collected by using a personal computer           environments. To this end, we followed the guidelines of the
as a streaming device [4]. This, however, cannot provide             DASH Industry Forum [12] and designed a testbed that allows
representative measurements for mobile use, since YouTube’s          to control throughput, Packet Error Rate (PER), Round Trip
Web-player (running inside a Web-browser on a personal               Time (RTT), and streaming quality in real time. This high
computer) operates differently than its native application for       degree of control and its precise documentation allows to
mobile operation systems [5], [6]. Although YouTube fol-             reproduce our data as well as using it for traffic modeling
lows the Dynamic Adaptive Streaming over HTTP (DASH)                 and factor analysis.
standard [7] on both platforms, it employs different adaptive           Consequently, our dataset can be immediately applied to an-
streaming algorithms between the two [5]. On mobile devices,         alyze HAS traffic across multiple layers from the perspectives
YouTube also employs the Quick UDP Internet Connections              of packet management, Quality of Experience (QoE) factor
(QUIC) protocol [8] more often than on desktop devices,              analysis [13] and HTTP Adaptive Streaming (HAS) algorithm
according to [9] and to our observations from two separate           design. We will discuss further uses and point to ongoing
locations in Europe. The few public datasets that include            applications of our data below.
measurement of mobile clients [5], [10], however, merely                The remainder of the paper is structured as follows. Sec-
provide network traces. Since YouTube employs Transport              tion II documents our experimental setup and design, including
Layer Security (TLS) to encrypt application-layer information,       our Wrapper App. Our measurement procedures and measured
focusing on packet traces alone can only offer a limited view        variables are described in Section III. Section IV provides an
on the streaming process.                                            overview of the currently available data. Section V provides
   Our dataset aims to fill this gap by providing measurements       ongoing applications and further ideas for using our data and
that were simultaneously obtained at the network, transport          Section VI summarizes the paper.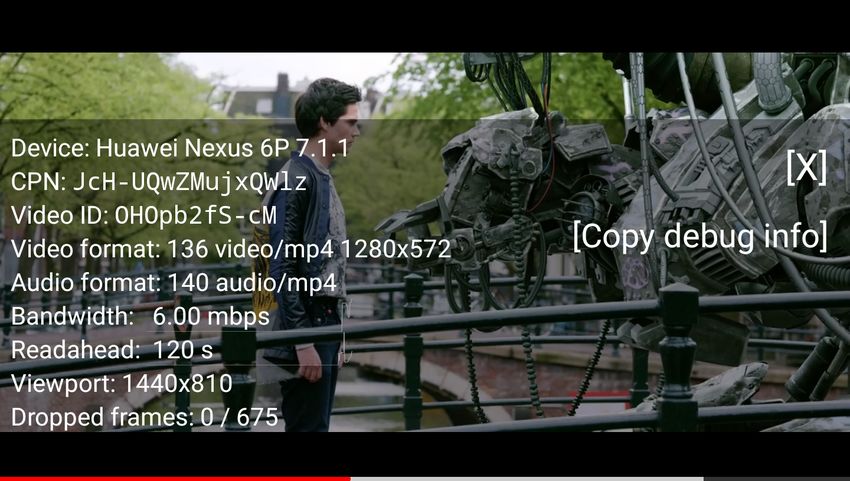
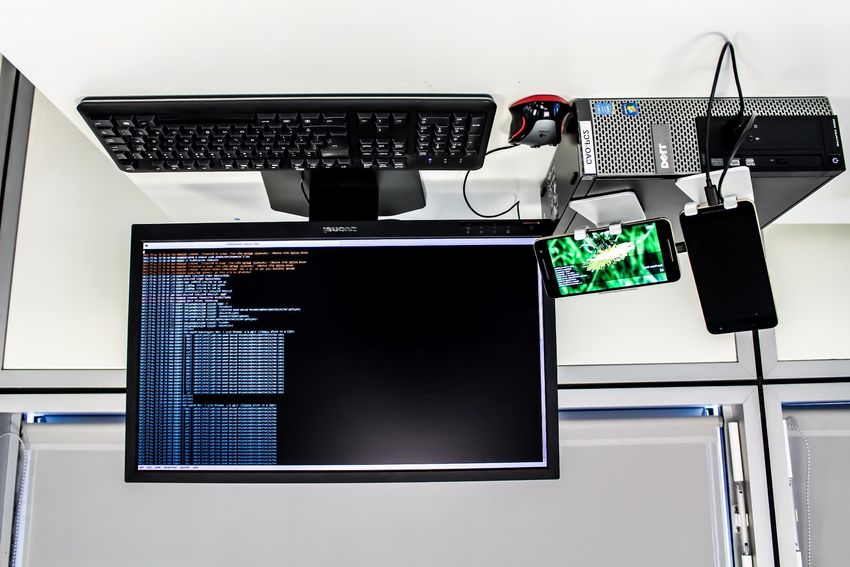
Linux machine and Smartphones          Linux machine
    connected via USB for ADB              1. Ethernet connection to Internet
    debugging and automatic control        2. WLAN access point for Smartphones
                                           3. Traffic configuration via the tc tool

                                                                                      Fig. 2: Screen-shot from the YouTube Android application
                                                                                      during measurement with stats for nerds
   Smartphone #1
   1. Native YouTube application
   2. Network packet logs via tcpdump         Smartphone #2
   3. Wrapper application for video info      Idle while Smartphone #1 is in use
                                                                                      the Linux kernel [15]. The scripts can automatically modify
Fig. 1: Hardware setup for regulated and automatic HAS traffic                        the above network parameters during an experiment at pre-
measurements                                                                          determined or random points in time, which allows to emulate
                                                                                      the dynamics of a mobile network in a reproducible manner.
                                                                                         In order to control and to extract application-layer infor-
                     II. E XPERIMENTAL DESIGN                                         mation we designed the Wrapper App [6] – a measurement
  In this section we describe the setup, scenarios, streaming                         tool for the native YouTube Android application. In principle,
content and location-specific differences for our experiments.                        our tool records application-layer information that is available
                                                                                      through the stats for nerds feature of YouTube’s Android
A. Setup                                                                              application. As shown in Figure 2, this feature offers the values
   Our experimental setup consists of off-the-shelf consumer                          of some streaming-related parameters and the option to copy
hardware, common tools for Linux and Android and cus-                                 them to other applications via the clipboard. The Wrapper App
tomized measurement software for Android and Linux. For                               accesses this information basically by executing touch-and-
the latter, we are using our Wrapper App [6] to extract video                         swipe events on the Smartphone, a process which is remote-
information and streaming statistics from YouTube’s Android                           controlled by the measurement scripts with the help of ADB.
player and control scripts to automatize the experiments.                             In addition, the Wrapper App uses Android’s User Interface
   The hardware setup is illustrated in Figure 1. A Linux                             (UI) automator [16] to access the video progress bar.
computer (Kernel 3.16.0-71-lowlatency) controls two Android                              These measurements are started and recorded periodically
Smartphones via Universal Serial Bus (USB) connections                                on the control computer. A measurement cycle is initialized by
using the Android Debug Bridge (ADB) [14]. The control                                a control script, which starts the Wrapper App. This tool then
computer is connected to the Internet via a T1 line and                               launches the YouTube application and configures it according
operates as an Internet-gateway and Wireless Local Area                               to the parameters in the scenario-specific configuration file
Network (WLAN) access point for the Smartphones. The                                  (e.g., deactivating auto-play, choosing a fixed quality). The
Smartphones perform video streaming via an IEEE 802.11g                               Wrapper App then starts the measurement by requesting the
WLAN link at a carrier frequency of 2412 MHz. Due to the                              specified video.
close distance between phones and access point, the average                              It is important to note that the Wrapper App records only
Signal-to-Interference-plus-Noise Ratio (SINR) was 23 dB,                             the mentioned application-layer measurements but no content
which provides the maximum physical layer rate of 54 Mbit/s.                          (such as video, image data and audio).
   The measurements are performed on the control computer
and on the Smartphones. On all the devices, network and                               B. Scenarios
transport-layer information is collected with tcpdump (ver-                              To reduce the experimental design space and to structure our
sion 4.7.4, libpcap version 1.7.4). On the Smartphones, the                           dataset, we define the 8 scenarios in Table I. More scenarios
native YouTube application (version 12.32.60) for Android                             can be easily defined in individual configuration files.
generated HAS traffic over UDP according to QUIC [8].                                    Beginning with the simpler scenarios, no traffic control
Although we consistently observed some TCP packets at the                             is performed in scenarios (s1) to (s3). Scenarios (s1) and
beginning of each session, all video streams were transported                         (s2) perform video streaming at a constant quality. In (s3)
via UDP/QUIC. We assume that the TCP connections were                                 a manual quality change is introduced at a random time in
used for tracking.                                                                    t0 ∈ [120, 240] s. This time window is chosen to be in the
   The setup allows to control the throughput, Internet Protocol                      middle of the video duration, which is specified in Table II,
(IP) packet delay and PER that are experienced by the Smart-                          to assure that the client can reach its target buffer level.
phones. This traffic control is done at the control computer                             In (s4) to (s8), various forms of traffic control are activated.
via Python scripts that adjust a Token Bucket Filter (TBF) in                         In (s4) a rate limitation at 500 kbit/s is configured, starting at
TABLE I: HAS scenarios TABLE II: Streaming content and video bit-rate statistics
(mean µ and standard deviation σ)
Scenario Quality Rate limit
s1 480p No Video Duration (s) Bit-rate (kbit/s)
s2 720p No 144p 240p 360p 480p 720p 1080p
0t
s3 720p−→480p No µ 107 240 346 715 1347 2426
TOS 734
t0 ∈ [120, 240] s σ 35 78 175 346 641 1152
0 t 1 t
s4 Auto No −→ 500 kbit/s −→ No µ 108 242 398 792 1566 3009
Nature 561
t0 ∈ [120, 240]s, t1 = t0 + 150 σ 48 109 231 424 794 1381
s5 Auto 1024 kbit/s µ 52 102 282 600 1156 2324
TalkShow 559
s6 Auto (see Figure 3) σ 29 54 137 267 492 919
120s t0
s7 Auto No −−→ 3000 kbit/s
100 kbit/s
t1
t0 = 160 + 85n, n ∈ N standard deviation σ of the encoding rate for each streamed
t1 = 205 + 85n, n ∈ N quality of the selected videos.
t0
s8 Auto No
100 kbit/s These videos represent different types of content. The movie
t1
t0 = {120, 300}s, t1 = {180, 380}s
Tears of Steel (TOS), with YouTube video ID is “OHOpb2fS-
cM” [18], contains a mixture of computer generated and
6
natural images in high motion. The clip is commonly used
for testing video codecs and recommended in DASH-IF’s
specification [12, Section 2.1]. As a second clip we chose
τ = 11, ǫ = 1
5 a nature documentary (Nature) [19] with YouTube video
ID “2d1VrCvdzbY”. This video consists of complex natural
Rate limit (Mbit/s)
τ = 13, ǫ = 1.25 scenes (e.g., clouds, trees and water surfaces). Finally, we
4
chose a talk-show (TalkShow) [20] as a low-motion clip with
YouTube video ID “N2sCbtodGMI”.
τ = 15, ǫ = 1.5
3 None of these videos is monetized, which prevents interrup-
tions through advertisements. TOS, TalkShow and Nature are
τ = 20, ǫ = 1.75 encoded at 24, 25 and 30 fps, respectively and are all available
2 at the horizontal resolutions {144p–1080p}. Each of these
τ = 25, ǫ = 2
qualities is available in two representations. First, as a H.264-
1
encoded stream of DASH segments in an MP4 container
0 100 200 300 400 500 600 and, second, as a VP9-encoded stream in a WebM container.
Time (s) YouTube’s streaming application automatically chooses the
Fig. 3: Traffic configuration of rate (Mbit/s), delay τ (ms) and format and indicates the chosen representation by an ‘itag’
PER (%) for (s6) according to DASH-IF guidelines field that is available in our dataset. The ‘itag’ index points
to a specific field in the DASH manifest file, from which the
content URL, format, URL, peak bitrate and other meta-data
a random time in the interval [120, 240] s with a total duration can be extracted according to the DASH specification [7].
of 150 s. In this scenario, we configure the YouTube client
to choose the streaming quality automatically according to its
D. Location-specific differences
built-in HAS policy. Scenario (s5) also allows video quality
adaptation but at a constant throughput limit of 1024 kbit/s. The measurements were performed at two locations in
Scenario (s6) implements a test case specified by the DASH Europe, i.e. Paris in France and Würzburg in Germany. While
Industry Forum (DASH-IF) in [12, Table 5] with quality the main setup, procedures and scenarios were identical, two
adaptation. The stepwise traffic control in this scenario is relevant differences between the setups were inevitable.
illustrated in Figure 3. Finally, (s7)-(s8) emulate cases with First, the performance of the T1 uplink to the Internet neces-
steep throughput drops to 100 kbps, where even the lowest sarily differed between Würzburg and Paris. While Würzburg’s
video quality is not supported. These scenarios allow to study uplink provided 30% higher average throughput, it also came
the behavior of adaptive streaming policies in the case of with a 26% higher average RTT. Our measurement results for
coverage loss due to shadowing or handover failures in mobile those links are summarized in Table III.
networks. The second difference was the used Smartphone model. In
Paris, two identical phones of the type Huawei Nexus 6P
C. Streaming content (Model H1512, baseband version: angler-03.78) were used
In order to provide data for representative videos, we chose alternately. Switching between these phones was necessary
3 clips whose average encoding rates correspond to the average since, despite line power and a deactivated display, the mea-
rates in [17, Table 4]. Table II provides the average µ and the surements depleted the battery of the active phone faster than itTABLE III: Mean µ and standard deviation σ for 10000 TABLE IV: Selection of recorded parameters relevant to HAS
measurements of RTT and 1954 measurements of throughput
Layer File identifier Parameter
TCPdump packet arrival time (s)
Location RTT (ms) Throughput (Mbit/s)
TCPdump packet source IP address
µ σ µ σ
Network TCPdump packet source port number
Paris 18.64 24.17 9.07 2.17
TCPdump packet destination IP address
Würzburg 25.19 34.41 13.01 4.63 TCPdump packet destination port number
TCPdump packet payload size (Bytes)
Transport
TCPdump packet transport protocol
could recharge. Using two phones allowed the inactive phone DNS query source IP address
to recharge in order to provide continuous experiments. In DNS query source port number
Würzburg, the Smartphone Google Pixel XL (Model marlin, DNS query destination IP address
baseband version: 8996-012511-1611190200) was used. This DNS query destination port number
Statistics “bh”: buffer level (ms)
device did not suffer from battery depletion, making multiple
Statistics video ID
phones unnecessary at this location. Note that both locations Application
Statistics “fmt”: video quality (itag)
used the same version of the Android operation system, i.e., Statistics “afmt”: audio quality (itag)
version 7.1.1 with the security patch from December 5th , 2016. Statistics “bwe”: bandwidth estim. (bit/s)
Although we observed no significant influence of these Video progress elapsed video time (s)
location-specific differences, the reader should be aware that Event log network configuration events
their effect was not systematically studied. Event log Video play-out events
III. DATA COLLECTION
the event log file. A selection of the recorded variables is
In this section, the measurement procedures at the network,
summarized in Table IV.
transport and application layer as well as the labeling process,
Our second method is to record information from Domain
are described in detail.
Name System (DNS)-queries that are initiated by the YouTube
A. Network and transport-layer information application. These data are recorded by tcpdump and saved in
the file DNS. This information allows to measure the initial
On the control computer and on the Android phones, we delay by calculating the time difference between the playback
use the traffic capturing tool tcpdump to record TCP, UDP start and the DNS initial request.
and IP information. Contrary to packet sniffing, we are using In order to illustrate some of the data that were recorded
tcpdump not to record payload but to log meta data from the from the YouTube application during a streaming session,
IP and UDP/TCP headers. For each packet that passes the Figure 4 plots the level of the play-out buffer in seconds (left
TCP/IP stack, we configure tcpdump to produce a new record y-axis and both ’itag’ lines) and the result of the bandwidth
in a log file that contains a timestamp and the fields “tos: type estimation (bwe) in Mbit/s over the session time. We observe
of service, ttl: time to live, id: IP ID, offset: fragment offset, that the adaptive streaming client initially chooses a quality
flags: fragmented diagram, proto: protocol type, length: packet of 720p (itag 136), which maintains the buffer level at around
length” and “source IP > destination IP: protocol, packet 120 s. After throughput throttling (t = 152 s), the play-out
length”. Packet length is given in bytes and the timestamp buffer leaves the steady state and starts depleting. YouTube’s
is in Unix epoch time (i.e. seconds after 00:00 UTC on 1 bandwidth estimation adjusts to this buffer depletion at t =
January 1970). Table IV shows the most relevant parameters. 208 s, leading to the selection of the 144p quality (itag 160)
Note that we apply no filter to tcpdump, which means that at t = 290 s. This drastic decrease in video quality allows
we are logging all IP packets in both directions (ingoing to quickly fill up the play-out buffer and, thus, avoids stalls.
as well as outgoing). Although all packet types are logged, After our control script has removed the throughput limit
YouTube’s Android client employed QUIC for streaming. at t = 303 s, YouTube’s bandwidth estimation recovers at
Thus, most of the recorded traces refer to UDP packets. t = 336 s and the client requests 720p-segments again.
B. Application-layer information C. Labels
We measure information at the application layer with two By analyzing the previous network and application logs,
methods. First, we use our YouTube Wrapper App to extract we are also able to distinguish different states of the play-
information from YouTube’s Android application itself. As out buffer. These states are fundamental for the behavior
described in Section II-A, our tool transfers information from of adaptive streaming clients and are, thus, useful to study
YouTube’s statistic module and the video progress bar to the and design HAS traffic. We identify the 4 different states
control computer. Video progress is recorded every 0.5 s in filling, steady, depleting and unclear. In the states filling
the file Video progress, while the statistics are also extracted or depleting, the client’s download rate is above or below
twice per second but stored in a file named Statistics. For the video bitrate, respectively. In the steady state, however,
each experiment, the Wrapper App logs its control events in the buffer level is approximately constant and the client’srate limit = 500kbps rate limit = 1Gbps 140
140 Unlabeled
720p 120 Filling
Buffer Occupancy (s)
144p Steady
120 100 Depleting
bwe
Bandwidth estimation (Mbps)
80
100
Buffer Occupancy (s)
60
40
80
14 20
60 12 0
10 0 100 200 300 400 500 600
Time (s)
40 8 100
6 Filling
Accumulated data (MB)
Steady
20 4 80 Depleting
2
0 0 60
0 100 200 300 400 500 600
Time (s) 40
Fig. 4: Example of data from Statistics and Event log files, 20
for video [20], under experiment scenario (s4).
0
0 100 200 300 400 500 600
Time (s)
download rate is approximately equal to the video bitrate [21, Fig. 5: Example of labeled streaming video [20], using the
Sec. 2.2]. Adaptive streaming clients aim to achieve the steady setup in Section II under experimental scenario (s4).
state by adapting video quality and segment request time.
Interested readers are referred to [21], [22] to learn more about
TABLE V: Number of total experiments and number of labeled
adaptive streaming algorithms and buffer states.
experiments in parentheses
We labeled the buffer states manually with the help of a
graphical user interface (GUI), that we developed for this Scenario Video
reason, which provides plots as in Figure 5. The top figure Nature TalkShow TOS All videos
shows the buffer level in seconds, as recorded in the Statistics s1 90 (21) 102 (33) 109 (32) 301 (86)
log file. The bottom figure displays the accumulated data over s2 86 (17) 97 (27) 108 (31) 291 (75)
time for the streaming data, as recorded in the TCPdump log s3 80 (18) 94 (27) 108 (32) 282 (77)
file. By inspecting these plots, the GUI allows a user to: s4 90 (25) 103 (35) 119 (41) 312 (101)
• plot accumulated data separately per packet flow, s5 63 (10) 82 (19) 102 (31) 247 (60)
• specify time intervals for independent label assignment, s6 86 (32) 107 (40) 120 (43) 313 (115)
• associate a label with a previously defined interval. s7 81 (11) 86 (6) 87 (6) 254 (23)
The result of this process is a separate log file with timestamps s8 69 (7) 65 (3) 67 (4) 201 (14)
and label values, that contains the string Labels in its name. Total number 645 (141) 736 (190) 820 (220 ) 2201 (551)
IV. DATASET Total time (h) 132 (29) 114 (30) 128 (34) 374 (93)
Let us now provide an overview to the structure and the
content of the dataset [1].
Using the setup and tools in Section II and the methodol- directory ./Paris/Scenario_1/Vid_2d1VrCvdzbY/
ogy in Section III, the data were recorded in Paris, France Iteration_1 contains the data of the first iteration of
and Würzburg, Germany, over the course of 5 months. The the Nature video according to scenario (s1) in Paris. Each
measurement campaign started on the 19th of September 2017 directory Iteration_$m contains the csv-files, named
and ended on the the 23rd of February 2018. according to the type of data {’Labels, ‘DNS’, ‘TCPdump’,
During this campaign, 2201 experiments were performed. ‘event log’, ‘Statistics’, ‘Video progress’}, as described
Each experiment is defined by its scenario index (s1 to s8), in Section III. Some file names also indicate the device
the video ID and the iteration index. Overall, 374 hours of {‘PC’, ‘Phone’}, as these measurements are simultaneously
streaming traffic were recorded, 25% of which are labeled. performed on the control computer (‘PC’) and on the
Table V provides the numbers of experiments per scenario Smartphone. Note that we, redundantly, add $Location, $n,
and number of labeled experiments in parentheses. $v and $m to the file names for simplicity and organization.
The data are provided as text files in UTF-8 character Within each file, every line starts with a Unix timestamp
encoding and csv-format. The directory structure is ./ [23], that is provided by the respective measurement device
$Location/Scenario_$n/Vid_$v/Iteration_$m, {‘PC’, ‘Phone’}. Although the devices were synchronized via
where Location = {’Paris’, ’Wurzburg’}, n = {1, 2, . . . , 8}, Network Time Protocol (NTP), we provide the file called
video ID v according to Section II-C and m = {1, 2, . . . , M } time log that contains both time references at the moment of
with iteration index M according to Table V. For example, the initiation of the measurement.V. A PPLICATIONS by YouTube’s native Android application and most of the
Our dataset provides time-synchronized measurements at recorded logs refer to QUIC and UDP traffic.
the ISO/OSI Layers 3, 4 and 7 in controlled scenarios. We are already using this dataset to analyze adaptive stream-
While these data may be used in various ways, let us now ing traffic and to design traffic managing functions for cellular
briefly point to specific applications for (i) designing adaptive networks [24]. We believe that publishing our data and tools
streaming clients, (ii) analyzing streaming traffic at packet will enable the research community to better understand how
level and (iii) estimating streaming parameters and quality. to model, manage and control adaptive streaming traffic.
First, our dataset allows to study and to reproduce how R EFERENCES
a popular adaptive streaming client reacts to variable link
[1] T. Karagkioules et al. (2018) A public dataset for YouTube’s
conditions. By mapping the scenario parameters from Table I mobile streaming client. Open dataset. [Online]. Available:
to the measures at Layer 7 (cp. Table IV) algorithm designers http://qoecube.informatik.uni-wuerzburg.de/
can analyze, for instance, the reaction time and video quality [2] Sandvine, “Global Internet phenomena: Latin America & North Amer-
ica,” Report, Jun. 2016.
of YouTube’s client depending on throughput, PER and delay. [3] YouTube. (2018) Youtube for press. [Online]. Available:
Since our measurement tools are publicly available [1], [6], https://www.youtube.com/yt/about/press/
researchers can even reproduce our testbed and compare the [4] S. Alcock et al. (2015) Analysis of YouTube application flow control.
Dataset. [Online]. Available: https://wand.net.nz/ salcock/youtube/
performance of their own bitrate adaptation algorithms against [5] A. Rao et al., “Network characteristics of video streaming traffic,” in
YouTube’s adaptive streaming policy. In the same manner, our Proc. ACM CoNEXT, Dec. 2011.
tcpdump-logs can be used to study and to improve the packet [6] M. Seufert et al., “A wrapper for automatic measurements with
YouTube’s native Android app,” in Proc. IEEE TMA, Jun. 2018.
generation of adaptive streaming clients compared to YouTube. [7] ISO/IEC, “Dynamic adaptive streaming over HTTP (DASH),” Interna-
Second, our dataset allows a detailed analysis of adaptive tional Standard 23009-1:2014, May 2014.
streaming traffic at Layer 3 and 4, depending on various [8] J. Roskind, “QUIC: Multiplexed stream transport over UDP,” Design
Document and Specification Rationale, Dec. 2013.
network and video-related factors. A good statistical under- [9] A. Langley et. al., “The quic transport protocol: Design and internet-
standing at the packet level is particularly relevant with the scale deployment,” in Proc. ACM SIGCOMM, Jun. 2017.
deployment of new transport protocols such as QUIC. Since [10] S. Sengupta et al. (2015) Crawdad dataset (v. 2015-11-26). Dataset.
[Online]. Available: https://crawdad.org/iitkgp/apptraffic/20151126/
the majority of our packet logs capture QUIC traffic, our data [11] The tcpdump group. (2015) tcpdump packet analyzer v. 4.7.4, (libpcap
help operators and vendors to customize their networks for v. 1.7.4). Manual page. [Online]. Available: http://www.tcpdump.org/
this new kind of traffic. One example of such customization is [12] DASH Industry Forum, “Guidelines for implementation: DASH-
AVC/264 test cases and vectors,” Report, Jan. 2014.
service classification based on packet arrival patterns, which [13] F. Wamser et al., “Modeling the YouTube stack: from packets to quality
we developed based on the presented dataset and described of experience,” Computer Networks, Apr. 2016.
in [24]. Such real-time classification systems can then be [14] developer.android.com. (2017) Android debugging tool (adb)-
Android SDK platform. Manual page. [Online]. Available:
used for streaming-specific billing and traffic shaping as in T- https://developer.android.com/studio/command-line/adb.html
Mobile’s Binge On [25] or to custom-tailor admission control [15] A. N. Kuznetsov. (2001) Linux traffic configuration tool (tc). Manual
and resource allocation [26] in cellular networks. page. [Online]. Available: https://linux.die.net/man/8/tc
[16] developer.android.com. (2017) Android UI automator-
Third, our dataset allows to estimate application-layer pa- Android SDK platform. Manual page. [Online]. Available:
rameters and quality, based on packet flows. In [27], we used https://developer.android.com/training/testing/ui-automator.html
a previous version of this dataset to estimate video encoding [17] C. Kreuzberger et al., “A comparative study of DASH representation
sets using real user characteristics,” in Proc. ACM NOSSDAV, 2016.
rate only by observing the size and arrival time of the related [18] Blender Foundation. (2013) Tears of steel. Video. [Online]. Available:
IP packets. Such simple mechanisms already provide sufficient https://www.youtube.com/watch?v=OHOpb2fS-cM
accuracy for adjusting resource allocation functions [26] and [19] National Institute of Fundamental Studies Sri Lanka. (2016)
Science copies nature’s secrets. Video. [Online]. Available:
for estimating QoE [13]. Similarly, our dataset can be used https://www.youtube.com/watch?v=2d1VrCvdzbY
to estimate further QoE factors such as initial buffering delay, [20] Zweites Deutsches Fernsehen. (2017) Heute show. Video. [Online].
adaptation frequency as well as stalling frequency and delay. Available: https://www.youtube.com/watch?v=N2sCbtodGMI
[21] T. Huang et al., “A buffer-based approach to rate adaptation: Evidence
VI. S UMMARY from a large streaming service,” in Proc. ACM SIGCOMM, Aug. 2014.
[22] K. Spiteri et al., “BOLA: near-optimal bitrate adaptation for online
We described our public [1] dataset for YouTube’s mobile videos,” in Proc. IEEE INFOCOM, Apr. 2016.
streaming client and the methods to reproduce it. [23] The Open Group, “IEEE standard for information technology - Portable
Operating System Interface (POSIX(R)),” IEEE Std 1003.1, 2004 Edi-
Our experimental setup allows to design controlled exper- tion The Open Group Technical Standard, Dec. 2008.
iments with automatic variation of network and streaming [24] D. Tsilimantos et al., “Classifying flows and buffer state for YouTube’s
parameters during a video session. Besides measuring network HTTP adaptive streaming service in mobile networks,” in Proc. ACM
MMSys, Jun. 2018.
statistics, streaming variables are extracted from YouTube’s [25] A. Molavi Kakhki et al., “BingeOn under the microscope: Understanding
native Android application. Our procedures support the test T-Mobile’s zero-rating implementation,” in Proc. ACM Internet-QoE,
cases of the DASH Industry Forum [12] and provide state Aug. 2016.
[26] D. Tsilimantos et al., “Anticipatory radio resource management for
labels for YouTube’s adaptive streaming logic. mobile video streaming with linear programming,” in Proc. IEEE ICC,
At the moment, our dataset offers 374 hours of synchronous May 2016.
measurements at the network, transport and application layer [27] D. Tsilimantos et al., “Traffic profiling for mobile video streaming,” in
Proc. IEEE ICC, May 2017.
in two controlled environments. All of these data are generatedYou can also read