Conclusive On-the-fly Validation of High-Level Functional Tests - Accemic
←
→
Page content transcription
If your browser does not render page correctly, please read the page content below

Conclusive On-the-fly Validation
                           of High-Level Functional Tests
                             Thomas B. Preußer                                          Alexander Weiss
                        Accemic Technologies GmbH                                 Accemic Technologies GmbH
                             Dresden, Germany                                       Kiefersfelden, Germany
                          tpreusser@accemic.com                                      aweiss@accemic.com

   Abstract—Structural testing is an important acceptance crite-           It is the live online analysis of execution trace data which
rion for safety-critical embedded and cyber-physical systems (as in     enables the non-intrusive continuous monitoring of test runs to
Aerospace, Transport, and Critical Infrastructure). The coverage        establish desired test properties. In order to be able to use this
of both all specified requirements and, vice versa, all code to be
deployed makes testing very difficult and costly. We elaborate on       technical option, high-bandwidth access to the trace data output
a solution that validates the conclusiveness of high-level functional   by the processor must be available, and adjustments must be
tests on fully-integrated safety-critical applications in a non-        made to the software architecture. This paper describes such a
intrusive fashion. Our approach performs an online analysis of          hardware solution and its corresponding testing workflow.
hardware processor trace data in real-time to establish coverage
proofs on-the-fly during test runs. It offers deep insights into the       The remainder of this paper will first motivate the increasing
completeness of both the tests and their underlying requirements.       demand for capable test procedures in Sec. II. Sec. III will
Establishing the validity of tests on a high functional level reduces   continue by giving an overview of the state of the art with
the effort enormously that is required on lower, less integrated        a strong focus on coverage metrics and their current dynamic
levels to achieve and justify conclusive coverage statements. The       measurement approaches. The proposed live analysis of the
savings achieved by our approach in the development process will
be demonstrated and quantified.                                         execution trace will be introduced in Sec. IV, which will name
   Index Terms—Processor Execution Trace, Online Monitoring,            the specific challenges this approach has to master and discuss
Structural Tests, Requirements-Based Tests                              the opportunities provided by this novel capability in detail with
                                                                        a strong focus on coverage measurements. Finally, Sec. V will
                       I. I NTRODUCTION                                 list the enabling design requirements that need to be considered
                                                                        in the architecture of a system platform that is to benefit from
   The continuously increasing complexity, even in the domains          the described opportunities before Sec. VI concludes the paper.
of safety-critical and cyberphysical systems, pushes the number
of defects, many of which are only observed after the release                                  II. M OTIVATION
of a product. Fighting this late and most costly manifestation
                                                                           Embedded systems are becoming increasingly powerful and
of defects, the use of more capable, thorough methods on
                                                                        complex. This is accompanied by the unpleasant fact that
higher test levels helps to establish and maintain economically
                                                                        the relative error probability of software increases with its
competitive and effective test procedures.
                                                                        complexity [1]: The more code, the disproportionately more
   Both the measurement of the structural test coverage and the         defects are initially present in the software and the worse is the
automated runtime analysis during the execution of functional           efficiency of error correction. With the increasing use of mul-
integration and system tests are powerful testing instruments.          ticore and networked multiprocessor systems as well as third-
Their associated requirement for comprehensive and continu-             party software components, more and more non-deterministic
ous system observability, however, poses difficult challenges.          error patterns, which are difficult to reproduce, are added.
Classic software instrumentation manipulates the application            Assuming an error correction ratio of about 95% during the
under test, heavily impacting its timing behavior so that the           development process [1], a proud 5% of defects remain in
confidence in the test is reduced or the test itself becomes            the release code - in absolute numbers, this can mean several
unfeasible on higher test levels. Solutions based on hardware           thousand defects. Nobody has to be ashamed of this, even
execution traces can avoid the massively intrusive instrumen-           NASA has this problem during their missions [2].
tation of the tested application. However, they are currently
limited to snapshots over short time spans. This harshly limits              McKinsey & Company 2018 [3]:
their capability to derive conclusive statements about tests                 “Snowballing complexity is causing significant
executed on higher, more integrated levels.                                  software-related quality issues, as evidenced by mil-
                                                                             lions of recent vehicle recalls.”
              This project has received funding from the European          These errors range from errors in the requirements spec-
              Union’s Horizon 2020 research and innovation programme
              under grant agreement No. 732016.                         ification over trivial implementation defects all the way to

                                                                                                               www.embedded-world.eu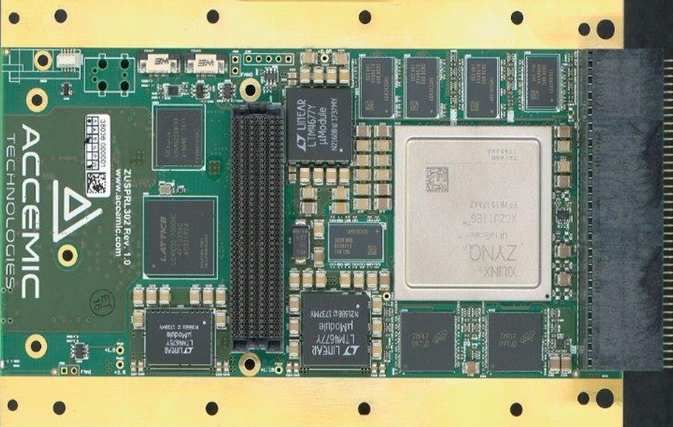
complex, non-deterministic error patterns. Due to missing or          have already been exercised by the execution of HLTs, it is no
overly simplified models, static analysis quickly reaches its         longer necessary to generate and document the corresponding
limits, so that the dynamic analysis of embedded systems              tests on the module test level for the purpose of a test coverage
becomes increasingly important.                                       proof.
   The freedom from defects is an illusion although this ideal           The dynamic measurement of the coupling of data and con-
should be the goal of any serious project management (not             trol flow provides another powerful test completeness criterion.
only) in the embedded area. In addition to a well-thought-out         For each variable, the test must show that it is initialized and
system architecture and good implementation, (a) tests that are       later used (def-use pair). Just as the structural control flow
as complete as possible and (b) precautions for dealing with          coverage provides a statement about the completeness of tests
errors in the field are important prerequisites for being able to     on the control flow level, a similar statement can thus be
develop and market a product on time and in the best possible         achieved for the data flow.
quality.
                                                                      B. Software Instrumentation
                    III. S TATE OF THE A RT                             Software instrumentation adds code to the application that
A. Structural Coverage Criteria                                       logs the execution of the program during a test or a debug
                                                                      run. The program code can be instrumented automatically by
   The standards for the development of safety-critical sys-          using off-the-shelf tools. However, integration and system tests,
tems, such as DO-178C [4] and ISO 26262:2018 [5], define              which examine the interaction of components, lose their validity
concrete requirements for the test process, the test techniques       and confidence as they are based on an altered application with
to be applied and the proof of the completeness of these              a different memory layout and a changed temporal behavior
tests (structural coverage). Depending on the criticality of the      during execution.
application, it must be demonstrated as completely as possible
that all instructions (statement coverage), all branches (branch      C. Offline Analysis of Embedded Trace
coverage) or all relevant combinations of conditions (MC/DC)
                                                                         Almost all modern processors have a standardized embedded
were used during the tests. The standards leave it largely open,
                                                                      trace unit (e.g. ARM® CoreSight [7], Intel® Processor Trace
on which test level the measurement of structural coverage are
                                                                      [8], Infineon ED [9], NXP QorIQ® [10]). This unit outputs in-
performed.
                                                                      formation about the executed program flow without influencing
   In addition, there is a structural test criterion, data flow       it. Depending on the architecture and trace configuration, the
coverage and the analysis of the coupling of data and control         temporal behavior and data accesses can also be reconstructed.
flow, which has been largely neglected up to now [6]. Although        In addition, further units can support a lightweight hardware-
these test criteria are only dealt with in passing and not            supported instrumentation (which is therefore acceptable in
very specifical in various standards, they appear to us to be         release code) as well as the tracing of peripheral units (memory
an essential supplement to the measurement of control flow            controllers, communication units [11]).
coverage.                                                                In classic embedded trace solutions, the high-bandwidth trace
   In current practice, the proof of structural coverage is usually   data (several Gbit/s) is usually stored in a buffer memory. After
provided by means of ”hand-tailored” functional tests on the          the end of the test run, the program flow is reconstructed on
module test level. This is often accepted as proof for the test       a PC to determine, for example, the structural coverage. The
completeness as required by the standards. However, structural        limits of this procedure are the observation time, which is
tests should not serve the purpose of being able to hand over         constrained by the available buffer memory, and the additional
impressive reports to the certification authorities but should        computing time required for the offline reconstruction of the
demonstrate the completeness of the conducted functional tests        program flow.
so as to raise test confidence and enable an effective hunt for          Although the concrete trace protocols of different processor
the many defects still present in the system.                         architectures differ, they always convey all the information that
   Therefore, we advocate (a) the measurement of structural test      is necessary for the reconstruction of the program control flow.
coverage during the execution of integration and system tests
and (b) the measurement of the coupling of data and control                    IV. L IVE A NALYSIS OF E MBEDDED T RACE
flow.                                                                 A. Challenges
   The measurement of structural test coverage during the
execution of higher-level (functional) tests (HLT) has the great         The live analysis of the execution trace at run time is a
advantage that an exact statement about the completeness of           quantum leap enhancement over the offline analysis of the
these tests can be made. For non-executed program code, it            recorded trace data as it effectively eliminates the bottlenecks
must be determined why it has not been reached by the test. In        imposed by the need for the intermediate buffering. However,
some cases, one will come to the conclusion that this code can        there are two major technical challenges to be overcome:
only be checked on module test level but regularly, also HLT            1) The highly compressed trace data stream must be de-
gaps will be revealed. Since large parts of the program code               compressed and the control flow of the CPU(s) must be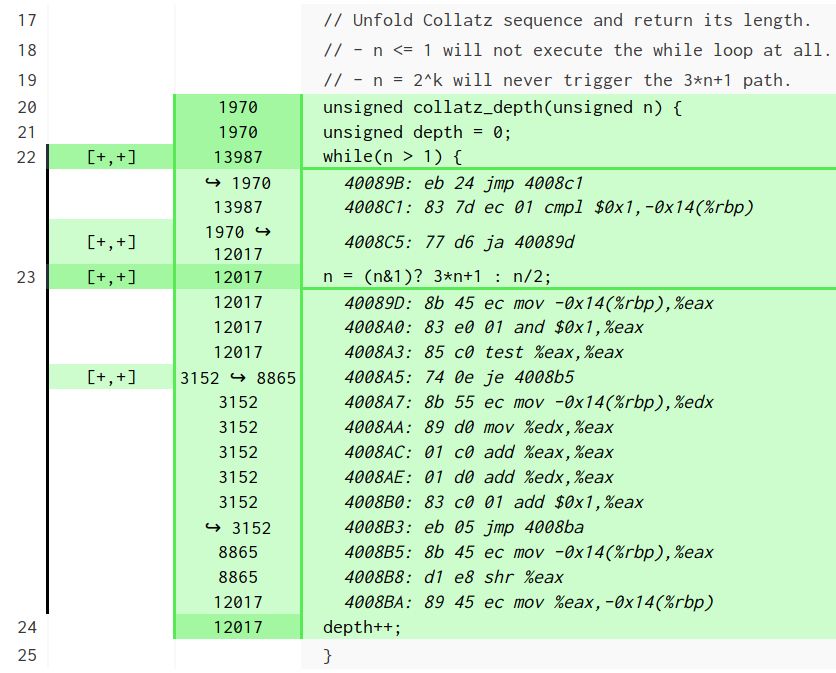
DuT (ARM® Cortex®-A, Intel® Atom®,
         Infineon AurixTM,                                                                  CEDARtools® Hardware Pla�orm
         QorIQ® P- and T-series)                                                           (FPGA Board)

                                               Trace Buffer and Concentrator

                                                                                                                                                           Post processing
             Periphery          Instr / Data
               trace     CPU0      Trace                                                    high-speed     Trace Data

                                                                              Trace Port
                                                                                               serial    Pre-processing
                Per      CPU1   Instr / Data                                                                                            Branch    Branch                        Object code
                                   Trace                                                                      and            Branches
                                                                                                                                        Counter   counts                         coverage
                                Instr / Data
                                                                                              Debug       Control Flow
               Mem       CPU2      Trace                                                      Server     Reconstruc�on
                                Instr / Data
               Mem       CPUn      Trace

                             Binary                                                                       Configura�on

                                                                                                                                                           Mapping
                                                                                                                                                                                Source code
                                                                                                                                                                                 coverage
          Source Code      Compiler                                                                       Debug informa�on

                                                        Fig. 1. Overview of the Live Structural Coverage Measurement Flow

     reconstructed. This demanding computation must often                                                        hardware platform decompresses this trace on the fly, re-
     cope with the execution trace from multiple fast CPUs                                                       constructs the application control flow in real time and logs
     that are running at nominal clock frequencies above                                                         sufficient execution data for a conclusive labeling of the
     1 GHz. This decoding may further be challenged by                                                           application’s control flow graph with respect to the desired
     additional abstractions and indirections introduced by                                                      coverage criteria. The bulk of this data comprises branch
     different operating systems.                                                                                execution counters. Depending on the particular architecture
  2) The reconstructed control flow must be analyzed into an                                                     and execution environments, statistics about other control-flow-
     apt event stream abstraction that is suitable to drive the                                                  changing events, such as timer interrupts or task switches, may
     desired of various possible backend task. For example,                                                      have to be included for a consistent final picture. Observe that
     (a) branch information for the coverage analysis may be                                                     this object code coverage can be measured plainly on the basis
     recorded or (b) dynamic properties over the event stream                                                    of the executed binary. The presentation of the obtained results
     may be computed and validated against a temporal logic                                                      can be refined by the backannotation to the application sources
     specification.                                                                                              as long as these sources are available and the compiler has
   The live analysis of trace data over arbitrarily long program                                                 produced debug information along with the executable.
runs enables (a) the measurement of the control flow coverage                                                       Fig. 2 depicts an example of such an annotated HTML
during the execution of HLTs, as well as (b) the dynamic                                                         coverage report. It shows the C source code lines, which
constraints monitoring, which can be used to validate (b1) the                                                   can be optionally expanded into their corresponding assembly
correct coupling of the data and control flow as well as (b2)                                                    statements. Each line is prefixed by its observed execution
the runtime behavior of an application.                                                                          count. For branches, this count is differentiated into the number
                                                                                                                 of sequential continuations and the number of taken control
B. Coverage Measurements                                                                                         flow changes. The latter appears behind an arrow symbol and
   As discussed in detail by the Certification Authorities Soft-                                                 is, in fact, the only figure in the case of unconditional branches
ware Team (CAST) [12], measuring the structural coverage on                                                      and function calls. Conditional branches are further annotated
the object code level provides different information than the                                                    by a plus-minus pair indicating whether they have ever been
measurement on the source code level. By evaluating the debug                                                    observed being taken and not taken during the test. In order to
information generated by the compiler, the measured object                                                       improve the visual perception, failures to meet coverage criteria
code coverage can be backannotated to provide a source code                                                      are color-coded.
level view on the obtained coverage data.                                                                           Additionally, a (typically partial) control flow graph anno-
   The corresponding overall workflow is illustrated in Fig. 1.                                                  tated with the measured coverage data may be produced to
The target device under test (DuT) is a microprocessor execut-                                                   understand the structure of a test. An example is depicted in
ing regularly compiled, native code. This execution is moni-                                                     Fig. 3. Implied sequential control flow is largely pruned. It
tored via the platform-specific trace port. The CEDARtools®                                                      is, however, identified as blue edges from conditional branch

                                                                                                                                                                             www.embedded-world.eu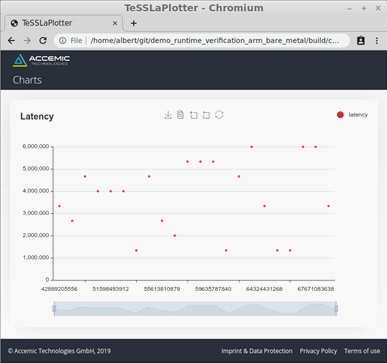
OBLIVION

                                                                                                                     8911        67       670 8911       670                  1

                                                                                            x400870               x4008CC                                                               x4008C5

                                                                                             8911                   67       x400904             x40087F          x4008EA                670          4087

                                                                                                            x4008DE              670                                 670                              x40089D

                                                                              x40087A                                67                                           x4008FF         x4008CB                    4087

                                                                                                                  x400918                                8911          670                            x4008A5

                                                                                        x400861                       737                                            x40088D                   4757          1072   3015

                                                                                                                  x40091E               9581                                670                       x4008B3        x4008B5

                                                                       8911        8911                             670                x400883          x400881       x40089B                                1072   3015

                                                                                            18492         x4008E0           67                     9581 8911                  670 670                 x4008BA

                                                                              x40086B                       670                                       x400886                                         4087

                                                                                   8911               x4008E5                                            18492                              x4008C1

                                                                                                    670                     x400922                   x40088C

                                                                                  x400851                                                        67      18492
      Fig. 2. Coverage Data Backannotated into Source-Code View
                                                                                                                                                  OBLIVION

nodes and other code points that have happened to be branch
                                                                        Fig. 3. (Partial) Control Flow Graph Annotated with Coverage Data
destinations. Branching control flows, on the other hand, are
depicted in green.
   The implemented coverage measurement is capable of live
consistent data snapshots in the middle of executing tests.          test qualification is working on object rather than source, it
Hence, also the coverage progress across a test can be moni-         is agnostic to the choice of source code language. The cost
tored as a meta metric. The node highlighted in the graph of         of migrating between programming languages or even using
Fig. 3 is the point of the execution observed by the depicted        different ones within one project is greatly reduced. Language
snapshot. This can be easily verified by comparing the total in-     choices are no longer dictated by legacy but can be made
and out-degrees of the edges terminating in this node.               flexibly selecting the best fit for each individual given task.
   Due to the non-intrusive continuous measurement, this ap-            The trace-based coverage measurement allows shifting much
proach can be used to conveniently measure the code coverage         weight away from module up to integration and system tests
during integration and system tests. This allows an exact            as it scales painlessly. It, thus, allows to deliver the coverage-
statement about the completeness of these tests. In addition,        based test qualification on the level of or close to the original
the effort for the development and documentation of structural       system requirements specification. The effort to derive and
tests on the module test level can be reduced significantly if the   validate decomposed lower-level test specifications is reduced
test coverage for the corresponding code segments is already         to corner cases that cannot be triggered on a higher integration
proven on a higher test level.                                       level. More importantly, the comprehensive high-level coverage
   Measuring the coverage directly on the deployed and exe-          measurement provides an immediate feedback to the quality
cuted object code has numerous benefits with respect to the          of the tests on the respective test level. It reveals incomplete
confidence in the validity of the derived quality claims. Most       requirements specifications and incomplete functional tests. A
of all, the compiler is removed from the coverage interpretation     strong incentive to enhance the high-level tests is created as it
as it is now based on the control flow produced by the compiler      allows to avoid walking down and up the underlying hierarchy
rather than on the control of the source code provided to the        levels.
compiler. Secondly, not relying on software instrumentation             The main drawback of working on the object-code level
eliminates its inherent dilemma of either (a) bearing the cost of    is that the traceability of results back to the source code
added instrumentation code in its productive deployment or (b)       may be difficult. This, at least, requires the used compiler to
deploying a more efficient, uninstrumented but hence altered         emit debug information along with the generated object code.
code base in the field. Both of these options are undesirable.       Difficulties in the result interpretation may be introduced by
The engineering choice is made on the bases of assumed               aggressive compiler optimizations, which may make it harder
criticality. Trace-based coverage certification removes the need     to understand why a coverage criterion is missed at a certain
for this trade-off between cost and safety altogether.               point of the test. Closely related to this issue is also our ongoing
  Beyond these hard safety-related benefits, many aspects of         work on the reliable tracking of the individual flags contribution
engineering a system are simplified. As the coverage-based           to a multi-condition.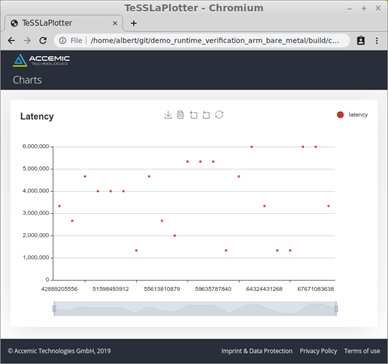
Connected to CEDAR System.
7.1165ms: latency = 4662878 (6.9943ms)
7.1165ms: test_passed = 0
1014.11ms: latency = 5328400 (7.9926ms)
DuT (ARM® Cortex®-A, Intel® Atom®, 1014.11ms: test_passed = 0
Infineon AurixTM, CEDARtools® Elements
2019.10ms: latency = 3996424 (5.9946ms)
2019.10ms: test_passed = 0
3028.09ms: latency = 6660375 (9.9905ms)
QorIQ® P- and T-series) 3028.09ms: test_passed = 0
Trace Buffer and Concentrator
4031.09ms: latency = 2664410 (3.9966ms)
4031.09ms: test_passed = 1
COEMS Hardware Pla�orm (FPGA Board) 5032.09ms: latency = 1332398 (1.9985ms)
5032.09ms: test_passed = 1
STM/ PFT/
CPU0
Transmission
ITM ETM Trace Data Log
Trace Port
Pre-processing
PFT/ Event Stream Test Server
Per CPU1 ETM and Events Report
Analysis (GAMMA V)
Control Flow
PFT/ Reconstruc�on
Mem CPU2 ETM
live Chart
PFT/
Mem CPUn ETM
Observa�on
Configura�on
Monitor
instruc�on address of
activate_brakes Configura�on
Binary instruc�on address of
read_brake_sensor
Object code,
C-Compiler Analyser TeSSLa Compiler
debug symbols
Observa�on Monitor Specifica�on
C-Code Specifica�on (in TeSSLa language)
Specs Front End
void run_task()
{
float brake_angle = read_brake_sensor(); in read_brake_sensor : Events[Unit]
in activate_brakes : Events[Unit]
int strength;
strength = calculate_brake_strengh_for_angle(brake_angle); def latency : Events[Int] := calc_latency(stimulus = read_brake_sensor,
response = activate_brakes)
int motor_control;
motor_control = calculate_motor_control_value(strength); # Check if event chain took less than 5ms (3.333.333 CPU cycles)
def test_passed : Events[Bool] := if (latency < 3333333) then true else false
Hundreds of high-level specifica�ons
if (motor_control == 1) {
activate_brakes(); out latency
can be monitored in parallel
} out test_passed
else if (motor_control == -1) {
release_brakes(); # domain specific library
} def calc_latency[A,B](stimulus: Events[A], response: Events[B])
} := { return time(response) - last(time(stimulus), response)}
Source code TeSSLa specifica�on
Fig. 4. Overview of the Runtime Verification Flow
C. Runtime Verification the coverage measurement flow. Only within the FPGA, the
coverage statistics unit is replaced by a programmable event
Runtime verification is another use case of the online exe- stream analysis. Its configuration is compiled from a TeSSLa
cution trace analysis. It establishes a powerful tool for testing specification, an additional input to the workflow. It describes
and troubleshooting complex systems. During the continuous the monitoring task, the properties to compute and outputs to
reconstruction of the control flow, it is possible to mark certain emit from the consumed control flow events.
instruction addresses. When these instructions are executed,
elements are inserted into the emitted event stream, which V. D ESIGNING C USTOM P LATFORMS FOR T ESTABILITY
can then be examined online for specified temporal properties. Responsible project planning must meet certain precautions
The event processing units used can be configured in the to ensure the comprehensive observability for test and debug
high-level language TeSSLa [13], [14] and a large number of purposes. This implies for the architecture of the designated
temporal properties can be monitored in parallel. The TeSSLa system platform:
macro support also enables the easy adoption of industry
standards like the AUTOSAR Timing Extension (TIMEX) [15] • The trace interface must be accessible. For Intel® proces-
or AMALTHEA [16] to describe temporal behavior. sors, the corresponding USB port should be available; for
other architectures, the access to the corresponding trace
The CEDARtools® solution leverages event processing units interfaces (mostly Aurora or parallel) must be considered
that execute low-level TeSSLa operators natively. So, they in the hardware design. Short-sighted cost savings at this
are merely re-programmed for a given monitoring task. A point may tremendously complicate the critical system in-
time-consuming, application-specific synthesis of FPGA logic tegration and debugging and, consequently, even endanger
structures is not required. Thus, a change of the high-level the success of the project.
property description can be applied to a trace data stream within • The initialization of the trace interface must be ensured.
seconds. This is done either during the startup routine or by external
The overall workflow of the dynamic runtime verfication access to the corresponding control registers (for example,
is illustrated in Fig. 4. The physical hardware setup matches via JTAG). For both options, the consequences for the
www.embedded-world.eusafety and/or security architecture must be considered R EFERENCES
carefully. [1] C. Jones and O. Bonsignour, The Economics of Software Quality.
• Since many processor architectures only provide a limited Addison-Wesley, 2011.
data trace, further observability requirements should be [2] M. Grottke, A. P. Nikora, and K. S. Trivedi, “An empirical investigation of
fault types in space mission system software,” in IEEE/IFIP International
considered. This may, for example, result in leveraging Conference on Dependable Systems and Networks (DSN), 2010, p.
hardware-supported instrumentation (e.g. Intel® Processor 447–456.
Trace [8] PTWrite instructions, NXP QorIQ® [11] Data [3] Burkacky, J. Deichmann, G. Doll, and C. Knochenhauer, Rethinking Car
Software and Electronics Architecture. McKinsey, Feb. 2018.
Acquisition Messages) or in mapping relevant variables to [4] “DO-178C: Software considerations in airborne systems and equipment
designated memory areas that are observable by the data certification,” RTCA, Dec. 2011.
trace. [5] “ISO 26262:2018: Road vehicles – functional safety,” International Orga-
nization for Standardization, 2018.
[6] “ED-12C: Software considerations in airborne systems and equipment
VI. C ONCLUSIONS certification,” EUROCAE, 2011.
[7] “CoreSight™ architecture specification v2.0 ARM IHI 0029B,” ARM
This paper has descibed an innovative approach that exploits Ltd., 2013.
execution trace data for the online monitoring of embedded [8] “Intel® 64 and IA-32 architectures software developer’s manual,” Intel
processors for the on-the-fly system analysis. As a promising Corporation, 2016.
[9] “TC29/7/6/3x ED Emulation devices target specification,” Infineon Tech-
use case for this capability, the coverage measurement of nologies AG, 2013.
long-running integration and system tests has been proposed [10] “IEEE-ISTO 5001TM-2012: The Nexus 5001 forum - standard for a
and its numerous benefits have been described. The dynamic global embedded processor debug interface,” IEEE-ISTO, Jun. 2012.
[11] “P4080 advanced QorIQ debug and performance monitoring reference
verification of runtime properties has been suggested as an- manual, Rev. F,” Freescale Semiconductor, Inc., 2012.
other possible use case. The requirements for system platform [12] “Position paper CAST-17: Structural coverage of object code,” FAA
designs to enable the leveraging of the described benefits have Certification Authorities Software Team (CAST), Jun. 2003.
[13] L. Convent, S. Hungerecker, M. Leucker, T. Scheffel, M. Schmitz, and
been given. D. Thoma, “TeSSLa: Temporal stream-based specification language,” in
Formal Methods: Foundations and Applications, T. Massoni and M. R.
Mousavi, Eds. Cham: Springer International Publishing, 2018, pp. 144–
162.
[14] “TeSSLa: Temporal stream-based specification language,” Universität zu
Lübeck. [Online]. Available: https://www.tessla.io/
[15] “AUTOSAR-TIMEX: Specification of timing extensions,” AUTOSAR.
[Online]. Available: http://www.autosar.org/
[16] “AMALTHEA - An open platform project for embedded multicore
systems.” [Online]. Available: http://www.amalthea-project.org/You can also read