PRANA: AN R PACKAGE TO CALCULATE AND VISUALIZE ENGLAND NHS PRIMARY CARE PRESCRIBING DATA
←
→
Page content transcription
If your browser does not render page correctly, please read the page content below
PrAna: An R package to calculate and visualize England NHS
primary care prescribing data
Kishore Kumar Jagadeesan ( jkkishore85@gmail.com )
University of Bath https://orcid.org/0000-0003-0916-256X
James Grant
University of Bath Department of Chemistry
Sue Griffin
NHS Bath and North East Somerset CCG: NHS Bath and North East Somerset Clinical Commissioning Group
Ruth Barden
Wessex Water
Barbara Kasprzyk-Hordern
University of Bath Department of Chemistry
Software
Keywords: Prescription data, Health Informatics, R, Pharmaceuticals, Prescription, R Package
Posted Date: May 10th, 2021
DOI: https://doi.org/10.21203/rs.3.rs-499597/v1
License: This work is licensed under a Creative Commons Attribution 4.0 International License. Read Full License
Page 1/18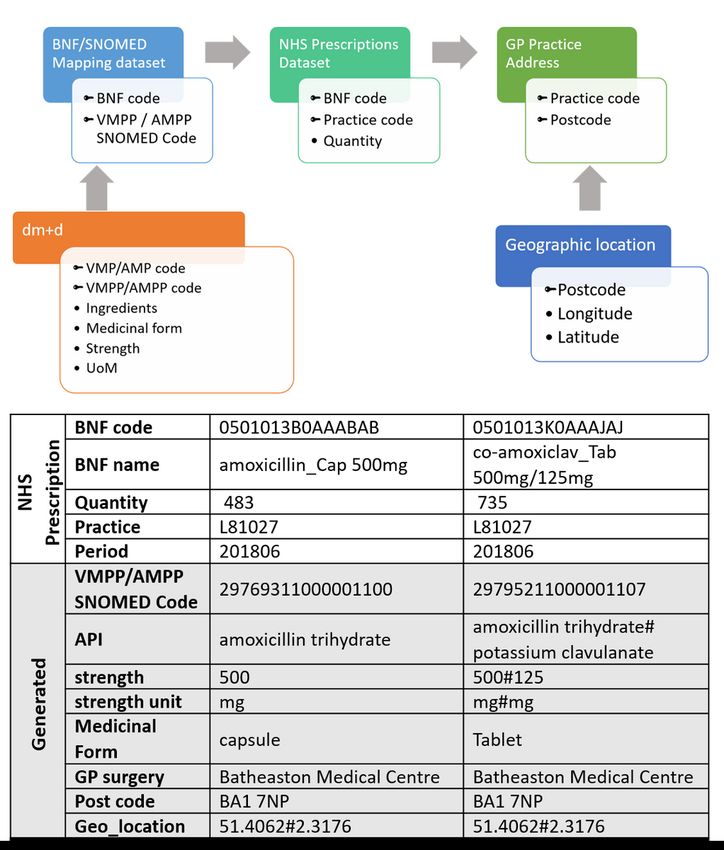
Abstract
Background
The objective of this work to calculate prescribed quantity of an active pharmaceutical ingredient (API) in prescription
medications for human use, to facilitate research on the prediction of amount of API released to the environment and create an
open-data tool to facilitate spatiotemporal and long-term prescription trends for wider usage.

Design
We have developed an R package, PrAna to calculate the prescribed quantity (in kg) of an APIs by postcode using England’s
national level prescription data provided by National Health Service, for the years 2015–2018. Datasets generated using Prana
can be visualized in a real-time interactive web-based tool, PrAnaViz to explore spatiotemporal and long-term trends. The
visualisations can be customised by selecting month, year, API, and region.

Results
PrAnaViz’s targeted API approach is demonstrated with the visualisation of prescribed quantities of 14 APIs in the Bath and
North East Somerset (BANES) region during 2018. Once the APIs list is loaded, the back end retrieves relevant data and
populates the graphs based on user-defined data features in real-time. These plots include the prescribed quantity of APIs over
a year, by month, and individual API by month, general practice, postcode, and medicinal form. The non-targeted API approach
is demonstrated with the visualisation of clarithromycin prescribed quantities at different postcodes in the BANES region.

Conclusion
PrAna and PrAnaViz enables the analysis of spatio-temporal and long-term trends with prescribed quantities of different APIs
by postcode. This can be used as a support tool for policymakers, academics and researchers in public healthcare, and
environmental scientist to monitor different group of pharmaceuticals emitted to the environment and for prospective risk
assessment of pharmaceuticals in the environment.

1. Introduction:
During the last decade a wide range of pharmaceuticals have been identified and quantified in the aquatic environment across
several countries and their impacts on exposed environmental species[1–4] and humans[5] have been reported. However,
currently it is not feasible to monitor all the pharmaceuticals released into the aquatic environment due to analytical feasibility
and monetary limitations[6]. Recently, several procedures have been established to predict the total amount of pharmaceuticals
emitted to the environment for risk assessment of pharmaceuticals in water by public authorities in both Europe[7, 8] and the
United States[9]. These guidelines describe how to evaluate the risk of the pharmaceuticals in the environment, based on
human pharmaceutical consumption, ecotoxicity of these pharmaceuticals[10] and their removal during wastewater treatment
[11], where human pharmaceutical consumption plays a vital role[12].

In addition to its role in the prediction of environmental concentration in water, spatiotemporal data of human pharmaceutical
consumption combined with other data could be used to explore and predict public health[13], for example, (i) prescription data
for short-acting β2-agonists, and respiratory related prescribing could be used as a predictor for respiratory mortality and/or air
pollution health effects[14–16], (ii) antibiotic prescription data could be used as a predictor to measure antimicrobial resistance
in the community[17–19], (iii) reduction in the number of antidepressant prescriptions can be linked with an increase in the
urban green space[20, 21], (iv) opioids prescription monitoring could be used to assess community mental health[22, 23].

                                                             Page 2/18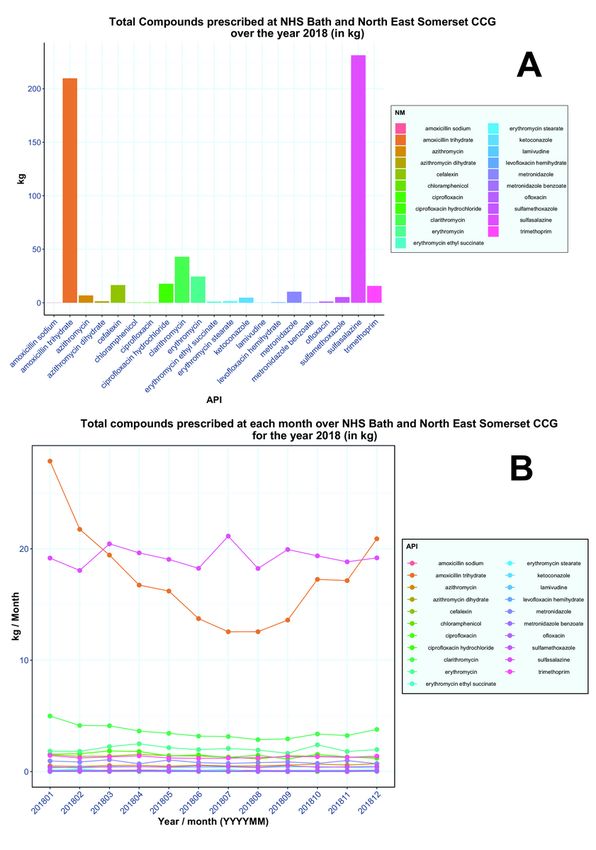
Despite its importance in environmental risk assessment and support in predicting public health, estimation of the human
pharmaceutical consumption or the total manufactured amount is difficult. In those countries where the data is publicly
available, it is complex and not straight-forward to handle. In the UK, since December 2011, the National Health Service (NHS)
has made national prescription data publicly available at general practice (GP) level, reporting the item counts, quantity and
cost of prescriptions aggregated by British National Formulary (BNF) code[13].

National prescription data from the NHS dataset typically contains over 10 million records per month, but the volume of data is
not only the challenge since the dataset cannot be used for the direct calculation of the consumption levels of different
pharmaceutical drugs. We need to use BNF code and SNOMED code[24, 25] to identify the actual pharmaceutical ingredients
and contents together with prescribed quantities to calculate the actual amount of each component dispensed. Open
Prescribing provides some tools for data exploration for national level spatiotemporal trends for different pharmaceutical drugs
using NHS prescription data[26]. However, these tools report used item counts for the drug volume, which has limitations[27], as
it does not take the actual dosage or total amount of consumption of pharmaceuticals, which is crucial for the total amount of
pharmaceuticals emitted to the environment.

In this article, we present PrAna, an R[28] package to aggregate and estimate the total prescribed quantity of active
pharmaceutical ingredients (APIs) in prescription medications for human use in the UK. The PrAna package is complemented
by a user-friendly interactive tool, PrAnaViz, developed using R/Shiny framework, where user can explore and visualise the
spatiotemporal trends of the total prescribed quantity of APIs and can download the results in various data formats for their
further studies.

2. Methods:
2.1 Data sources:

2.1.1 NHS Prescription and practices location datasets:

Monthly national level prescribing datasets for the years 2015 to 2018 were downloaded from NHS Digital[29]. CCG names and
codes and CCG geographic boundaries, GP practices geographical location were downloaded from NHS Digital[30] and Office
for National Statistics data portal[31] used under the terms of the Open Government Licence. NHS prescription datasets contain
dispensed prescriptions from general practitioners and other non-medical prescribers (such as nurses, pharmacists,
optometrists, chiropodists and potentially radiographers) but does not cover private prescriptions. Each dataset has more than
10000 rows, with each row representing a prescription, containing information on the dispensed practice code, British National
Formulary (BNF) code, BNF Name, number of items prescribed, net ingredient cost, actual cost, quantity, and period as in Table
1.

As we are interested in calculating the total quantity of an individual active pharmaceutical ingredient (API), the whole dataset
needs to be evaluated for each API. The columns BNF code and BNF name could help us in the normalisation, as they carry the
information regarding the API. The BNF code is a 15-digit code unique for each formulation, dose and product combination.
Together with the quantity prescribed, we use this to identify the amount of each API dispensed with each prescription.'

2.1.2 BNF / SNOMED Mapping Data

The BNF code in the 2015 to 2018 annual NHS prescription datasets uses the legacy Master Data Replacement (MDR) drug
database[29]. We map these BNF codes to individual API with BNF/SNOMED mapping data (Table 2) provided by the NHS
Business Services Authority (BSA) on June 2018[24], BNF/SNOMED mapping data map legacy MDR drug database and the
Dictionary of Medicines and Devices (dm+d)[32]. Once we have mapped each BNF in the dataset to its APIs we can evaluate the
quantities prescribed in the NHS prescription dataset.

2.1.3 Data aggregation

                                                            Page 3/18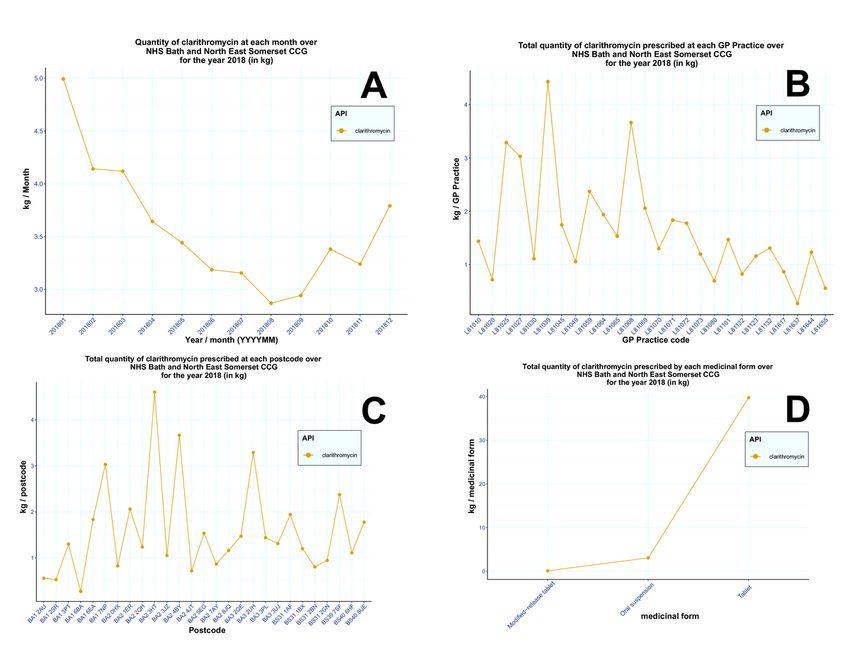
First step to quantify an individual API from NHS prescription dataset is to map ‘VMPP/AMPP SNOMED’ code in the BNF
SNOMED mapping dataset to an individual chemical substance. To achieve this, ‘VMPP/AMPP SNOMED’ code in the BNF
SNOMED mapping dataset was matched to the Actual Medicinal Product (AMP) and those without matching AMP were
matched to Virtual Medicinal Product (VMP) with help of dm+d files. In some cases, ‘VMPP/AMPP SNOMED’ code was
matched to Virtual Medicinal Product Pack (VMPP) or Actual Medicinal Product Pack (AMPP). Once the ‘VMPP/AMPP
SNOMED’ codes were mapped to VMP/AMP or VMPP/AMPP, the later helps to match the former to individual chemical
substance. This mapping also enables to identify the medicinal form (e.g., tablet, capsule, solution for injection, etc.,), strength
with its unit of measurement (e.g., mg, ng, µg, etc.,).

For example, consider amoxicillin 500mg capsules, with our method we have managed to find 50 unique ‘VMPP/AMPP
SNOMED’ codes for this and it is matching to 1 unique BNF code, 4 VMPPs, 28 AMPs with 52 AMPPs. For this example, we
have identified API as amoxicillin (as amoxicillin trihydrate), medicinal form as capsules, strength as 500 mg and four different
pack levels 15 capsules, 28 capsules, 100 capsules and 21 capsules respectively, from 28 different manufacturers.

Our method also helps to differentiate API from the formulations containing more than one API, for example, consider co-
amoxiclav 500mg/125mg tablets, with our method we have managed to find 24 unique ‘VMPP/AMPP SNOMED’ codes for this
and it is matching to 1 unique BNF code, 2 VMPPs, 23 AMPs with 24 AMPPs. For this example, we have identified APIs as
amoxicillin (as amoxicillin trihydrate) and clavulanic acid (as potassium clavulanate) with strength 500 mg and 125 mg
respectively, medicinal form as tablet, and two different pack levels 21 tablets and 100 cap tablets respectively, from 26
different manufacturers.

In the second step, the ‘BNF code’ from the dataset generated as above, was matched to the BNF code in the NHS prescription
dataset. This enables to identify individual API, along with information on its medicinal form, strength, and its unit of
measurement for each row in the NHS prescription dataset.

After the identification of API and its strength, the dataset is grouped by individual API, by GP practice code and ultimately by
postcode and the total prescription quantity for individual API was calculated for each GP practice code and postcode. We have
used ‘Quantity’ from the NHS prescription dataset to measure total prescription quantity. Postcode and geographical
coordinates were linked to the dataset by matching the GP practice code from the dataset downloaded from NHS Digital and
Office for National Statistics data portal. The whole process is summarised below in Figure 1. Full methodology for this
complete matching process is available in the technical documentation online[33].

2.2 PrAna – an R package implementation

PrAna is an R package providing a comprehensive workflow including data preparation, data conversion, data visualisation and
the ability to export/download the generated plots and data, as outlined in the Table 3. The package is now available from
https://github.com/PrAnaViz/PrAna under an MIT license and we are in the process of uploading it in the Comprehensive R
Archive Network (CRAN). Deploying the PrAna requires R version 3.5 or greater and a small number of package dependencies,
detailed instructions can be found in the online documentation[33].

2.2.1 PrAna Installation

Several functions wrapped in the PrAna package utilised in the workflow, we recommend using RStudio to install PrAna, to keep
directories specific to a single ′ Rproj. Since the code is published on GitHub, it can be installed using dev → ols. With
dev → ols installed you can download and install the latest version of 'PrAna' in the R console with

                (     z
∈ stall github PrAnaVi rAna” .
                      P               )
2.2.2 Data Preparation

                                                             Page 4/18
It is strongly suggested to setup the destination folder as the working directory using setwd() function. csv2dat() function is
used to combine several monthly NHS prescription dataset files, downloaded from NHS digital[29] into a single data table. For
example, if the user wants to combine all the monthly prescription dataset downloaded in the "C:/Datasets/Prescription
Datasets/2018/PDPI" location to a destination folder “C:/Datasets/2018”, following commands need to be executed in the R
console.
importdmd() function is used to import different extracted dm+d files[32] and return multiple data objects including a data table
which map each BNF code to its corresponding API(s), strength and medicinal form. Recommended to read the documentation
of importdmd() function to know more regarding the different data objects it generate[33].
## Read the extracted dm+d files
2.2.3 Data normalisation and conversion
The final step in the data conversion is to use practice_wise() to generate the prescription dataset mapped with the individual
API, prescription quantity, medicinal form, and strength for the defined GP practice(s).. The practice_wise() function require
following six parameters, as demonstrated in the example below,
Combined NHS prescription dataset, generated using csv2dat()
A character vector containing GP Practices.
A data table containing BNF Code mapped to individual APIs, strength, medicinal form.
Unit of measurement with multiplication factors file
Different medicinal forms with its corresponding codes file
Different APIs with its corresponding codes file
Page 5/182.2.4. Database service
As a result of the large datasets, to run PrAnaViz we recommend uploading the processed dataset to a local or a remote
database service, for example, MySQL, and link it to the PrAnaViz. More information on the linking databases to PrAnaViz is
explained in our technical documentation online.
2.3. PrAnaViz – an interactive data analysis tool
We developed an interactive tool PrAnaViz to visualise, explore and export different spatiotemporal prescription trends for wider
use using the GP specific prescription data generated using PrAna package. Created using R/Shiny, PrAnaViz, uses a web-based
interactive dashboard layout that most users are familiar with from common websites and web-based tools.
To launch PrAnaViz run the following command in your R Console:
> library(PrAna)
> PrAna::runShiny("PrAnaViz")
The PrAna::runShiny("PrAnaViz") function will pop-up the PrAnaViz tool which will allow you to explore different spatiotemporal
and long-term prescription trends with the sample dataset.
The basis of PrAnaViz functionality is that any user can explore prescribing trends broken down by chemical substance, and to
explore and visualise the variation in prescribing at region, postcode, and individual GP practice level, where both the overall
trends and the relative contribution from each API, medicinal form can be seen. PrAnaViz contains two different dashboards
tabs: (1) Targeted API approach in which a user can input their target(s), i.e., API(s) of interest and calculate, visualise, and
Page 6/18explore total prescribed quantity of targeted API(s) in a selected region, (2) Non-targeted API approach where the user can select
an individual API and visualise total prescribed quantity of that API at resolutions down to individual postcodes.
Users can input API target(s) of interest as a comma separated value (.csv) file, for the targeted API approach and can input the
connection strings to connect their databases to the PrAnaViz. Detailed instructions on the input options are available in the
supporting information and online tutorial documentation for PrAnaViz[33]. Users can export the graphs as a publication ready
Encapsulated PostScript (.eps) file or Portable Network Graphics (.png) or Portable Document Format (.pdf) file and
corresponding datasets as a .csv file according to selection criteria defined by the user to carry out their own analyses. The
Figures (Figure 2, 3 and 4) used in the article are generated using PrAnaViz.
2. Results:
3.1 PrAna
We extracted the available monthly prescription dataset from January 2015 to December 2018 and mapped it to the prescribed
general practices and by postcode. And the data generated will be in comma separate value (.csv) files dedicated to each
general practice with file name corresponding to the GP code, we obtained the GP code from NHS Digital[30] and geographical
coordinates to the postcodes from Office for National Statistics data portal[31]. This mapping also enables to identify the
medicinal form (e.g., tablet, capsule, solution for injection, etc.,), strength with its unit of measurement (e.g., mg, ng, µg, etc.,),
packing level information and manufacturer information. We then excluded compounds related to medical devices/appliances,
bath additives, washes, foams, shampoos, sprays, multivitamin capsules, and tablets for our analysis.
3.2 PrAnaViz:
Information on prescribing quantity of different APIs in a particular year and a year-long trend of an API are interesting for
various applications including community health monitoring[23, 34-36], environmental monitoring[37, 38], policy
interventions[39], and environmental and water quality management[21, 40, 41]. This tool can facilitate research in these
aspects and in the identification of most prescribed API in particular region or in a practice and able to identify the variation
across the prescription of API over a period or region or practice. For example, Figure 2A shows the annual prescription (in
kg/year) of 15 APIs corresponding to antibiotics group in Bath and North East Somerset CCG region in 2018 and shows that
amoxicillin (209.76 kg/year) and sulfasalazine (231.29 kg/year) are the most prescribed in the group at selected condition, but
when comparing the same group of APIs in month wise prescription (in kg/month) Figure 2B shows that like amoxicillin and
clarithromycin, shows the higher prescription rate in winter comparing to summer, but sulfasalazine prescription is same
throughout the year, with an average of 19.2 kg/month and standard deviation of 0.88 kg/month. Apart from the prescription
trends for the whole region variation across the tool helps to monitor individual API prescription by month (Figure 3A), by
individual GP level (Figure 3B), by individual postcode level (Figure 3C) and medicinal form for the selected CCG region (Figure
3D) over the selected year.
The second dashboard in PrAnaViz generates spatiotemporal trends for an API. It helps to compare prescription quantity of an
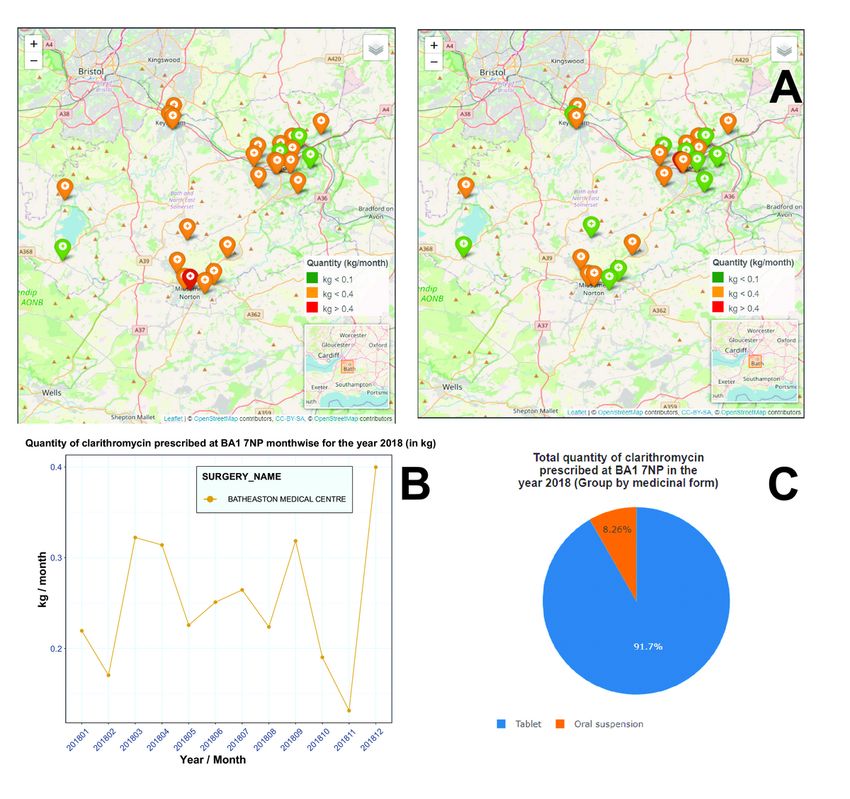
API by individual postcode level in a selected region over a period and it helps to generate annual trends. For example, as shown
in Figure 4A, prescription quantity of clarithromycin in January 2018 at an individual postcode levels in the Bath and North East
Somerset CCG region, 77% of the practices in that postcodes prescribed more than 0.1 kg/month; while the top 17% in that
prescribed more than 0.35 kg/month, For comparison, the prescription of more than 0.1 kg/month of clarithromycin at the
practices in these postcodes for the month June 2018 decreased to 47%; while only one GP practice prescribed more than 0.35
kg/month in that period.
The tool also visualises the annual trends of clarithromycin at an individual postcode (for example, BA1 7NP in Figure 4B) with
an information about the corresponding GP practices at the postcode as presented in Figure 4B. Different presentation level of
the prescribed API, such as tablet, capsule, oral form with corresponding prescribed percentage can be visualised with PrAnaViz,
for example, Figure 4C shows the percentage of clarithromycin prescription by different medicinal forms and by individual
postcode BA1 7NP for the selected year.
Page 7/184. Discussion:
4.1. Summary
We have developed an R package, PrAna to calculate prescribed quantity (in kg) of an APIs by postcode using England’s
national level prescription data provided by National Health Service, for the years 2015–2018. There were 27848 unique BNF
codes identified in the compiled prescription datasets, after excluding compounds related to medical devices/appliances, bath
additives, washes, foams, shampoos, sprays, multivitamin capsules, and tablets, these were matched to 97% of the BNF codes
generated. We have also created PrAnaViz, an in-built visualisation tool within the R package where user can explore
spatiotemporal trends in prescription of an API or group of APIs. This tool helps to understand the GP practice level and
postcode level variation of the prescribed drug in the selected CCG region, with resolution to each month and different medicinal
forms. The tool also enables to download the generated dataset in comma separated value (.csv) files and publication ready
images.
4.2. Strength and Limitations
The R package enables to process annual data for the whole of England’s prescription data for the years 2015–2018, not a
sample. The tool successfully calculated the quantity of APIs prescribed in several presentation levels such as tablets, capsules,
oral form. We have used ‘Quantity’ from the NHS prescription dataset to measure total prescription quantity. The major
limitations with the calculations are (1) the data used for the calculations are monthly time resolution and there is a delay in the
release of the data, (2) the people registered in the GP practices not always present in the same postcode and there is
percentage of difference when the prescription is mapped to the postcode. We have developed PrAnaViz, a free, openly
accessible, in-built interactive tool to visualise and analyse PrAna generated dataset in real-time. PrAnaViz facilitates wider use
with spatiotemporal and long-term trends. The tool enables to calculate and visualise prescription quantity (in kg) per postcode,
medicinal form, and GP practice. Users can also download the produced graphs as a publication ready images or a dataset to
carry out their own analyses.
We have installed a demo version of this tool as web application with limited data and it is publicly available to get feedback
and to monitor user volume. The tool is under continuous development.
5. Conclusion:
We have developed an R package, PrAna, incorporated with a method to aggregate and normalise NHS prescription dataset to
calculate total prescription quantity for an individual API specified to a postcode or GP practice. We have also successfully
calculated the total prescription quantity for England for the year 2015 to 2018. Apart from the R package, we have also
developed a standalone, comprehensive, PrAnaViz, with the generated dataset to analyse, visualise, and explore prescription
data. With its spatio-temporal prescribing trends of different APIs including resolution to postcode and GP Practices, PrAna and
PrAnaViz, can be used as a support tool for policymakers, academics, and researchers in public healthcare, and by
environmental scientists to monitor different group of pharmaceuticals emitted to the environment and for prospective risk
assessment of pharmaceuticals in the environment.
Abbreviations
AMP: Actual Medicinal Product
AMPP: Actual Medicinal Product Pack
API: active pharmaceutical ingredient
BANES: Bath and North East Somerset
BNF: British National Formulary
Page 8/18BSA: Business Services Authority
CCG: Clinical commissioning group
CRAN: Comprehensive R Archive Network
dm+d: Dictionary of Medicines and Devices
GP: general practice
MDR: Master Data Replacement
NHS: National Health Service
SNOMED: Systematized Nomenclature of Medicine
UK: United Kingdom
VMP: Virtual Medicinal Product
VMPP: Virtual Medicinal Product Pack
Declarations
Availability and requirements
Project name: PrAna
Project home page: https://github.com/PrAnaViz/PrAna.
Operating system(s): Platform independent
Programming language: R
Other requirements: R packages: shiny, leaflet, ggplot2, dplyr, lubridate, zoo, tidyr, reshape2
Licence: MIT License
Any restrictions to use by non-academics: N/A
Availability of data and materials:
The source code, manuals and sample data are available for download from the GitHub repository
https://github.com/PrAnaViz/PrAna.
Author Contributions:
KJ Conceptualization, Investigation, Writing – source code, Design – methods & dashboard, Developed the R package,
Manuscript – original draft, Manuscript – review & editing, Web server development, Writing – package documentation &
tutorials. JG Web server setup & development, Manuscript – review & editing. SG Prescribing process, NHS database assistance,
Manuscript – review & editing. RB Provided valuable feedback to improve the software, Manuscript – review & editing, Funding
acquisition. BKH Conceptualization, Manuscript – review & editing, Supervision, Project administration, Funding acquisition. All
authors read and approved the final manuscript.
Acknowledgments:
Page 9/18Authors acknowledge the exceptional work of the R Development Core Team, Shiny and authors of R community contributed
packages.
Funding:
This work was supported by the Wastewater Fingerprinting for Public Health Assessment (ENTRUST) project funded by Wessex
Water Services Ltd and EPSRC IAA (grant no. EP/R51164X/1, ENTRUST IAA).
Competing interests
The authors declare that they have no known competing financial interests or personal relationships that could have appeared
to influence the work reported in this paper.
Ethics approval and consent to participate.
This study uses publicly available data and no individual level data. It therefore does not require ethical approval.
Consent for publication
Not applicable.
References
1. Coetsier CM, Spinelli S, Lin L, Roig B, Touraud E. Discharge of pharmaceutical products (PPs) through a conventional
biological sewage treatment plant: MECs vs PECs? Environ Int. 2009;35(5):787–92.
2. Cleuvers M. Aquatic ecotoxicity of pharmaceuticals including the assessment of combination effects. Toxicol Lett.
2003;142(3):185–94.
3. Fent K, Weston AA, Caminada D. Ecotoxicology of human pharmaceuticals. Aquat Toxicol. 2006;76(2):122–59.
4. Crane M, Watts C, Boucard T. Chronic aquatic environmental risks from exposure to human pharmaceuticals. Science of
The Total Environment. 2006;367(1):23–41.
5. Webb S, Ternes T, Gibert M, Olejniczak K. Indirect human exposure to pharmaceuticals via drinking water. Toxicol Lett.
2003;142(3):157–67.
6. Morasch B, Bonvin F, Reiser H, Grandjean D, de Alencastro LF, Perazzolo C, Chèvre N, Kohn T. Occurrence and fate of
micropollutants in the Vidy Bay of Lake Geneva, Switzerland. Part II: Micropollutant removal between wastewater and raw
drinking water. Environ Toxicol Chem. 2010;29(8):1658–68.
7. (EMA) EMA. Guideline On The Environmental Risk Assessment Of Medicinal Products For Human Use
EMEA/CHMP/SWP/4447/00 corr 2. In.: Committee for Medicinal Products for Human Use (CHMP); 2006. pp. 1–12.
8. (EMA) EMA. Environmental risk assessment of medicinal products for human use draft EMEA/CHMP/SWP/4447/00 Rev.
1. In: 15/11/2018 edn. Committee for Medicinal Products for Human Use (CHMP); 2018. pp. 1–48.
9. Administration USFaD. Guidance for industry: Environmental assessment of human drug and biologics applications. CMC
6. Revision 1. In. United States Food and Drug Administration; 1998.
10. Besse J-P, Kausch-Barreto C, Garric J. Exposure Assessment of Pharmaceuticals and Their Metabolites in the Aquatic
Environment: Application to the French Situation and Preliminary Prioritization. Human Ecological Risk Assessment: An
International Journal. 2008;14(4):665–95.
11. ECB ECB. Technical guidance document on risk assessment: Part II. In.: Institute for Health and Consumer Protection; 2003.
12. Perazzolo C, Morasch B, Kohn T, Magnet A, Thonney D, Chèvre N. Occurrence and fate of micropollutants in the Vidy Bay of
Lake Geneva, Switzerland. Part I: Priority list for environmental risk assessment of pharmaceuticals. Environ Toxicol Chem.
2010;29(8):1649–57.
Page 10/1813. Rowlingson B, Lawson E, Taylor B, Diggle PJ. Mapping English GP prescribing data: a tool for monitoring health-service
inequalities. BMJ open. 2013;3(1):e001363.
14. Laurent O, Pedrono G, Filleul L, Segala C, Lefranc A, Schillinger C, Riviere E, Bard D. Influence of socioeconomic deprivation
on the relation between air pollution and beta-agonist sales for asthma. Chest. 2009;135(3):717–23.
15. Sofianopoulou E, Rushton SP, Diggle PJ, Pless-Mulloli T. Association between respiratory prescribing, air pollution and
deprivation, in primary health care. J Public Health. 2013;35(4):502–9.
16. Vegni FE, Castelli B, Auxilia F, Wilkinson P. Air pollution and respiratory drug use in the city of Como, Italy. Eur J Epidemiol.
2005;20(4):351–8.
17. Costelloe C, Metcalfe C, Lovering A, Mant D, Hay AD. Effect of antibiotic prescribing in primary care on antimicrobial
resistance in individual patients: systematic review and meta-analysis. BMJ. 2010;340:c2096.
18. Li Y, Mölter A, Palin V, Belmonte M, Sperrin M, Ashcroft DM, White A, Welfare W, Van Staa T. Relationship between
prescribing of antibiotics and other medicines in primary care: A cross-sectional study. Br J Gen Pract. 2019;69(678):E42–
51.
19. Singer AC, Xu Q, Keller VDJ. Translating antibiotic prescribing into antibiotic resistance in the environment: A hazard
characterisation case study. PLoS One. 2019;14(9):e0221568.
20. Taylor MS, Wheeler BW, White MP, Economou T, Osborne NJ. Research note: Urban street tree density and antidepressant
prescription rates—A cross-sectional study in London, UK. Landscape Urban Planning. 2015;136:174–9.
21. Helbich M, Klein N, Roberts H, Hagedoorn P, Groenewegen PP. More green space is related to less antidepressant
prescription rates in the Netherlands: A Bayesian geoadditive quantile regression approach. Environ Res. 2018;166:290–7.
22. Curtis HJ, Croker R, Walker AJ, Richards GC, Quinlan J, Goldacre B. Opioid prescribing trends and geographical variation in
England, 1998–2018: a retrospective database study. The Lancet Psychiatry. 2019;6(2):140–50.
23. Katz N, Panas L, Kim M, Audet AD, Bilansky A, Eadie J, Kreiner P, Paillard FC, Thomas C, Carrow G. Usefulness of
prescription monitoring programs for surveillance—analysis of Schedule II opioid prescription data in Massachusetts,
1996–2006. Pharmacoepidemiology and Drug Safety 2010, 19(2):115–123.
24. BNF SNOMED mapping | NHSBSA [https://.
25. Shahpori R, Doig C: Systematized Nomenclature of Medicine–Clinical Terms direction and its implications on critical care.
Journal of Critical Care 2010, 25(2):364.e361-364.e369.
26. Curtis HJ, Goldacre B. OpenPrescribing: normalised data and software tool to research trends in English NHS primary care
prescribing 1998–2016. BMJ Open 2018, 8(2):e019921.
27. Bogle SM, Harris CM. Measuring prescribing: the shortcomings of the item. BMJ. 1994;308(6929):637–40.
28. Team RC. (2013) R: A Language and Environment for Statistical Computing. R Foundation for Statistical Computing:
Vienna 2009.
29. https://www.nhsbsa.nhs.uk/prescription-data/prescribing-data.
30. GP and GP practice related data [https://digital.nhs.uk/organisation-data-service/data-downloads/gp-data].
31. Open Geography portal | Geoportal.statistics.gov.uk. http://geoportal.statistics.gov.uk./.
32. Dictionary of medicines and devices (dm + d) | NHSBSA [https://.
33. PrAna - to aggregate and normalise England’s national level prescription data. http://pranaviz.bath.ac.uk/.
34. Ilyas S, Moncrieff J. Trends in prescriptions and costs of drugs for mental disorders in England, 1998–2010. Br J
Psychiatry. 2012;200(5):393–8.
35. Walker AJ, Curtis HJ, Goldacre B, Mahtani KR. Time trends and geographical variation in prescribing of antibiotics in
England 1998–2017. J Antimicrob Chemother. 2018;74(1):242–50.
36. Mitchell AL, Hickey B, Hickey JL, Pearce SHS. Trends in thyroid hormone prescribing and consumption in the UK. BMC
Public Health. 2009;9(1):132.
Page 11/1837. Kasprzyk-Hordern B, Proctor K, Jagadeesan K, Lopardo L, O'Daly KJ, Standerwick R, Barden R. Estimation of community-
wide multi-chemical exposure via water-based chemical mining: Key research gaps drawn from a comprehensive multi-
biomarker multi-city dataset. Environ Int. 2021;147:106331.
38. Rice J, Kannan AM, Castrignanò E, Jagadeesan K, Kasprzyk-Hordern B. Wastewater-based epidemiology combined with
local prescription analysis as a tool for temporalmonitoring of drugs trends - A UK perspective. Science of The Total
Environment. 2020;735:139433.
39. Croker R, Smyth D, Walker AJ, Goldacre B. The clinician impact and financial cost to the NHS of litigation over pregabalin: a
cohort study in English primary care. BMJ Open. 2018;8(6):e022416.
40. Courtier A, Cadiere A, Roig B. Human pharmaceuticals: Why and how to reduce their presence in the environment. Current
Opinion in Green Sustainable Chemistry. 2019;15:77–82.
41. Kümmerer K. The presence of pharmaceuticals in the environment due to human use – present knowledge and future
challenges. J Environ Manage. 2009;90(8):2354–66.
Tables
Table 1: NHS Prescription dataset with description for each column
SHA PCT PRACTICE BNF CODE BNF NAME ITEMS NIC ACT QUANTITY PERIOD
COST
Q44 RTV Y04937 0304010W0BBABAL Phenergan_Tab 3 8.15 7.89 98 201801
25mg
Q44 RTV Y04937 0401010Z0AAAAAA Zopiclone_Tab 7 2.88 3.35 98 201801
7.5mg
Q44 RTV Y04937 0401020K0AAAHAH Diazepam_Tab 5 3.76 3.94 191 201801
2mg
Q44 RTV Y04937 0402010ADAAAAAA Aripiprazole_Tab 3 13.64 12.88 63 201801
10mg
Q44 RTV Y04937 0402010ADAAADAD Aripiprazole_Tab 1 1.36 1.37 7 201801
5mg
Column Description
SHA from April 2013 onwards, this code refers to Area Team
PCT from April 2013 onwards, this code refers to Clinical Commissioning Group (CCG) code
PRACTICE GP Practice code
BNF CODE Unique identifier to show what is prescribed
BNF describes the formulation and strength as well as the drug’s brand or generic (product) name
NAME
ITEMS Number of prescription items dispensed
NIC the drug tariff price in pounds and pence, which may be subject to further charges and/or discounts
ACT COST Actual cost - pounds and pence
QUANTITY Quantity represents the quantity of a drug dispensed, with units of measurement
(units/tablets/grams/millilitres, etc.,) dependent on its formulation
PERIOD Prescribed year and month
Page 12/18Table 2: BNF SNOMED Mapping - June 2018
BNF Code VMPP / AMPP SNOMED Code MDR: Product Description
'0501050B0BEAAAE '18149311000001103 Clarie XL_Tab 500mg
'0501050B0BEAAAE '18149411000001105 Clarie XL_Tab 500mg
'0501050B0AAACAC '34751711000001107 Clarithromycin_I/V Inf 500mg Vl
'0501050B0AAACAC '13469811000001104 Clarithromycin_I/V Inf 500mg Vl
'0501050B0AAACAC '17997811000001100 Clarithromycin_I/V Inf 500mg Vl
'0501050B0AAACAC '13613011000001105 Clarithromycin_I/V Inf 500mg Vl
Table 3: PrAna Workflow
Workflow Description
Data Download monthly NHS prescription datasets and Dictionary of medicines and devices release files
Preparation (dm+d).
Data Aggregation and conversion of the locally stored datasets into practice wise dataset achieved using the
Conversion functions in PrAna.
Data Visualise and analyse the processed dataset using the in-built ShinyApp PrAnaViz.
Visualisation
Download download processed data as .csv file and publication ready image .eps and .pdf files.
Figures
Page 13/18Figure 1
Data aggregation: Data aggregation and normalisation flow chart describing how API, strength, medicinal form, GP surgery
name were matched to the BNF code in the NHS Prescription dataset. Examples of the matched API are given in the table. The
first example shows the BNF code matching to one API and prescribed as a capsule, and second one shows the matching to
two different APIs and prescribed as a tablet.
Page 14/18Figure 2
Visualising time series of prescription data (Targeted API approach): A. Screenshot of graph showing prescription (in kg) of 14
APIs in Bath and North East Somerset CCG region in 2018. B. Screenshot of graph showing monthly prescription (in kg) of 14
APIs at Bath and North East Somerset CCG in 2018.
Page 15/18Figure 3
Exploration of different prescription data trends for an API target (targeted API approach): prescription quantity of
clarithromycin by each month (A), by individual GP level (B), by individual postcode level (C) and medicinal form (D) for Bath
and North East Somerset CCG in 2018. Figures are generated using PrAnaViz.
Page 16/18Figure 4
Visualising spatiotemporal series of prescription data (non-targeted API approach): A. Total prescription quantity (in kg) of
clarithromycin at the different postcodes in Bath and North East Somerset CCG region in January 2018 and June 2018. B.
Monthly prescription quantity (in kg) of clarithromycin at the postcode BA1 7NP at Bath and North East Somerset CCG region in
2018. C. Pie-chart showing total prescription percentage of different medicinal forms of clarithromycin at the postcode BA1 7NP
in Bath and North East Somerset CCG region in 2018. Figures are generated using PrAnaViz. Base map tiles provided by
OpenStreetMap © OpenStreetMap contributors. The digital boundary file contains Office for National statistics licensed under
the Open Government Licence v.3.0, contains OS data © Crown copyright and database right (2018). Note: The designations
employed and the presentation of the material on this map do not imply the expression of any opinion whatsoever on the part
of Research Square concerning the legal status of any country, territory, city or area o bbnhjr of its authorities, or concerning the
delimitation of its frontiers or boundaries. This map has been provided by the authors.
Supplementary Files
Page 17/18This is a list of supplementary files associated with this preprint. Click to download.
handbook.pdf
Page 18/18You can also read