Annual outage analysis 2021 - The causes and impacts of data center outages - Velir
←
→
Page content transcription
If your browser does not render page correctly, please read the page content below
RISK &
                                                                              RESILIENCY

UI Intelligence report 46

Annual outage analysis
2021
The causes and impacts of data center outages

 Author
 Andy Lawrence, Executive Director of Research, Uptime Institute

    Avoiding downtime remains a top priority for all
    managers of critical infrastructure. But as technology
    changes, and as the demands placed on IT change, so
    do the types, frequency and impacts of outages, as
    well as the best practices in outage avoidance.

                            UII-46 v1.1PM published March 29, 2021 last updated April 16, 2021
Annual outage analysis

This Uptime Institute Intelligence report includes:

Executive summary                                                                                          3
Key findings                                                                                               3
Introduction                                                                                               3

Growing executive concern                                                                                  5

Outage frequency                                                                                           6
   Publicly reported outage frequency                                                                      7

Severe outages less common?                                                                                8

Outages — the causes                                                                                      10
   Service provider and cloud outages                                                                     12
   Power outages                                                                                          13
   Networking outages                                                                                     15
   The human factor                                                                                       16

Duration and cost of outages                                                                              17

Summary                                                                                                   18

Appendix: Sources and methodology                                                                         19

About the author                                                                                          21

 ABOUT UPTIME INSTITUTE INTELLIGENCE
  Uptime Institute Intelligence is an independent unit of Uptime Institute dedicated to identifying,
  analyzing and explaining the trends, technologies, operational practices and changing business
  models of the mission-critical infrastructure industry. For more about Uptime Institute Intelligence,
  visit uptimeinstitute.com/ui-intelligence or contact research@uptimeinstitute.com.

                         © COPYRIGHT 2021 UPTIME I NS TITUTE . A L L R I GHTS R E S E RV E D               2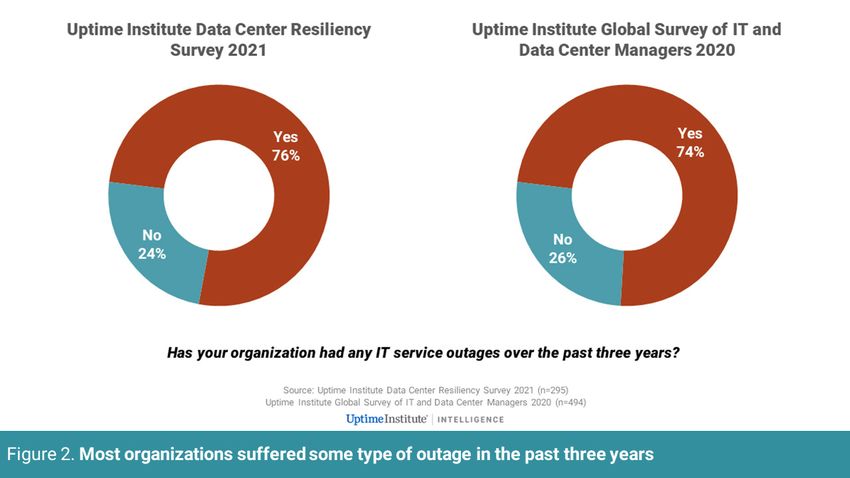
Annual outage analysis

 EXECUTIVE SUMMARY
    The avoidance of outages has always been a major priority for operators of mission-critical
    systems. Uptime Institute’s annual analysis of data center outages finds that progress toward
    reducing downtime — and the impact of outages — is mixed. While systems and processes have
    generally improved uptime and reliability, the impact of some big failures, and a concentration
    of workloads in a small number of large data centers owned by powerful players, has led some
    customers and regulators to seek better oversight and evidence of good practices. Innovations
    and investment in cloud-based and distributed resiliency may have helped reduce the impact of
    site-level failures, but it has also introduced some error-prone complexity.

 Key findings
  • In spite of improving technology and better management of availability, outages remain a major
    concern for the industry — and increasingly, for customers and regulators. The impact and cost
    of outages is growing.

  • The causes of outages are changing. Software and IT configuration and network issues are
    becoming more common, while power issues are less likely to cause a major IT service outage.

  • Human error continues to cause problems. Many outages could be prevented by improving
    management processes and training staff to follow them correctly.

  • There were fewer serious and severe outages reported in 2020 than in the previous year. While
    progress in improving reliability and availability is always a factor, this decrease may, in part, be
    due to changes in IT use and management as a result of COVID-19.

 Introduction
                                         Critical IT systems, networks and data centers are far more reliable
                                         than they once were. This is the result of many decades of innovation,
                                         investment and management. Major failures seem more common
                                         only because there is so much critical IT in use, because society’s
                                         dependency on it is so great, and because of greatly increased
                                         visibility through news and social media.
                                         In 2020 — a year in which COVID-19 made a big impact on how
                                         and where IT was used — there were, as always, some big outages
                                         that affected financial trading, government services and telecom
                                         services. However, the outages that made headlines most often
                                         were less seismic, affecting consumers and workers at home, such
                                         as interruptions or slowdowns of collaboration tools (e.g., Microsoft
                                         Teams, Zoom), online betting sites and fitness trackers.
                                         The financial consequences of outages can be high, and the numbers
                                         are increasing. The Uptime Institute Global Survey of IT and Data
                                         Center Managers 2020 found that four in 10 outages cost between
                                         $100,000 and $1 million – and about one in six costs over $1 million.
                         © COPYRIGHT 2021 UPTIME I NS TITUTE . A L L R I GHTS R E S E RV E D                     3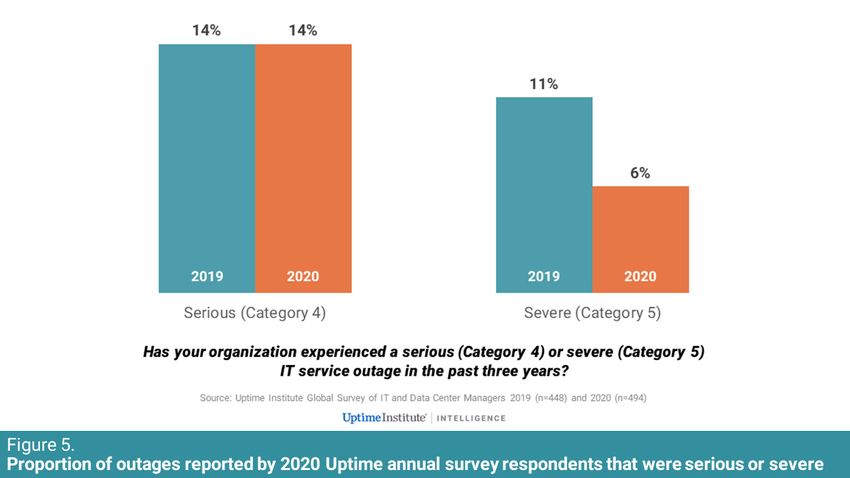
Annual outage analysis

                                          For this reason, resiliency remains at or near the top of management
                                          priorities when delivering services. Identifying and analyzing the
                                          root causes of failures is a key step in avoiding further expensive
                                          problems in the future.
                                          The growing move to cloud services and the extensive use of
                                          colocation can increase resiliency and reduce management worries.
                                          But outsourcing brings its own challenges: Uptime Institute research
                                          shows that more than half of data center operators and IT managers
                                          surveyed have experienced an outage caused by a problem at a third-
                                          party data center service provider in the past three years.
                                          The use of public cloud and service providers can hinder visibility and
                                          accountability. While providers can sometimes be disarmingly open
                                          in discussing their failures, more commonly they provide little or no
                                          commentary. Sometimes they do not admit to full outages at all.
                                          This 2021 outages report is one of a series Uptime Institute produces
                                          analyzing IT service resiliency. The report uses a variety of sources,
                                          including publicly available data (e.g., information reported in news
                                          and trade media), multiple Uptime Institute surveys (e.g., Uptime
                                          Institute Global Survey of IT and Data Center Managers, Uptime
                                          Institute Data Center Resiliency Survey), and other data aggregated
                                          and anonymized from Uptime Institute members and partners. For
                                          more detail, see Appendix: Sources and methodology.

  How Uptime Institute tracks outages
  Tracking outages is neither simple nor reliable. Not all outages are seen or experienced in the same
  way by different people, nor are all major slowdowns or disruptions classified as outages. Uptime
  Institute uses multiple ways to track the overall trends and incidents, but none provide a clear picture
  on their own. The table below shows the methods used.

 Source      Accuracy    Methodology                             Limitations

 Public      Poor         • News/social media                     • Mainly big outages and interruptions to consumer-facing
 reports                  • Outage trackers                         services
                          • Company statements                    • May lack details
                                                                  • Sources may be untrusted or poorly informed
 Uptime      Fair/good   Online surveys conducted                 • Answers may vary according to role and sample
 Institute               by Uptime Institute                      • All responses anonymous
 surveys
 Uptime      Good/Very   Detailed, accurate site/                 • Information primarily facility/site-based
 Abnormal    good        facility-level data shared               • All data anonymous
 Incident                under a nondisclosure
 Report                  agreement
 (AIRs)
 database

                          © COPYRIGHT 2021 UPTIME I NS TITUTE . A L L R I GHTS R E S E RV E D                                 4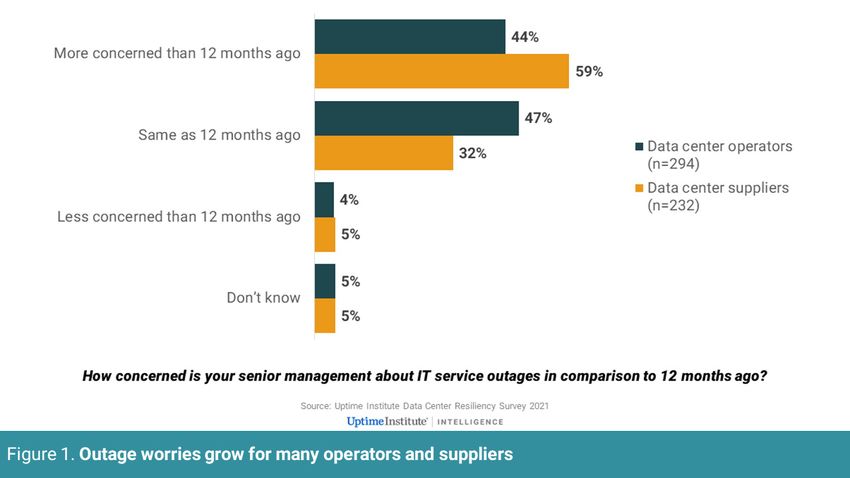
Annual outage analysis
Growing executive concern
In recent years, concern over the impact of outages has been growing
— among executives, among regulators, and among the public, who
are often directly and sometimes painfully affected. As Uptime
Institute has often stated, systems that were not necessarily designed
to be mission critical have become so as dependency on them has
increased over time.
The rising level of concern is reflected in Figure 1, which is based
on the results of the Uptime Institute Data Center Resiliency Survey
(January 2021). Almost half (44%) of data center operators surveyed,
and even more suppliers/vendors (59%), think that concern about
resiliency of data center/mission-critical IT has increased in the past
12 months. Only 5% think it has decreased.
The pandemic may have stirred up these worries, given the heavy
reliance on remote working/commerce, but the concerns were growing
anyway. The financial impact of outages (see Duration and cost of
outages) is substantial and growing, but that is only part of the story. The
damage caused by an outage ranges from inconvenience and frustration
to compliance breaches, reputational damage, and even loss of life.
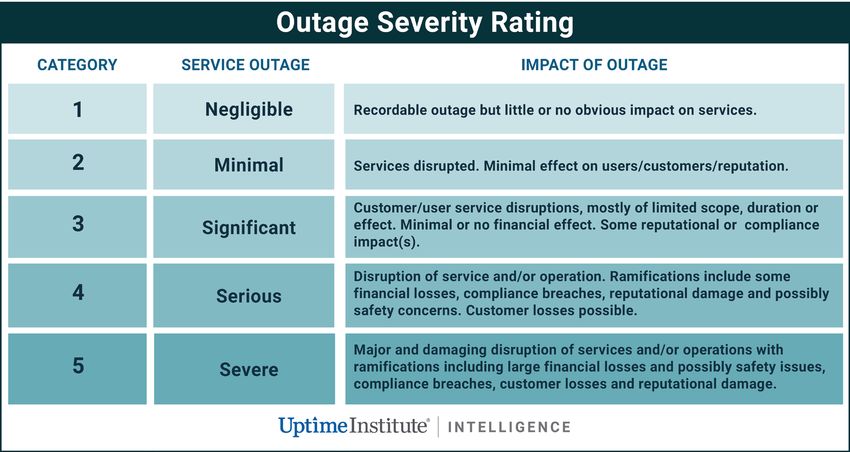
Uptime Institute’s Outage Severity Rating categorizes outage severity on
a scale of 1-5.
© COPYRIGHT 2021 UPTIME I NS TITUTE . A L L R I GHTS R E S E RV E D 5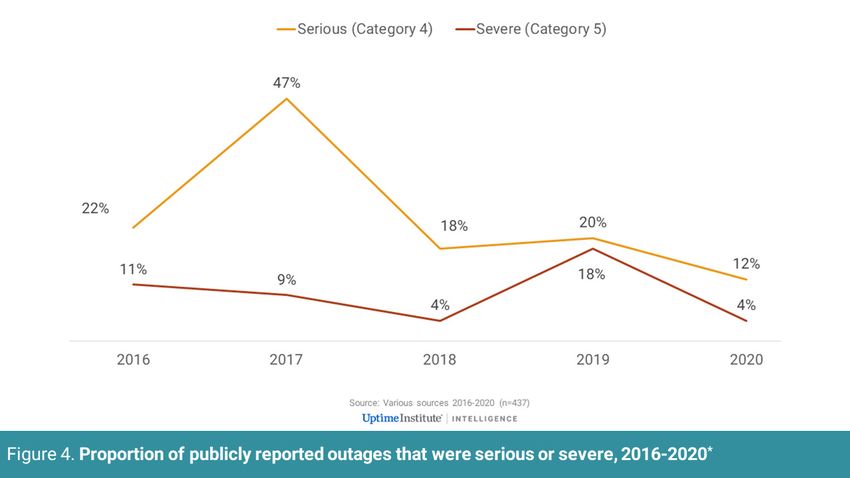
Annual outage analysis

                                   Significant, serious and severe outages — categories 3, 4 and 5,
                                   respectively — have major ramifications and require a full root-cause
                                   analysis aimed at preventing a repeat. For most operators, small IT-level
                                   service outages are irritants, but they are also a clear sign that attention
                                   and investment is needed. In the discipline of site reliability engineering
                                   (SRE), part of modern DevOps (where development and operational IT
                                   are merged), even small issues are counted and form part of an “error
                                   budget.”

 Outage frequency
                                   How common are outages? Is the number of outages increasing?
                                   Determining the answers to these questions requires care to avoid
                                   drawing misleading conclusions. As noted in How Uptime Institute
                                   tracks outages, the answers may depend on who is asked and how
                                   outages are defined.
                                   The evidence in 2020/2021 shows the following:
                                      • Outages remain common and justify high levels of concern and
                                        investment. About three in four data center operators/enterprise
                                        IT managers responding to Uptime surveys have experienced
                                        some kind of IT service outage in the past three years. When this
                                        is narrowed down to outages that had a “significant impact,” the
                                        proportion is about three in 10.
                                      • There is no evidence that the number of outages relative to the
                                        overall rise in IT is increasing. Most Uptime Institute data suggests
                                        the opposite.
                                      • Severe outages, while rare, occur in small numbers every year, and
                                        the results are catastrophic for stakeholders.

                   © COPYRIGHT 2021 UPTIME I NS TITUTE . A L L R I GHTS R E S E RV E D                            6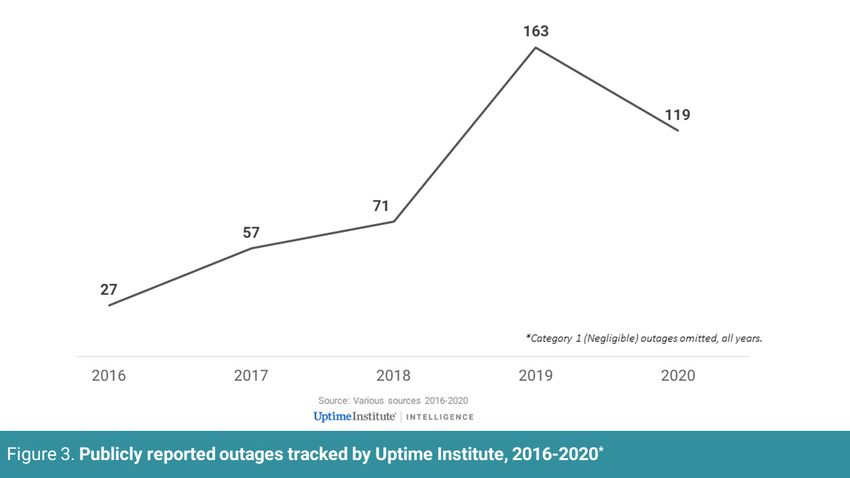
Annual outage analysis

                                   Data center and IT staff see disruptions and outages that may not be
                                   picked up by all customers, the media or even by their own executives.
                                   In 2020 and early 2021, Uptime surveys showed about three in four
                                   respondents had an IT service outage of some type in the past three
                                   years (see Figure 2).

                                   Unfortunately, it is not easy to directly map actual or promised availability
                                   (in the form of 99.9x% — the percentage of time an IT system is fully
                                   operational) onto generally published data (although, of course, this is
                                   possible for a single site or service).
                                   However, as we have often noted, the frequency and duration of
                                   outages strongly suggests that actual performance falls short of the
                                   published service level agreements (SLAs) of most data center and IT
                                   service providers, whether they are enterprises with internal customers,
                                   colocation companies or cloud providers. Business owners and
                                   customers should never consider SLAs (or 99.9x% availability figures) as
                                   reliable predictors of future availability.

Publicly                           As Figure 3 shows, the number of outages that received major media
                                   attention was significantly lower in 2020 than in 2019 (which was also

reported                           the year in which we stopped tracking smaller outages). But as we
                                   have stated in previous years, publicly reported outage figures should

outage                             be treated with great caution, as they do not necessarily represent the
                                   underlying number of outages.

frequency

                   © COPYRIGHT 2021 UPTIME I NS TITUTE . A L L R I GHTS R E S E RV E D                         7
Annual outage analysis
In our 2019 outage analysis, we noted that the strong increase in
publicly reported outages could be partly attributed to greater visibility
of outages, more reporting by the media and website trackers, and
even better data collection by the Uptime Institute Intelligence team.
In our 2020 analysis, we noted that immediate reporting of even the
most minor outages (again, often picked up by outage trackers and
then repeated in the media) has blurred the overall picture, and we now
eliminate many from our sample.
Even if the number of outages dropped, that does not necessarily mean
that the resulting level of disruption also dropped. Because more IT
is delivered from large cloud and colocation operators, the number of
reported outages may be fewer, but the number of enterprises (and
customers) affected could be much greater.
There is, of course, a further factor at play: 2020 was the year in which
the COVID-19 outbreak caused a lot of businesses to reduce/suspend
commercial operations (although, of course, a lot moved online). This
depressed some business activity, meaning fewer outages and reduced
disruption in some areas (the transportation sector, for example, usually
accounts for a small but significant number of serious failures each
year). Also, many outages occur during maintenance, upgrades and
transition — but in 2020, some data centers postponed critical work as a
result of pandemic-related concerns or issues.
Severe outages less common?
How serious are most outages? As stated, the data varies according
to who is asked or how it is collected. According to our public outage
tracking, 2019 was a particularly bad year for severe outages, while
2020 was the best year yet recorded. Not only were there fewer outages
reported by publicly available sources, but a lower proportion were
serious or severe. This is probably because the level of business-critical
activity was significantly disrupted and/or depressed due to COVID-19.
© COPYRIGHT 2021 UPTIME I NS TITUTE . A L L R I GHTS R E S E RV E D 8Annual outage analysis
As Figure 4 shows, the trendline in publicly reported outages is difficult
to trace, reflecting both the variability in actual disruption year-to-year
and the changes in reporting/data collection.
Uptime’s annual global survey data shows a different but clearer picture:
For both 2019 and 2020, about one in seven (14%) respondents reported
a serious outage in the past three years (see Figure 5). In 2020, the
proportion of those that experienced a severe outage in the past three
years dropped to just above one in 20 (6%).
What can be read from the data on outage frequency — from either
public or other sources? Two high-level conclusions are:
• Much of the public data is media based and somewhat unstable. But
it does suggest that each year, there will likely be between 20 and 50
serious, high-profile IT outages somewhere in the world — outages
that cause major financial loss, business and customer disruption,
reputational loss and, in extreme cases, loss of life.
© COPYRIGHT 2021 UPTIME I NS TITUTE . A L L R I GHTS R E S E RV E D 9Annual outage analysis
• From a data center/IT management and operations point of view,
about one in six organizations have had a severe or serious (i.e.,
damaging and expensive) IT/data center outage in the past three
years. This is a trend that will probably continue. Vigilance and
investment are necessary.
Outages – the causes
Every outage has a primary cause, and most have several contributory
and background causes. But as we have noted, knowledge and
understanding of outages depends on who is asked, and even how
outages are defined.
Uptime Institute’s most detailed and reliable source on outage causes is
its AIRs (Abnormal Incident Report) database. In the over 25 years (1994
to present) of data collection, electrical failures
accounted for 80% of all IT load losses in data
About three in four Uptime survey centers. But this sample is focused on the
respondents experienced some well-maintained, critical facilities of operators
who are active members of Uptime Institute.
kind of IT service outage in the Outages in this group are now very rare.
past three years. Looking at global, enterprise-class IT more
generally (spanning private data centers,
colocation and public cloud), Uptime Institute’s
annual survey data provides a consistent picture over several years, with
power problems invariably the biggest single cause of outages.
Uptime’s 2020 global survey shows that on-site power failure is still the
biggest cause of significant outages, accounting for 37%, followed by
software/IT systems issues and networking issues (see Figure 6). But
many of this group would not necessarily have full visibility into third-
party cloud/software as a service (SaaS) outages, for which they will
likely have no responsibility. Over time, Uptime Institute expects that
more outages will be caused by networking and software/IT, and fewer
by power issues (see further analysis below).
© COPYRIGHT 2021 UPTIME I NS TITUTE . A L L R I GHTS R E S E RV E D 10Annual outage analysis
Tracked public outages for 2020 tell a different story, with power
problems accounting for very few outages, and software/IT and
network accounting for almost three in four (see Figure 7). But this
data should be understood in context: it is based on outage trackers,
public statements and media accounts, and often true causes are
either never revealed or are reported as “IT/technical issues.”
© COPYRIGHT 2021 UPTIME I NS TITUTE . A L L R I GHTS R E S E RV E D 11Annual outage analysis
The data is consistent with a long-term trend of more network and IT/
software outages, resulting from greater use of public internet-based
services and of complex, multisite availability zones. This trend will likely
have been exaggerated and/or accelerated during COVID-19 lockdowns.
This rise in outages caused by IT systems and network issues is due
to the broad shift in recent years from siloed IT services running on
dedicated, specialized equipment to an architecture in which more IT
functions run on standard IT systems, often distributed or replicated
across many sites. As more organizations move to cloud-based,
distributed IT (driven by a desire for greater agility and automation),
the underlying data center infrastructure is becoming less of a focus
or a single point of failure. This does not mean, however, that there is
any case, at least at present, for de-emphasizing site-level resiliency
or investing less. Site-level failures invariably cause major problems,
regardless of whether distributed resiliency architectures are deployed.
Service Cloud, hosted and many other internet-based services and workloads
are designed to operate with low failure rates. Large (at-scale) cloud
provider and and IT service providers, in particular, can incorporate layers of software
and middleware, orchestrated by artificial intelligence and other big-
cloud outages data approaches, and reroute workloads and traffic away from failure.
On the whole, they provide high levels of service availability, at huge
scale and growing complexity. Even so, no architecture is fail-safe, and
professional, specialist management, however sophisticated, is no
guarantor of fault-free operations.
As Figure 8 shows, commercial provider/operators (cloud/internet giant;
digital services — here, including colocation; and telecom) together
accounted for almost three-quarters (72%) of all outages in 2020 (note:
we no longer report very minor service interruptions). This is a significant
increase on the five-year average figure (53%) for digital services, cloud/
internet and telecom combined. But this increase probably says little
about reliability and is more likely to be the result of their growing market
share and the impact of COVID-19 on traffic/IT use.
© COPYRIGHT 2021 UPTIME I NS TITUTE . A L L R I GHTS R E S E RV E D 12Annual outage analysis
When third-party data center service providers do have an outage,
customers are immediately affected — and they may seek
compensation and a full explanation. Many regulators and enterprises
now want increased visibility, accountability, and improved SLAs —
especially for cloud services. Currently, even big enterprise customers
do not always know why an outage occurred until long after the
issue has been resolved, nor can they necessarily ensure in advance
that their supplier’s data centers (or the IT) are well designed and
operated.
According to Uptime Institute survey data, more than half (56%) of all
organizations using a third-party data center service have experienced
a moderate or serious IT service outage in the last three years that
was itself caused by a problem at a third-party provider.
As Figure 9 shows, the most commonly cited reasons for service
interruptions involved software or networking. This is now often the
case — complex backup regimes and availability zones, intended
to improve resiliency and responsiveness, come with their own
problems. Mechanical/electrical issues were also cited as common
causes.
Power Power-related outages have long been the scourge of data center
management. A power event is usually sudden, binary (on/off),
outages sitewide, and has an immediate impact on many services. Although
diagnosis and even restoration of power can be quick, IT systems can
take many hours to be restarted safely.
The rate of power-related outages is steadily falling, both as a cited
cause in major public outages and as the cause of outages reported
by Uptime Institute members. But power outages still occur, although
many are prevented by good design, effective processes and staff
action (see The human factor).
The most common causes of power-related outages are shown in
Figure 10.
© COPYRIGHT 2021 UPTIME I NS TITUTE . A L L R I GHTS R E S E RV E D 13Annual outage analysis
Data center managers will not be surprised that failure of uninterruptible
power supplies (UPSs), transfer switches and generators (usually failing
to start) cause most power-related outages. These devices are a last line
of defense, often for very large numbers of servers and IT equipment.
Uptime Institute engineers report that static UPSs fail due to a number of
reasons:
• Fans fail frequently because they are usually inexpensive and
operate all the time. A single fan failure does not take a unit down,
but the failure of multiple fans may.
• Snubber capacitors can fail from wear and tear. Regular preventative
maintenance will reduce the number of failures.
• Batteries fail due to age and require good management, close
monitoring and adherence to replacement schedules. Many
failures are because batteries are not monitored closely enough by
experienced technicians.
• Inverter stack failures are least common. They are more likely to
occur when the unit is overloaded, although wear and tear can also
cause failures.
UPS problems are more likely with age, and operators of data centers
without trusted concurrent maintainability designs (the ability to bypass
any item of equipment for maintenance without interrupting overall
service) can be more likely to postpone maintenance or replacement.
Generators are reliable, but require regularly scheduled maintenance, fuel
checks and testing. ATS (automatic transfer switch) units are generally
robust, but failures may occur with active controls or with a loss of direct
current (DC) power to those controls. Other less common failures are
due to mechanical issues, such as bearings wearing out or a jammed
switch.
Uptime Institute engineers also report that sometimes switch gear will
be set up with controls to mimic an ATS — and many will call this an ATS
© COPYRIGHT 2021 UPTIME I NS TITUTE . A L L R I GHTS R E S E RV E D 14Annual outage analysis
— even when it is not an actual ATS. These units may fail from controls
failures, loss of battery power, or circuit breakers that fail to open or
close when signaled.
Networking Networking issues are now emerging as one of the more common
— if not the most common — causes of downtime. The reasons are
outages clear enough: modern applications and data are spread across and
between data centers, with networking ever more critical. To add to
the mix, software-defined networks have added great flexibility and
programmability, which can introduce failure-prone complexity.
The Uptime Institute Data Center Resiliency Survey 2021 results
shown in Figure 11 support the complexity diagnosis. Configuration
errors, firmware errors, and corrupted routing tables all play a big role
in networking-related failures, while the more traditional worries of
weather and cable breaks are a relatively minor concern. Congestion
and capacity issues also cause failures, but these are often the result of
programming/configuration issues.
Networks are complex not only from a technical point of view, but also
operationally. While enterprise data centers may be served by only one
or two telecommunications providers, multicarrier colocation hubs can
be served by many. Some of these links may, further down the line, share
cables or facilities — adding possible overlapping points of failure or
capacity pinch points. Ownership, visibility and accountability can also be
complicated. This contributes to 45% of respondents having experienced
an outage in the last three years caused by a third-party networking issue
— something over which they had little control.
A few of the organizations that avoided network-related incidents put
this down to luck — and to be fair, luck can play a role. But the majority
of those who avoided downtime attribute it to a more controllable factor:
investment in systems and training. As with the prevention of power
issues, money spent on expertise, redundancy, monitoring, diagnostics
and recovery, along with staff training and processes, will be paid back
with more hours of uptime.
© COPYRIGHT 2021 UPTIME I NS TITUTE . A L L R I GHTS R E S E RV E D 15Annual outage analysis
The human Uptime Institute is often asked, What percentage of outages are caused
by human error? There are many ways to interpret that question, and for
factor this reason, Uptime is wary of citing a single number. Uptime Institute’s
confidential incident reporting system (the AIRs database), which
documents thousands of incidents, suggests an aggregated year-on-year
average of 63% of failures due to human error. In Uptime’s 2020 annual
survey, 75% of respondents said their most recent downtime could have
been prevented with better management or processes — another way
of looking at the role of human decision-making and actions. And in our
most recent (2021) data center resiliency survey, 42% of respondents
said they had experienced an outage in the last three years due to human
error. Clearly, human errors in the data center and in IT account for a lot
of outages (and incidents in which outages are narrowly avoided).
For those seeking to avoid downtime, a key question is, We know human
error is a factor in many outages, but what are the causes of human
error? As Figure 12 shows, failure to follow procedures or following
incorrect procedures are the most commonly cited reasons.
Given the high and growing costs of outages (very often in the hundreds
of thousands of dollars), this suggests that investment in staff, in training
and in ensuring better management and processes will ultimately provide
a payback — even if it is difficult to measure.
© COPYRIGHT 2021 UPTIME I NS TITUTE . A L L R I GHTS R E S E RV E D 16Annual outage analysis
Duration and cost of outages
Vendors of resiliency products and services frequently emphasize, and
sometimes exaggerate, the financial and business damage caused
by outages. However, the data is patchy. It is widely known that major
outages at large companies have had a huge impact — in a few cases,
above $100 million in losses. Each year, there are certainly many cases
that cost several million dollars, or tens of millions.
Most organizations fail to collect good data on outage costs, and even
those that do cannot account for all costs, such as reputational damage
or the failure to be considered for a large future contract.
In 2020, Uptime research suggests that the cost of outages is going up
(see Figure 13), with over half who had experienced an outage saying it
cost more than $100,000. (Uptime does not calculate average costs due
to the huge range and number of outliers.) The damage from an outage
can vary enormously, depending on when it occurs, to whom, and how
long it lasts.
If outage duration is an indicator of costs, then some organizations
suffered some expensive failures in 2020, according to the publicly
reported data (see Table 1). A greater proportion of problems lasted
more than four hours in 2020 than in the past — possibly because of the
issue of IT, software and network complexity previously discussed. But
COVID-19 may have distorted the picture, with businesses such as travel
and bricks-and-mortar retail operating under tight constraints in 2020.
The focus switched; among the most costly incidents in 2020 was the
loss of bookmaking services during a major racing event.
© COPYRIGHT 2021 UPTIME I NS TITUTE . A L L R I GHTS R E S E RV E D 17Annual outage analysis
Table 1. Outages getting longer?*
Duration 2017 2018 2019 2020
(hours) (n=57) (n=71) (n=140) (n=119)
0-4 36 29 69 21
4 - 12 13 25 26 70
12 - 24 4 6 14 15
24 - 48 2 4 14 6
> 48 2 7 17 7
* Outages for which the cause was not known were eliminated from the analysis.
Note. Times reported are time to service recovery, not time to full business recovery.
Summary
For the past several years, Uptime Institute’s research has led to
some clear and consistent findings. A few, however, appear to
point in somewhat contradictory directions, which can lead to
misunderstandings.
One of these misunderstandings concerns the level of availability and
outages generally. Overall, the level of reliability of data centers has been
improving, not worsening. But this is not always clear from figures that
show a high and consistent rate of outages experienced by IT and data
center management.
The anomaly may be simply explained. The level of investment in new
data centers, in an ever-increasing amount of IT capacity, and in new IT
services in recent years has dwarfed that of all previous decades. The
frequency of outages has grown too — but much more slowly. Even so,
the risk of an outage at any data center, or for an IT service, is still high
enough to concern managers and to justify high investment.
The growing use of cloud-based or network-based resiliency has
created some confusion, since some IT technicians have extremely high
expectations of these technologies. Some operators quote five nines
availability or have implied that system-wide failure is nearly impossible.
This is clearly not the case.
Such modern IT architectures are designed to overcome component,
equipment, and in some cases, site-level failures; equally, they are
designed to support more fluid movement of data and processing,
allowing rerouting of traffic to replicated data. But significant investment
and expertise is required to operate this successfully, and some of
this technology is still in its infancy. At scale, distributed resiliency can
introduce complexity and other challenges that may lead to failures,
© COPYRIGHT 2021 UPTIME I NS TITUTE . A L L R I GHTS R E S E RV E D 18Annual outage analysis
some of which are not easily foreseeable. This explains why a growing
number of outages result from software and network systems and
configuration errors. Distributed resiliency is a methodology still in
development: it works well, but not perfectly. In the long term, greater
investment and experience, and the use of advanced monitoring and
optimization technologies, will help to reduce failures more significantly.
The number of outages is only one metric, and
Uptime Institute’s research points not the one many managers will worry about
most. A bigger concern is the likelihood — and
to one simple and actionable possible impact — of outages for their type of
finding: Human error is often operation.
the result of failure to follow In this regard, IT is paying the price of its
success: The costs of outages are rising,
processes, or of having inadequate along with the disruption caused. This is the
processes. Better focus, result of several factors, including the growing
dependency by business/society on IT; the
management and training will concentration of IT in fewer companies/large
produce better results. data centers; and the difficulty of quickly
resolving complex system outages, sometimes
spanning multiple sites.
Because of the importance of IT and data centers, and the impact of
outages, many regulators of financial services, emergency services,
telecoms and central governments are reaching the conclusion that
greater visibility, accountability and control is needed.
Prevention of outages is a constant challenge that requires attention,
investment, and analysis on several fronts. But Uptime Institute’s
research does point to one simple and actionable finding: Human error,
which lies at the root of many outages, is often the result of failure to
follow processes, or of having inadequate processes. Better focus,
management and training will produce better results.
Appendix: Sources and methodology
Uptime Institute currently has four data sources for monitoring
data center and IT outages or incidents that can potentially lead to
outages:
• Uptime Institute Global Survey of IT and Data Center Managers.
This long-running series of annual surveys, with 846 respondents
in 2020, asks detailed questions about outages; some of
the findings are discussed here. This represents the most
statistically significant dataset relating to outages in the critical
infrastructure industry.
• Uptime Institute Data Center Resiliency Survey. This global
survey specifically focuses on outages and resiliency-related
issues. The first survey was conducted in January 2021, with 642
© COPYRIGHT 2021 UPTIME I NS TITUTE . A L L R I GHTS R E S E RV E D 19Annual outage analysis
respondents split between data center operators and suppliers/
services companies. The results are compared and contrasted
with those from the Uptime Institute Global Survey of IT and Data
Center Managers, which is conducted midyear.
• Uptime Institute Intelligence’s public outages database. Since
the beginning of 2016, Uptime Institute has collected data about
major IT outages from media reports and other public sources
(social media, outage detection sites, etc.) on an ongoing basis.
This effort enables us to collect information on major outages
that become visible to the public and the media, and, over time, to
identify patterns.
• Uptime Institute’s Abnormal Incident Report (AIRs) database.
This is a long-standing confidential system for global Uptime
Institute members to share details of incidents under a
nondisclosure agreement. Most incidents recorded do not
actually lead to outages — many are “near misses.” We do not
include such incidents in the analyses described in this report.
• Uptime Institute Professional Services. Uptime Institute
conducts Digital Resiliency Assessments and root-cause
analyses of failures on behalf of clients, globally. Although these
assignments are confidential, the experience garnered from these
incidents further informs our analyses.
The methodology used for the bulk of the findings in this report is
limited and the data should be understood in this way — it is primarily
useful for trending and, while we believe it is directionally accurate,
it is not a representative dataset for all outages. There are several
limitations:
• If a failure is not reported or picked up by the media or Uptime
Institute, it will not be recorded. This immediately means there
is a bias toward coverage of large, public-facing IT services, and
sometimes more so in geographies with a well-developed and
open media.
• We limit failures to those that had a noticeable impact on end
users — a major fire during data center commissioning, for
example, may never be registered. We have also eliminated all
category 1 outages — small, short failures where the business or
reputational impact is negligible.
• The amount of information available varies widely from outage to
outage, and sometimes there is very little information available at
all. It has regrettably been necessary, in some of the analyses, to
include outages for which the cause is “not known” — meaning it
was never disclosed.
• Finally, while we include IT system failures, we do not generally
include cybersecurity breaches, except those that can lead to
complete service interruptions.
© COPYRIGHT 2021 UPTIME I NS TITUTE . A L L R I GHTS R E S E RV E D 20Annual outage analysis
ABOUT THE AUTHOR
Andy Lawrence is Uptime Institute’s Executive Director of Research.
Mr. Lawrence has built his career focusing on innovative new solutions,
emerging technologies, and opportunities found at the intersection of IT
and infrastructure. Contact: alawrence@uptimeinstitute.com
ABOUT UPTIME INSTITUTE
Uptime Institute is an advisory organization focused on improving the performance, efficiency and reliability of business critical
infrastructure through innovation, collaboration and independent certifications. Uptime Institute serves all stakeholders responsible for
IT service availability through industry leading standards, education, peer-to-peer networking, consulting and award programs delivered to
enterprise organizations and third-party operators, manufacturers and providers. Uptime Institute is recognized globally for the creation and
administration of the Tier Standards and Certifications for Data Center Design, Construction and Operations, along with its Management &
Operations (M&O) Stamp of Approval, FORCSS® methodology and Efficient IT Stamp of Approval.
Uptime Institute – The Global Data Center Authority®, a division of The 451 Group, has office locations in the US, Mexico, Costa Rica, Brazil,
UK, Spain, UAE, Russia, Taiwan, Singapore and Malaysia. Visit uptimeinstitute.com for more information.
All general queries:
Uptime Institute
5470 Shilshole Avenue NW, Suite 500
Seattle, WA 98107 USA
+1 206 783 0510
info@uptimeinstitute.com
© COPYRIGHT 2021 UPTIME I NS TITUTE . A L L R I GHTS R E S E RV E D 21You can also read