CNN based Road User Detection using the 3D Radar Cube
←
→
Page content transcription
If your browser does not render page correctly, please read the page content below
CNN based Road User Detection using the 3D Radar Cube
                          Andras Palffy 1,a , Jiaao Dong 1 , Julian F. P. Kooij 1 and Dariu M. Gavrila 1

   Abstract—This paper presents a novel radar based, single-
frame, multi-class detection method for moving road users
(pedestrian, cyclist, car), which utilizes low-level radar cube data.
The method provides class information both on the radar target-
and object-level. Radar targets are classified individually after
extending the target features with a cropped block of the 3D
radar cube around their positions, thereby capturing the motion
of moving parts in the local velocity distribution. A Convolutional
Neural Network (CNN) is proposed for this classification step.
Afterwards, object proposals are generated with a clustering
step, which not only considers the radar targets’ positions and
velocities, but their calculated class scores as well.
   In experiments on a real-life dataset we demonstrate that our
method outperforms the state-of-the-art methods both target and
object-wise by reaching an average of 0.70 (baseline: 0.68) target-
wise and 0.56 (baseline: 0.48) object-wise F1 score. Furthermore,
we examine the importance of the used features in an ablation
study.

                        I. INTRODUCTION
   Radars are attractive sensors for intelligent vehicles as they
are relatively robust to weather and lighting conditions (e.g.
rain, snow, darkness) compared to camera and LIDAR sensors.
Radars also have excellent range sensitivity and can measure
radial object velocities directly using the Doppler effect. Thus,
they are widely used in applications such as adaptive cruise
control and pre-crash safety.
   Commercially available radars output a point-cloud of re-
flections called radar targets in every frame (sweep). Each
radar target has the following features: range r and azimuth                    Fig. 1: Inputs (radar cube and radar targets, top), main
α, radar cross section RCS (i.e. reflectivity), and the object’s                processing blocks (RTCnet and object clustering, bottom left),
radial speed vr relative to the ego-vehicle. We will call                       and outputs (classified radar targets and object proposals,
these features target-level. Since a single reflection does not                 bottom right) of our proposed method. Classified radar targets
convey enough information to segment and classify an entire                     are shown as colored spheres at the sensor’s height. Object
object, many radar based road user detection methods (e.g.                      proposals are visualized by a convex hull around the clustered
[1], [2], [3]) first cluster radar targets by their target-level                targets on the ground plane and at 2 m.
features. Clusters are then classified as a whole based on
derived statistical features (e.g. mean, variance of r, vr , RCS
of contained radar targets), and the same class label is assigned
                                                                                speed distribution (i.e. Doppler vector) at multiple 2D range-
to all radar targets in the cluster. Object segmentation and
                                                                                azimuth locations. Such distributions can capture modulations
classification performance in such pipeline depend on the
                                                                                of an object’s main velocity caused by its moving parts, e.g.
success of the initial clustering step.
                                                                                swinging limbs or rotating wheels, and were shown to be a
   Various methods [4], [5], [6] instead explore using the low-
                                                                                valuable feature for object classification [4], [5]. Commonly
level radar cube extracted from an earlier signal processing
                                                                                radar cube features are computed by first generating 2D range-
stage of the radar. The radar cube is a 3D data matrix with
                                                                                azimuth or range-Doppler projections, or by aggregating the
axes corresponding to range, azimuth, and velocity (also called
                                                                                projected Doppler axis over time into a Doppler-time image
Doppler), and a cell’s value represents the measured radar
                                                                                [6], [7]. We will call features derived from the 3D cube or
reflectivity in that range/azimuth/Doppler bin. In contrast to
                                                                                its projections low-level. A downside of such low-level radar
the target-level data, the radar cube provides the complete
                                                                                data is the lower range and azimuth resolution than the radar
   1) Intelligent Vehicles Group, Delft University of Technology, The Nether-   targets, and that radar phase ambiguity is not yet addressed,
lands; a) A.Palffy@tudelft.nl                                                   since no advanced range interpolation and direction-of-arrival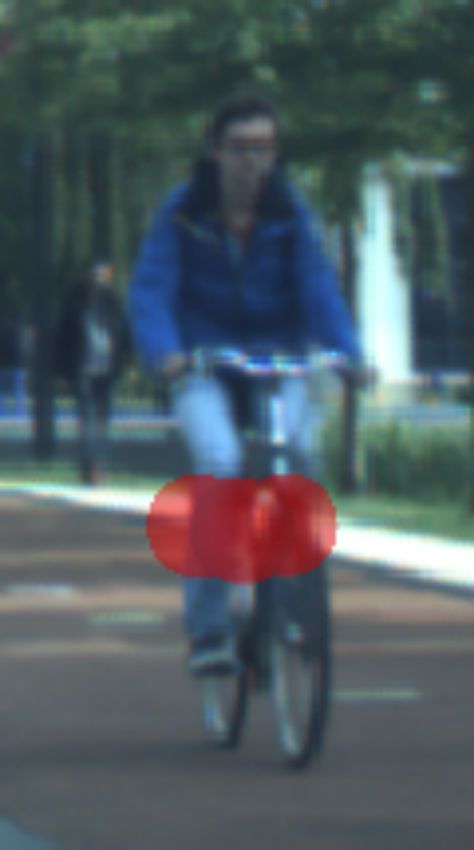
been shown with target-level [14] and with low-level data [15].
                                                                      We will focus only on methods addressing moving road users.
                                                                         Many road user detection methods start by clustering the
                                                                      radar targets into a set of object proposals. In [1], radar targets
                                                                      are first clustered into objects by DBSCAN [16]. Then, several
Fig. 2: Challenging cases for cluster-wise classification meth-       cluster-wise features are extracted, e.g. the variance/mean of
ods. A: Objects may be clustered together (red circle). B:            vr and r. The performance of various classifiers (Random For-
Large objects may be split up into several clusters. C: Object        est, Support Vector Machine (SVM), 1-layer Neural Network,
with only one reflection. Radar targets are shown as dots,            etc.) were compared in a single-class (pedestrian) detection
colored green/blue for pedestrian/car ground truth class.             task. [2] also uses clusters calculated by DBSCAN as the base
                                                                      of a multi-class (car, pedestrian, group of pedestrians, cyclist,
                                                                      truck) detection, but extract different features, e.g. deviation
estimation has taken place.                                           and spread of α. Afterwards, Long Short-Term Memory
   In this paper we propose a radar based, multi-class moving         (LSTM) and Random Forest classifiers were compared for
road user detection method, which exploits both expert knowl-         the classification step. Falsely merged clusters (Fig. 2, A)
edge at the target-level (accurate 2D location, addressed phase       were corrected manually to focus on the classification task
ambiguity), and low-level information from the full 3D radar          itself. The same authors showed a method [17] to incorporate
cube rather than a 2D projection. Importantly, the inclusion          a priori knowledge about the data into the clustering. [18] also
of low-level data enables classification of individual radar          aims to improve the clustering with a multi-stage approach.
targets before any object clustering; the latter step can benefit     [3] follows the work of [2] for clustering and classification,
from the obtained class scores. At the core of our method is          but tests and ranks further cluster-wise features in a backward
a Convolutional Neural Network (CNN) called Radar Target              elimination study.
Classification Network, or RTCnet for short. See Fig. 1 for an           While clustering based methods are widely used, it is
overview of our method’s inputs (radar targets and cube) and          often noted (e.g. [11], [17]) that the clustering step is error-
outputs (classified targets and object proposals).                    prone. Objects can be mistakenly merged (Fig. 2, A) or split
   Our method can provide class information on both radar             apart (Fig. 2, B). Finding suitable parameters (e.g. radius and
target-level and object-level. Target-level class labels are valu-    minimum number of points for DBSCAN) is challenging as
able for sensor fusion operating on intermediate-level, i.e.          the same parameters must be used for all classes, although
handling multiple measurements per object [8], [9]. Our target-       they have significantly different spatial extension and velocity
level classification is more robust than cluster-wise classifica-     profiles. E.g. a larger radius is beneficial for cars, but could
tion where the initial clustering step must manage to separate        falsely merge pedestrians and cyclists. Another challenge of
radar targets from different objects, and keep those coming           clustering based methods is that small objects may not have
from the same object together, see Fig. 2. Our object-level           enough reflections (Fig. 2, C) to extract meaningful statistical
class information provides instances that are both segmented          features, e.g. variance. E.g. both [1] and [2] have DBSCAN’s
and classified (object detection), which is valuable for high-        minimum number of points to form a cluster (M inP oints)
level (i.e. late) sensor fusion. While traditional methods must       larger than one, which means that single standing points are
perform clustering with a single set of parameters for all            thrown away.
classes, our approach enables use of class-specific clustering           To address these challenges, there is a trend to classify
parameters (e.g. larger object radius for cars).                      each target individually instead of in clusters. Encouraged
                                                                      by the results achieved with semantic segmentation networks
                    II. RELATED WORK                                  on point-clouds from LIDAR or stereo camera setups, e.g.
                                                                      Pointnet++ [19], researchers have tried to apply the same
 Method           Basis      Features   Classes   Time window         techniques to radar data. However, the output of a single radar
 Prophet [1] †    clusters   target     single    1 frame (50 ms)
                                                                      sweep is too sparse. To overcome this, they used multiple
 Schumann [2] †   clusters   target     multi     2 frames (150 ms)   frames [11] or multiple radar sensors [20].
 Prophet [10]     clusters   both       single    1 frame                Low-level radar data has been used for road user classifica-
 Schumann [11]    targets    target     multi     0.5 s               tion, especially for pedestrians. E.g. a walking pedestrian’s
 Angelov [6]      targets    low        multi     0.5-2 s
 RTCnet (ours)    targets    both       multi     1 frame (75 ms)     Doppler-time image contains a characteristic walking gait
                                                                      pattern [4], [5]. This is beneficial to exploit if the radar
TABLE I: Overview of the most closely-related methods.                sensor is stationary, e.g. in surveillance applications [21],
†
  : marks methods selected as baselines.                              [22], [7]. Doppler-time features were also used in automotive
                                                                      setups. [6] applies a CNN-LSTM network on Range-Doppler
   Some previous work on radar in automotive setting has dealt        and Doppler-Time spectrograms of 0.5-2 seconds to classify
with static environments. E.g. [12] shows preliminary results         pedestrian, group of pedestrians, car, and cyclist classes. [10]
of a neural network based method in a static experimental             pointed out that a long multi-frame observation period is not
setup, which creates accurate target-level information from the       viable for urban driving, and proposed a single-frame usage of
radar cube. [13] creates an occupancy grid with low-level data.       low-level data. Their method still generates object proposals
Static object classification (e.g. parked cars, traffic signs) has    with DBSCAN similar to [1], [2], but extracts for each cluster
the corresponding area in a 2D Range-Doppler image, which            are filtered out. Then, corresponding target-level and low-level
is then classified using conventional computer vision. In [23],      radar data are connected. That is, we look up each remaining
the full radar cube is used as a multi-channel image input           dynamic radar target’s corresponding range/azimuth/Doppler
to a CNN network to classify cars, pedestrians, and cyclists.        bins, i.e. a grid cell in the radar cube based on their reported
The study only addresses a single-object classification task,        range, azimuth and (relative) velocity (r, α, vr ). Afterwards,
i.e. location is not fetched.                                        a 3D block of the radar cube is cropped around each radar
   In conclusion, the topic of radar based road user detection       target’s grid cell with radius in range/azimuth/Doppler dimen-
was extensively researched. Table I gives an overview of the         sions (L, W, H). See ”Pre-Processing” part on Fig. 3.
most relevant methods with their basis of the classification
(cluster-wise or target-wise), the level of features (target or
low), the number of classified classes, and the required time        B. Network
window to collect suitable amount of data. None of the found            RTCnet consists of three modules as seen on Fig. 3.
methods avoids error-prone clustering for classification and            1) Down-sample range and azimuth dimensions: The first
operates with a low latency for urban driving (i.e. one or two       part’s aim is to encode the radar target’s spatial neighborhood’s
radar sweeps (75 − 150 ms)) at the same time.                        Doppler distribution into a tensor without extension in range
   Our main contributions are as follows. 1) We propose              or azimuth. In other words, it transforms the 1 × W × L × H
a radar based, single-frame, multi-class (pedestrian, cyclist,       sized data to a C × 1 × 1 × H sized tensor (sizes are given
car) moving road user detection method, which exploits both          as Channel × Azimuth × Range × Doppler), where C was
target-level and low-level radar data by a specially designed        chosen as 25. To do this, it contains two 3D convolutions
CNN. The method provides both classified radar targets and           (Conv) with the kernel sizes of 6×3×3×3 and 25×3×3×3
object proposals by a class-specific clustering. 2) We show          (padding is 1). Both convolutional layers are followed by a
on a large-scale, real-world dataset that our method is able to      maxpool (MP) layer with the kernel sizes of 6 × 2 × 2 × 1 and
detect road users with higher than state-of-the-art performance      25 × 2 × 2 × 1 with 0 padding to down-sample in the spatial
both in target-wise (target classification) and object-wise (ob-     dimensions.
ject detection) metrics using only a single frame of radar data.
                                                                        2) Process Doppler dimension: The second part of the
                                                                     network operates on the output of the first which is a
                                                                     25 × 1 × 1 × H sized tensor. The aim of this module is to
                   III. PROPOSED METHOD                              extract class information from the speed distribution around
   In this research, we combine the advantages of target-level       the target. To do this, we use three 1D convolutions along
(accurate range and azimuth estimation) and low-level data           the Doppler dimension with the kernel size of 7 and output
(more information in speed domain) by mapping the radar              channel sizes of 16, 32, 32. Each convolution is followed by a
targets into the radar cube and cropping a smaller block             maxpool layer with the kernel size of 3 and stride of 2, which
around it in all three dimensions (subsection III-A). RTCnet         halves the length of the input. The output of the this module
classifies each target individually based on the fused low-          is a 32 × 1 × 1 × H/8 block.
level and target-level data. The network consists of three parts        3) Score calculation: The output of the second module
(subsection III-B). The first encodes the data in spatial do-        is flattened and concatenated to the target-level features
mains (range, azimuth) and grasps the surroundings’ Doppler          (r, α, vr , RCS), and fed into the third one. We use two fully
distribution. The second is applied on this output to extract        connected layers with 128 nodes each to provide scores. The
class information from the distribution of speed. Finally,           output layer has either four nodes (one for each class) for
the third part provides classifications scores by two fully          multi-class classification or two for binary tasks. In the latter
connected layers (FC). The output is either multi-class (one         case, ensemble voting is applied, see next subsection.
score for each class) or binary. In the latter case, an ensemble
voting (subsection III-C) step combines the result of several
binary classifiers similarly to [24]. A class-specific clustering    C. Ensemble classifying
step (i.e. the radar targets’ predicted class information is used)      With four output nodes, it is possible to train the third
generates an object list output (subsection III-D). See Fig. 3       module to perform multi-class classification directly. We also
for an overview of our method. The software of our pipeline          implemented an ensemble voting system of binary classifiers
is available on our website1 .                                       (networks with two output nodes). That is, aside training
                                                                     a single, multi-class network, we followed [24] and trained
A. Pre-processing                                                    One-vs-All (OvA) and One-vs-One (OvO) binary classifiers
   First, a single frame of radar targets and a single frame of      for each class (e.g. car-vs-all) and pair of classes (e.g. car-
the radar cube (low-level data) is fetched. Each radar target’s      vs-cyclist), 10 in total. The final prediction scores depend
speed is compensated for ego-motion similarly to [2]. As             on the voting of all the binary models. OvO scores are
we only address moving road users, radar targets with low            weighted by the summation of the corresponding OvA scores
compensated (absolute) velocity are considered as static and         to achieve a more balanced result. Although we experimented
                                                                     with ensembling multi-class classifiers trained on bootstrapped
  1 https://github.com/tudelft-iv/RTCnet                             training data as well, it yielded worse results.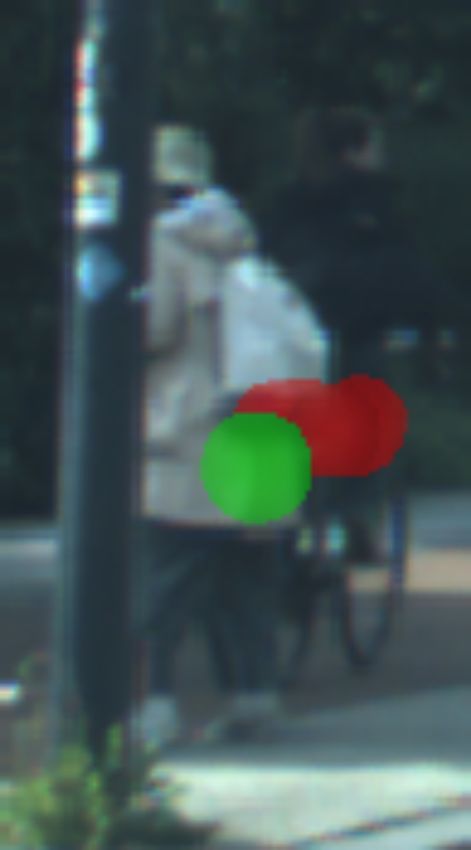
Fig. 3: Our pipeline. A block around each radar target is cropped from radar cube. RTCnet has three parts. I. encodes range and
azimuth dimensions. II. extracts class information from the speed distribution. III. provides scores based on II. and target-level
features. Ensembling assigns a class label to each radar target. The class-specific clustering provides object proposals.

D. Object Clustering                                                                                              Pedestrians   Bikers   Cars

   The output of the network (or voting) is a predicted class         Number of instances                         31300         15290    9362
                                                                      Number of radar targets                     63814         45804    30906
label for each target individually. To obtain proposals for           Avg. number of radar targets per instance   2.04          3.00     3.30
object detection, we cluster the classified radar targets with        Instances with only one radar target        12990         3526     2878
DBSCAN incorporating the predicted class information, i.e.            Ratio of instances with one radar target    41.5%         18.8%    37.6%
radar targets with bike/pedestrian/car predicted labels are
clustered in separate steps. As metric, we used a spatial             TABLE II: Number of instances from each class in our training
threshold γxy on the Euclidean distance in the x, y space (2D         set. Many road users have only one radar reflection, which is
Cartesian spatial position), and a separate speed threshold γv        not enough to extract meaningful statistical features.
in velocity dimension (Prophet [1], [18], [25]). The advan-
tage of clustering each class separately is that no universal
                                                                         Annotation was fetched automatically from the camera
parameter set is needed for DBSCAN. Instead, we can use
                                                                      sensor using the Single Shot Multibox Detector (SSD) [27]
different parameters for each class, e.g. larger radius for cars
                                                                      trained on the EuroCity Persons dataset [28]. Distance is
and small ones for pedestrians (Fig. 2, A and B). Furthermore,
                                                                      estimated by projecting the bounding boxes into the stereo
swapping the clustering and classification step makes it pos-
                                                                      point-cloud computed by the Semi-Global Matching algorithm
sible to consider objects with a single reflection, e.g. setting
                                                                      (SGM) [29], and taking the median distance of the points
M inP oints to one for pedestrian labeled radar targets (Fig.
                                                                      inside them. In a second iteration, we manually corrected
2, C). A possible drawback is that if a subset of an object’s
                                                                      mislabeled ground truth, e.g. cyclist annotated as pedestrian.
reflections are misclassified (e.g. a car with multiple targets,
                                                                      The training set contains more than 30/15/9 × 103 pedes-
most labeled car and some as cyclist), the falsely classified
                                                                      trian/cyclist/car instances respectively (one object may appear
targets (i.e. the cyclist ones) will be mistakenly clustered into a
                                                                      on several frames), see Table II. Fig. 7 shows the distribution
separate object. To address this, we perform a filtering on the
                                                                      of radar targets in the training set distance-wise. To further ex-
produced object proposals, calculating their spatial, (radial)
                                                                      tend our training dataset, we augmented the data by mirroring
velocity, and class score distribution distances (scores are
                                                                      the radar frames and adding a zero-mean, 0.05 std Gaussian
handled as 4D vector, and we take their Euclidean distance
                                                                      noise to the normalized r and vr features. Training and testing
after normalization). If two clusters have different classes and
                                                                      sets are from two independent driving (33 and 31 minutes
are close enough in all dimensions (cf. parameters in Sect.
                                                                      long) which took place on different days and routes. Validation
V-B), we merge the smaller class to the larger (i.e. pedestrians
                                                                      set is a 10% split of training dataset after shuffling.
to cyclists and cars, cyclists to cars) given that the cluster from
the larger class has more radar targets.                                                   V. EXPERIMENTS
                                                                         We compared our proposed method, RTCnet with binary
                        IV. DATASET                                   bagging (from now on, referred to as RTCnet) to two baselines
   Our real-world dataset contains ∼ 1 hour of driving in urban       in two experiments to examine their radar target classification
environment with our demonstrator vehicle [26]. We recorded           and object detection capabilities.
both the target-level and low-level output of our radar, a               In the first experiment, we examined their performance
Continental 400 series mounted behind the front bumper. We            in classification task, using a target-wise metric, i.e. a true
also recorded the output of a stereo camera (1936 × 1216 px)          positive is a correctly classified target [11]. For cluster-wise
mounted on the wind-shield, and the ego-vehicle’s odometry            methods (the baselines) the predicted label of a cluster is as-
(filtered location and ego-speed).                                    signed to each radar target inside following [11]. Furthermore,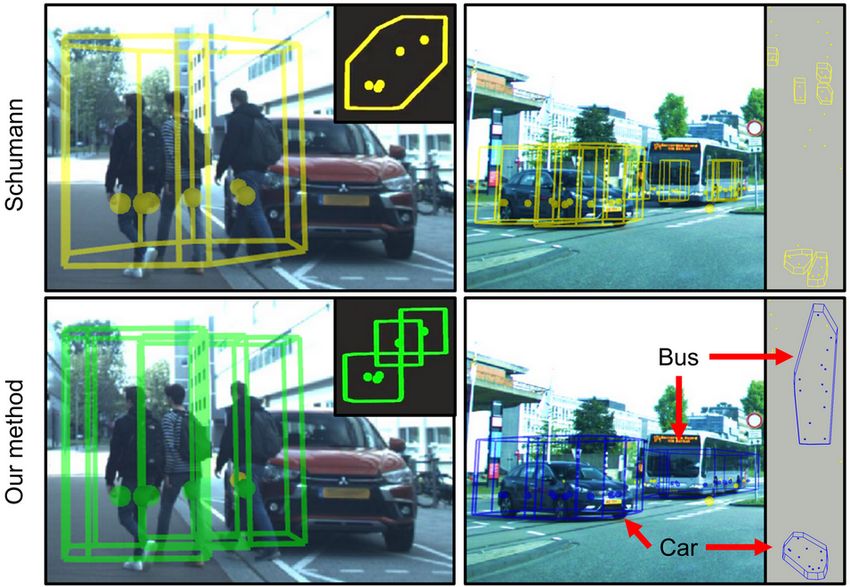
Method                       γxy         γv           M inP oints      vmin
                                                                     Prophet [1]                 1.2   m   1.3   m/s           2           0.4 m/s
                                                                     Schumann [2]                1.3   m   1.4   m/s           2           0.4 m/s
                                                                     Class-specific (peds.)      0.5   m   2.0   m/s           1              −
                                                                     Class-specific (cyclists)   1.6   m   1.5   m/s           2              −
                                                                     Class-specific (cars)       4.0   m   1.0   m/s           3              −

Fig. 4: Illustration of our        object-level metric. Intersec-    TABLE III: Optimized DBSCAN parameters for the two
tion and Union are defined          by number of radar targets.      baselines, and for our class-specific clustering for each class.
Intesection
   U nion    ≥ 0.5 counts as a     true positive. In this example,
there is a true positive cyclist   and a false positive pedestrian    Method                     Pedestrian      Cyclist     Car   Other     Avg.
detection.                                                            Prophet [1]                  0.61           0.58      0.34    0.91     0.61
                                                                      Schumann [2]                 0.67           0.68      0.46    0.92     0.68
                                                                      RTCnet (no low-level)        0.56           0.63      0.33    0.90     0.61
                                                                      RTCnet (no speed)            0.66           0.63      0.36    0.91     0.64
we also performed an ablation study to see how different              RTCnet (no RCS)              0.71           0.66      0.48    0.91     0.69
features benefit our method in this classification (adaptation        RTCnet (no ensemble)         0.67           0.65      0.47    0.89     0.67
in brackets). RTCnet (no ensemble) is a single, multi-class           RTCnet                       0.71           0.67      0.50    0.92     0.70
network to see if ensembling is beneficial. RTCnet (no RCS)
                                                                     TABLE IV: Target-wise F1 scores per class (best in bold).
is identical to RTCnet, but the RCS target-level feature is
                                                                     RTCnet outperforms the baselines on average. The ablation
removed to examine its importance. Similarly, in RTCnet (no
                                                                     study shows benefits of ensembling and using low-level data.
speed) the absolute speed of the targets is unknown to the
networks, only the relative speed distribution (in the low-level
data) is given. Finally, RTCnet (no low-level) is a significantly    step size 0.1 m/s) for both to define these static radar targets.
modified version as it only uses target-level features. That is,     All reported results for baselines were reached by using their
the first and second convolutional parts are skipped, and the        optimal settings, see Table III. M inP oints was set to two
radar targets are fed to the third fully connected part directly.    as in Prophet [1] (increasing it further would exclude almost
Note that in contrast to RTCnet (no speed), RTCnet (no low-          all pedestrians, see Table II). In Schumann [2] the authors
level) has access to the absolute speed of the target, but lacks     used manually corrected clusters (i.e. separating objects falsely
the relative speed distribution. Object clustering is skipped in     merged by DBSCAN) to focus on the classification. We did
the first experiment.                                                not correct them to examine real-life application possibilities.
   In the second experiment, we compare the methods in               We implemented a Random Forest classifier with 50 trees for
object detection task, examining our whole pipeline, including       both baselines, as Prophet [1] reported it to be the best for their
the object clustering step. Predictions and annotations are          features. Schumann [2] also tested LSTM, but used several
compared by their intersection and union calculated in number        frames aggregated as input.
of targets, see Fig. 4. A true positive is a prediction which
has an Intersection Over Union (IoU) bigger than or equal to
                                                                     B. Implementation
0.5 with an annotated object. Further detections of the same
ground truth object count as false positives.                           We set L = W = 5, H = 32 as the size of the
   All presented results were measured on moving radar targets       cropped block. Speed threshold to filter out static objects is
to focus on moving road users.                                       a sensor specific parameter and was set to 0.3 m/s based on
                                                                     empirical evidence. Table III shows the DBSCAN parameters
A. Baselines                                                         for both baselines and for our class-specific clustering step.
                                                                     The thresholds to merge clusters during object clustering were
   We selected Schumann [2] as baseline because it is the
                                                                     set to 1 m spatially, 0.6 for scores, 2 m/s for pedestrian to
only multi-object, multi-class detection method found with
                                                                     cyclist, and 1.2 m/s for pedestrian/cyclist to car merges.
small latency, see Table I. As no other research handled
                                                                        We normalized the data to be zero-mean and have a standard
multiple classes, we selected Prophet [1] as our second
                                                                     deviation of 1 feature-wise for r, α, vr , RCS, and for the
baseline, which is a single-class pedestrian detector, but the
                                                                     whole radar cube. At inference values calculated from training
negative training and testing set contained cars, dogs, and
                                                                     data are used. We used PyTorch [30] for training with a cross-
cyclists. We re-implemented their full pipeline (DBSCAN
                                                                     entropy loss (after softmax) in 10 training epochs. Inference
clustering and cluster-wise classification) and trained their al-
                                                                     time is ∼ 0.04 s on a high-end PC (Nvidia TITAN V GPU,
gorithms with our training set. Optimal DBSCAN parameters
                                                                     Intel Xeon E5-1650 CPU, 64 GB RAM), including all moving
are sensor specific (depending on density, resolution, etc.),
                                                                     radar targets, the 10 binary classifiers and the ensembling.
thus we optimized the threshold in spatial dimensions γxy
(0.5 m − 1.5 m, step size 0.1 m) and the threshold in velocity
γv (0.5−1.5 m/s, step size 0.1 m/s) on our validation set for        C. Results
both baselines independently. We used the same metric as in             1) Target classification: We present the results of the target
our object clustering. Both baselines have features describing       classification experiment in Table IV. Target-wise F1 scores
the number of static radar targets in the cluster. We also           for all classes and their macro-average are given for each
searched for an optimal speed threshold vmin (0 − 0.5 m/s,           method. RTCnet outperformed the two cluster-wise baselines
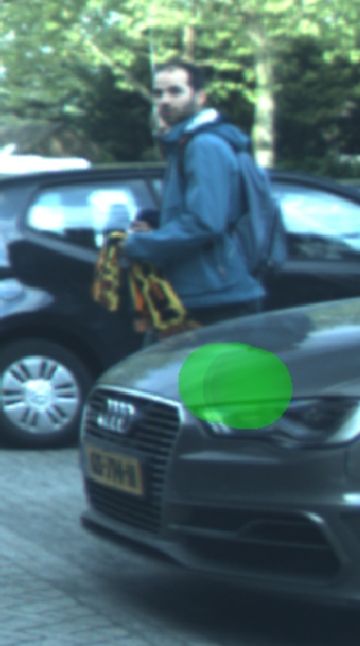
(a) (b) (c) (d) (e) (f) (g) (h)
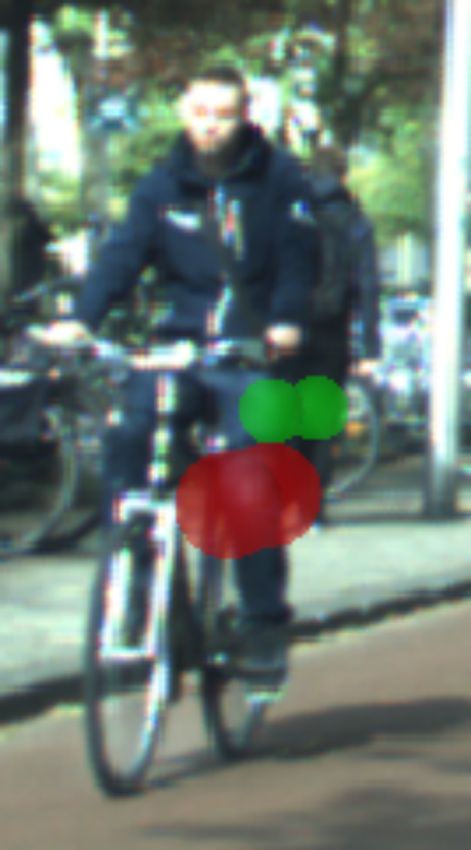
Fig. 5: Examples of correctly classified radar targets by RTCnet, projected to image plane. Radar targets with pedes-
trian/cyclist/car labels are marked by green/red/blue. Static objects and the class other are not shown.
0.8
Ped.
20,000
Biker
Number of targets
0.6
Car
F1 score
0.4
10,000
0.2
(a) (b) (c) (d)
0
0
Fig. 6: Examples of radar targets misclassified by RTCnet,
5
10
5
0
5
0
5
0
5
0
0-
-1
-2
-2
-3
-3
-4
-4
-5
caused by: flat surfaces acting as mirrors and creating ghost
5-
10
15
20
25
30
35
40
45
targets (a), unusual vehicles (b), partial misclassification of an
Range (m)
objects’ reflections (c), and strong reflections nearby (d).
Fig. 7: Target-wise F1 scores (lines) and number of targets in
training set (bars) in function of distance from ego-vehicle.
reaching an average F1 score of 0.70. Schumann [2] has
slightly better results on cyclists than RTCnet (0.68 vs 0.67),
1
but performed significantly worse on pedestrians (0.67 vs
0.71) and cars (0.46. vs 0.50). The ablation study showed that
0.8
removing each feature yields worse results than the complete
True positive rate
pipeline, but the one without reflectivity information (RTCnet
0.6
(no RCS)) comes close with an average of 0.69. Removing Ped.-Schumann
the low-level features (RTCnet (no low-level)) decreased the Biker-Schumann
0.4
performance significantly to an average of 0.61. The multi-
Car-Schumann
class (single) network RTCnet (no ensemble) outperforms the
Ped.-RTCnet
baselines on the car class, but performs worse on cyclists.
0.2
Biker-RTCnet
Ensemble voting brings significant improvement on all classes.
Car-RTCnet
Example of correct and incorrect target classifications are
0
shown on Fig. 5 and 6 for all road user classes. On Fig. 7 0 0.2 0.4 0.6 0.8 1
we show how the classification performance (target-wise F1
False positive rate
score) changes over distance (with 5 m bins) for each class,
along with the number of radar targets in the training set. Fig. 8: ROC curves of road user classes by our method
Although most annotation fall into the 5 − 20 m range, the and Schumann [2]. Each curve is calculated by changing the
network performs reasonably beyond that distance, especially decision threshold of a One-vs-All binary classifier.
for the larger objects (cyclist, car). We trained One-vs-All
classifiers both for RTCnet and Schumann [2] for each road
user class, and plotted their performance on receiver operating
0.31), and in average (0.56 vs 0.48). Fig. 9 shows how Schu-
characteristic (ROC) curves on Fig. 8. The varied threshold is
mann [2] and RTCnet handled two real-life cases from Fig. 2.
cluster-wise for Schumann [2] and target-wise for RTCnet. Our
Examples for both correct and incorrect object detections by
method has a larger area under the curve of all classes.
RTCnet are shown on Fig. 10. A link to a video of our results
2) Object detection: The results of our second experiment
can be found on our website2 .
are shown in Table V. RTCnet reached slightly worse results
on cyclists than Schumann [2] (0.59 vs 0.60), but significantly
outperformed it on pedestrians (0.61 vs 0.54), cars (0.47 vs 2 http://intelligent-vehicles.org/publications/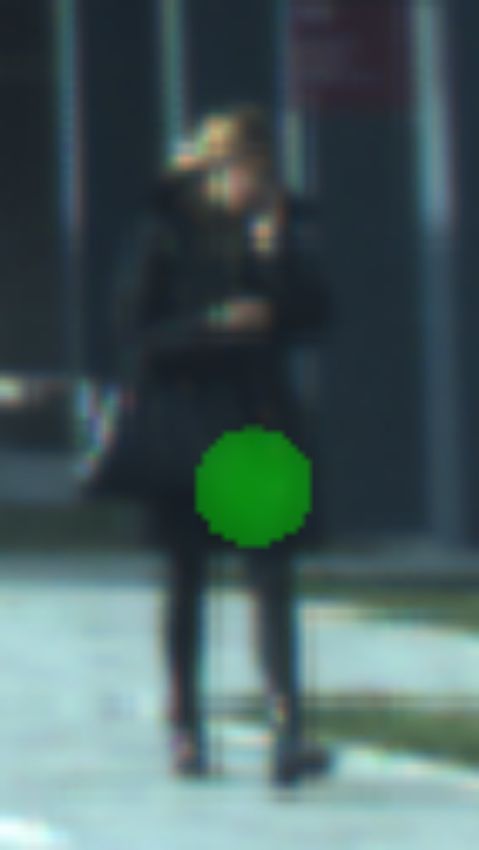
Pedestrian   Cyclist   Car    Avg.
         Prophet [1]       0.48        0.50     0.23   0.40
         Schumann [2]      0.54        0.60     0.31   0.48
         RTCnet (ours)     0.61        0.59     0.47   0.56

TABLE V: F1 scores object-wise (best score in bold). RTCnet
outperforms the baselines on average.

D. Discussion
   Our method outperformed the baselines in target classi-
fication mainly due to two reasons. First, the classification
does not depend on a clustering step. This decreases the
impact of cases shown in Fig. 2 and allows to handle objects
that contain a single radar target (a common occurrence,
especially for pedestrians, see Table II). Second, we included        Fig. 9: Challenging cases for clustering, camera and top view.
low-level radar data, which brings information of the speed           DBSCAN falsely split the car and the bus but merged the
distribution around the radar target. To demonstrate that this        pedestrians into a single cluster, making Schumann [2] (top)
inclusion is beneficial, we showed that only using target-level       fail. Our method (bottom) managed to classify the radar targets
data and only the third module of the network (RTCnet (no             and cluster them correctly using class-specific parameters.
low-level)) caused a significant drop in performance from             Yellow marks other class.
0.70 to 0.61 average F1 score. We examined the effect of
removing absolute speed from the data too with RTCnet (no
speed). While the performance dropped, our network was                γxy = 1.2 − 1.3 m found for the baselines. However, this
still able to classify the radar targets by the relative speed        radius fits bicycles well, which results in good performance
distribution around them. The results of RTCnet (no low-              on the cyclists class for Schumann [2] both on target-level and
level) and RTCnet (no speed) proves that the relative velocity        object-level. Fig. 9 shows two examples. DBSCAN falsely
distribution (i.e. the low-level radar data) indeed contains          separated the car and the bus into several clusters, but merged
valuable class information. Interestingly, excluding RCS value        the pedestrians into a single one using the optimized parame-
did not have a significant impact on the performance. Based           ters, which caused Schumann [2] to fail. Our method managed
on our experiments, an ensemble of binary classifiers results in      to classify each radar target individually and cluster them
less inter-class miss-classifications than using a single multi-      correctly (i.e. keep the vehicles in a single cluster, but separate
class network.                                                        the pedestrians) using the class-specific clustering parameters.
   Note that even VRUs in occlusion (see Fig. 5a, 5b, 5g)             Although we used DBSCAN in this paper, we expect this
are often classified correctly caused by the multi-path prop-         advantage to stand using different types of clustering. On Fig.
agation of radar [8]. This, and its uniform performance in            10a we show a single mis-classified radar target, probably
darkness/shadows/bright environments makes radar a useful             reflected by the speed bump. The resulting false positive
complementary sensor for camera. Typical errors are shown             pedestrian detection is trade-off of setting M inP oints to one
in Fig. 6. Radar is easily reflected by flat surfaces (e.g. side of   for pedestrians. As mentioned, cyclists and cars are often
cars) acting like mirrors, creating ghost targets. E.g. in Fig. 6a    confused. This is especially true if several cyclist ride side-
our ego-vehicle was reflected creating several false positives.       by-side, see 10a, since their radar characteristics (extension,
Fig. 6b is an example of hard to categorize road users. Many          speed, reflectivity) are car-like. Both errors usually occur for a
errors come from the confusion of car and cyclist caused by           single frame only, and can be alleviated by a temporal filtering
the similarity of their Doppler signature and reflectivity, see       and tracking system.
Fig. 6c. Fig. 6d shows that a strong reflection nearby can
mislead the classifier. Since our method does not throw away                VI. CONCLUSIONS AND FUTURE WORK
single targets in a clustering step, it has to deal with more noise      In this paper, we proposed a radar based, single-frame,
reflections than a cluster-wise method. However, the results in       multi-class road user detection method. It exploits class infor-
other class suggest that it learned to ignore them.                   mation in low-level radar data by applying a specially designed
   The combination of our network and the clustering step             neural network to a cropped block of the radar cube around
outperformed the baseline methods in the object detection             each radar target and the target-level features. A clustering
task. This is mainly because by swapping the clustering               step was introduced to create object proposals.
and classifying steps, classes can be clustered with different           In extensive experiments on a real-life dataset we showed
parameters. That is a significant advantage of our pipeline,          that the proposed method improves upon the baselines in
as instead of finding a single set of clustering parameters to        target-wise classification by reaching an average F1 score of
handle each class, we can tune them separately to fit each,           0.70 (vs. 0.68 Schumann [2]). Furthermore, we demonstrated
see Table III. This is especially useful in pedestrian and car        the importance of low-level features and ensembling in an ab-
classes, which are smaller/larger than the optimal spatial radius     lation study. We showed that the proposed method outperforms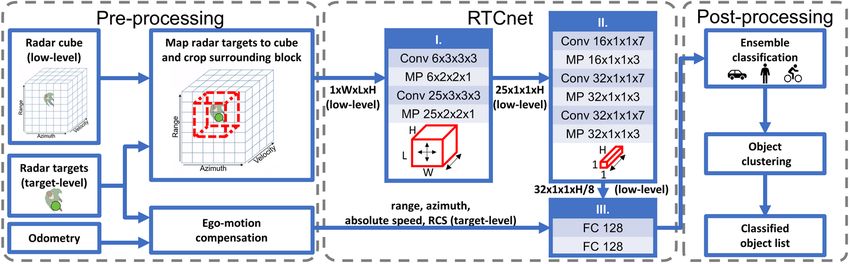
[10] R. Prophet, M. Hoffmann, A. Ossowska, W. Malik, C. Sturm, and
                                                                                      M. Vossiek, “Image-based pedestrian classification for 79 GHz auto-
                                                                                      motive radar,” 15th European Radar Conference (EuRAD 2018), pp.
                                                                                      75–78.
                                                                                 [11] O. Schumann, M. Hahn, J. Dickmann, and C. Wöhler, “Semantic
                                                                                      segmentation on radar point clouds,” 2018 21st International Conference
                                                                                      on Information Fusion (FUSION 2018), pp. 2179–2186.
                                                                                 [12] D. Brodeski, I. Bilik, and R. Giryes, “Deep radar detector,” arXiv e-
                                                                                      prints, p. arXiv:1906.12187, Jun 2019.
                                                                                 [13] R. Weston, S. Cen, P. Newman, and I. Posner, “Probably unknown:
                                                                                      Deep inverse sensor modelling radar,” in 2019 International Conference
                 (a)                                    (b)                           on Robotics and Automation (ICRA 2019), May, pp. 5446–5452.
                                                                                 [14] J. Lombacher, M. Hahn, J. Dickmann, and C. Wöhler, “Potential of radar
Fig. 10: Examples of correct and incorrect object detections                          for static object classification using deep learning methods,” 2016 IEEE
of our method. A mis-classified radar target triggered a false                        MTT-S International Conference on Microwaves for Intelligent Mobility
positive pedestrian detection on (a). Bicycles moving side-by-                        (ICMIM 2016).
                                                                                 [15] K. Patel, K. Rambach, T. Visentin, D. Rusev, M. Pfeiffer, and B. Yang,
side at the same speed are detected as a car on (b).                                  “Deep learning-based object classification on automotive radar spectra,”
                                                                                      2019 IEEE Radar Conference (RadarConf 2019).
                                                                                 [16] M. Ester, K. Hans-Peter, S. Jorg, and X. Xiaowei, “Density-based
                                                                                      clustering algorithms for discovering clusters,” Comprehensive Chemo-
the baselines overall in object-wise classification by yielding                       metrics, vol. 2, pp. 635–654, 2010.
an average F1 score of 0.56 (vs. 0.48 Schumann [2]).                             [17] O. Schumann, M. Hahn, J. Dickmann, and C. Wöhler, “Supervised
   Future work may include a more advanced object clustering                          clustering for radar applications: On the way to radar instance segmen-
                                                                                      tation,” 2018 IEEE MTT-S International Conference on Microwaves for
procedure, e.g. by training a separate head of the network to                         Intelligent Mobility (ICMIM 2018).
encode a distance metric for DBSCAN. Temporal integration                        [18] N. Scheiner, N. Appenrodt, and B. Sick, “A multi-stage clustering
and/or tracking of objects could further improve the method’s                         framework for automotive radar data,” 2019 IEEE 22nd Intelligent
                                                                                      Transportation Systems Conference (ITSC 2019).
performance and usability. Finally, extending the proposed                       [19] C. R. Qi, L. Yi, H. Su, and L. J. Guibas, “PointNet++: Deep hierarchical
framework to incorporate data from additional sensor modal-                           feature learning on point sets in a metric space,” in Advances in Neural
ities (e.g. camera, LiDAR) is worthwhile.                                             Information Processing Systems 30 (NIPS 2017), 2017, pp. 5099–5108.
                                                                                 [20] A. Danzer, T. Griebel, M. Bach, and K. Dietmayer, “2D car
                                                                                      detection in radar data with PointNets,” 2019. [Online]. Available:
                       ACKNOWLEDGEMENT                                                http://arxiv.org/abs/1904.08414
                                                                                 [21] D. Tahmoush and J. Silvious, “Radar micro-Doppler for long range
  This work received support from the Dutch Science Foun-                             front-view gait recognition,” in 2009 IEEE 3rd International Conference
dation NWO-TTW, within the SafeVRU project (nr. 14667).                               on Biometrics: Theory, Applications, and Systems, pp. 1–6.
                                                                                 [22] S. Okumura, T. Sato, T. Sakamoto, and T. Sato, “Technique of tracking
Andras Palffy was also funded by the Tempus Public Foun-                              multiple pedestrians using monostatic ultra-wideband Doppler radar
dation by means of a Hungarian Eotvos State Scholarship.                              with adaptive Doppler spectrum estimation,” 2016 International Sym-
                                                                                      posium on Antennas and Propagation (ISAP), pp. 320–321, 2016.
                                                                                 [23] R. Perez, F. Schubert, R. Rasshofer, and E. Biebl, “Single-frame
                              R EFERENCES                                             vulnerable road users classification with a 77 GHz FMCW radar sensor
                                                                                      and a convolutional neural network,” 2018 19th International Radar
 [1] R. Prophet, M. Hoffmann, M. Vossiek, C. Sturm, A. Ossowska, W. Ma-               Symposium (IRS 2018), pp. 1–10.
     lik, and U. Lbbert, “Pedestrian classification with a 79 GHz automotive     [24] N. Scheiner, N. Appenrodt, J. Dickmann, and B. Sick, “Radar-based
     radar sensor,” in 2018 19th International Radar Symposium (IRS 2018),            road user classification and novelty detection with recurrent neural
     pp. 1–6.                                                                         network ensembles,” in 2019 IEEE Intelligent Vehicles Symposium (IV
 [2] O. Schumann, M. Hahn, J. Dickmann, and C. Wöhler, “Comparison of                2019), pp. 722–729.
     random forest and long short-term memory network performances in            [25] E. Schubert, F. Meinl, M. Kunert, and W. Menzel, “Clustering of high
     classification tasks using radar,” Sensor Data Fusion: Trends, Solutions,        resolution automotive radar detections and subsequent feature extraction
     Applications (SDF), pp. 1–6, 2017.                                               for classification of road users,” in 2015 16th International Radar
 [3] N. Scheiner, N. Appenrodt, J. Dickmann, and B. Sick, “Radar-based                Symposium (IRS 2015), pp. 174–179.
     feature design and multiclass classification for road user recognition,”    [26] L. Ferranti, B. Brito, E. Pool, Y. Zheng, R. M. Ensing, R. Happee,
     in 2018 IEEE Intelligent Vehicles Symposium (IV 2018), pp. 779–786.              B. Shyrokau, J. F. P. Kooij, J. Alonso-Mora, and D. M. Gavrila,
 [4] E. Schubert, M. Kunert, A. Frischen, and W. Menzel, “A multi-                    “SafeVRU: A research platform for the interaction of self-driving
     reflection-point target model for classification of pedestrians by auto-         vehicles with vulnerable road users,” in 2019 IEEE Intelligent Vehicles
     motive radar,” 11th European Radar Conference (EuRAD 2014), pp.                  Symposium (IV 2019), pp. 1660–1666.
     181–184, 2014.                                                              [27] W. Liu, D. Anguelov, D. Erhan, C. Szegedy, S. Reed, C. Y. Fu, and A. C.
 [5] E. Schubert, F. Meinl, M. Kunert, and W. Menzel, “High resolution                Berg, “SSD: Single shot multibox detector,” Lecture Notes in Computer
     automotive radar measurements of vulnerable road users - pedestrians &           Science (including subseries Lecture Notes in Artificial Intelligence and
     cyclists,” in 2015 IEEE MTT-S International Conference on Microwaves             Lecture Notes in Bioinformatics), vol. 9905 LNCS, pp. 21–37, 2016.
     for Intelligent Mobility (ICMIM 2015).                                      [28] M. Braun, S. Krebs, F. Flohr, and D. M. Gavrila, “EuroCity Persons:
 [6] A. Angelov, A. Robertson, R. Murray-Smith, and F. Fioranelli, “Practi-           A novel benchmark for person detection in traffic scenes,” IEEE
     cal classification of different moving targets using automotive radar and        Transactions on Pattern Analysis and Machine Intelligence, vol. 41,
     deep neural networks,” IET Radar, Sonar & Navigation, vol. 12, no. 10,           no. 8, pp. 1844–1861, Aug 2019.
     pp. 1082–1089, 2018.                                                        [29] H. Hirschmüller, “Stereo processing by semi-global matching and mu-
 [7] J. Kwon and N. Kwak, “Human detection by neural networks using a                 tual information,” IEEE Transactions on Pattern Analysis and Machine
     low-cost short-range Doppler radar sensor,” 2017 IEEE Radar Confer-              Intelligence, vol. 30, pp. 328–341, 2008.
     ence (RadarConf 2017), pp. 0755–0760, 2017.                                 [30] A. Paszke, S. Gross, S. Chintala, G. Chanan, E. Yang, Z. DeVito, Z. Lin,
 [8] A. Palffy, J. F. P. Kooij, and D. M. Gavrila, “Occlusion aware sensor            A. Desmaison, L. Antiga, and A. Lerer, “Automatic differentiation in
     fusion for early crossing pedestrian detection,” in 2019 IEEE Intelligent        PyTorch,” in Advances in Neural Information Processing Systems 30,
     Vehicles Symposium (IV 2019), pp. 1768–1774.                                     Workshop (NIPS-W 2017).
 [9] K. Granström, M. Baum, and S. Reuter, “Extended object tracking:
     Introduction, overview, and applications,” Journal of Advances in In-
     formation Fusion, 2017.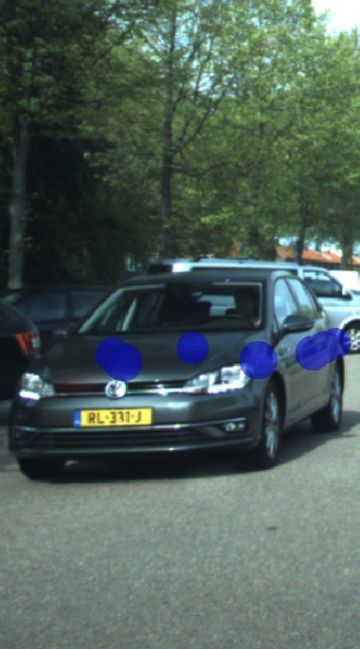
You can also read