CGE TRAINING MATERIALS ON VULNERABILITY AND ADAPTATION ASSESSMENT - Coastal Resources - unfccc
←
→
Page content transcription
If your browser does not render page correctly, please read the page content below
CGE TRAINING MATERIALS ON
VULNERABILITY AND
ADAPTATION ASSESSMENT

Coastal Resources
Outline

• Overview of potential drivers of climate change on the coastal zone

• Overview of impacts of climate change

• Methods for integrated assessment of coastal zones under climate change

• Associated tools and data requirements

• Adaptation planning in coastal zones

• Case Study

                                                                            2
Overview of potential drivers and impacts of climate change on the
coastal zone

                                                                     3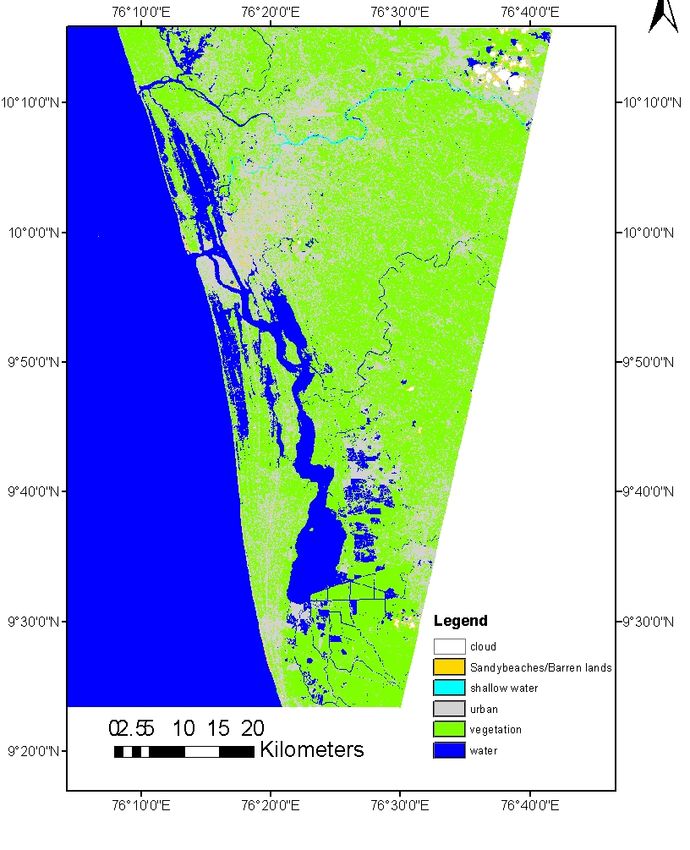
Climate change and coastal resources

• Coastal resources will be affected by a number of consequences of climate
  change, including:
  a) Higher sea levels
  b) Higher sea surface temperatures (SSTs)
  c) Changes in precipitation patterns and coastal run-off
  d) Changes in storm tracks, frequencies, and intensities
  e) Other factors such as wave climate, storminess, and land subsidence
     (non-climate)

• Climate variability such as extreme events and ENSO must also be
  considered

• Non-climate drivers are also significant

                                                                              4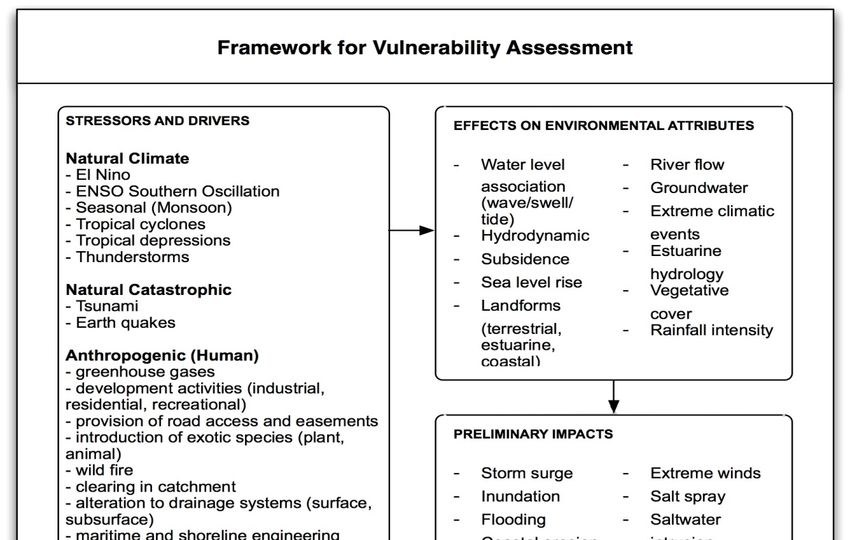
Coastal systems and climate change
From Chapter 5, IPCC AR5, WG II

                                     5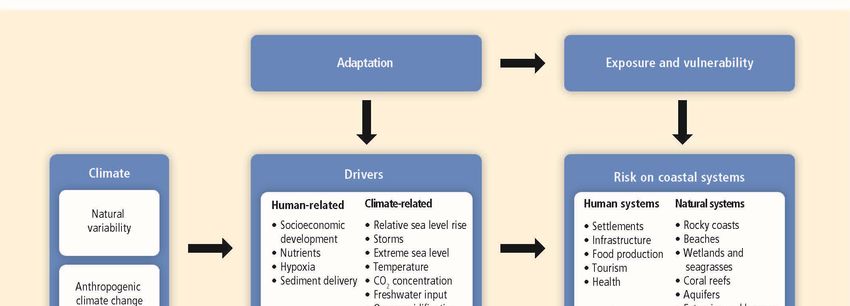
Coastal climate change drivers
Primary drivers of coastal climate change impacts, secondary drivers
and processes (adapted from NCCOE, 2004)
Primary driver Secondary or process variable
Mean sea level Local (relative) sea level
SST Local currents
CO2 concentration (ocean Local winds
acidification) Local waves
Wind climate Groundwater
Wave climate Coastal flooding
Rainfall/run-off Coastal morphodynamics
Ocean currents (erosion/accretion)
Air temperature Estuarine and coastal hydrodynamics
Coastal water quality
Ecological status, such as
o Wetlands (saltmarsh/mangroves)
o Coral reefs
o Sea grass
6
Potential Impacts

                    7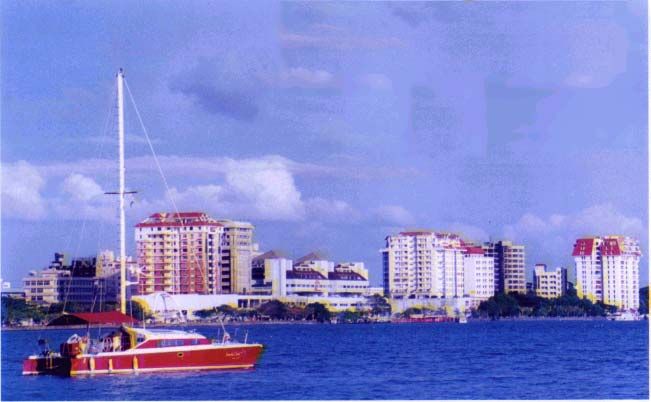
Climate change and coastal resources

• Coastal resources will be affected by a number of consequences of climate
  change, including:

  a)   Higher sea levels
  b)   Higher sea surface temperatures (SSTs)
  c)   Changes in precipitation patterns and coastal run-off
  d)   Changes in storm tracks, frequencies, and intensities
  e)   Other factors such as wave climate, storminess, and land subsidence
       (non-climate)

• Climate variability such as extreme events and ENSO must also be
  considered

• Non-climate drivers are also significant

                                                                              8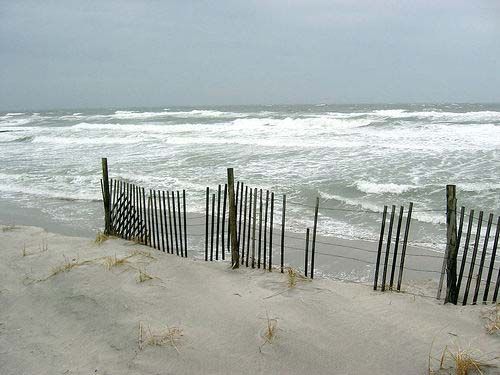
Higher Sea Level
Sea-level rise can cause more than flooding- 5 other impacts
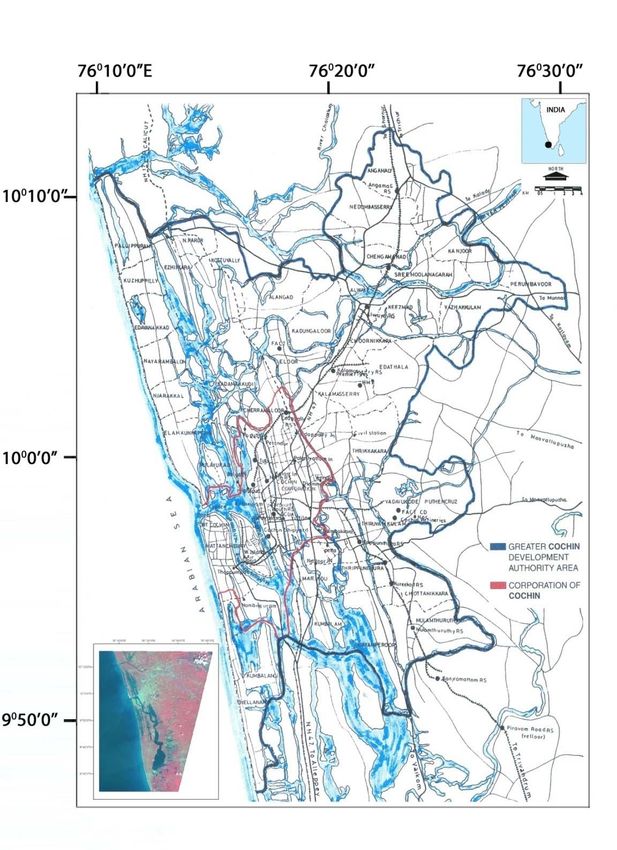
Can contaminate our drinking water
Can interfere with farming
Can change our coastal plant life
Can threaten wildlife populations
Can affect the economy
What makes the SLR more important is increasing
development in coastal areas.
SLR is a significant long-term climate change issue
that has important implications now and into the future
for us all, internationally, nationally or locally
9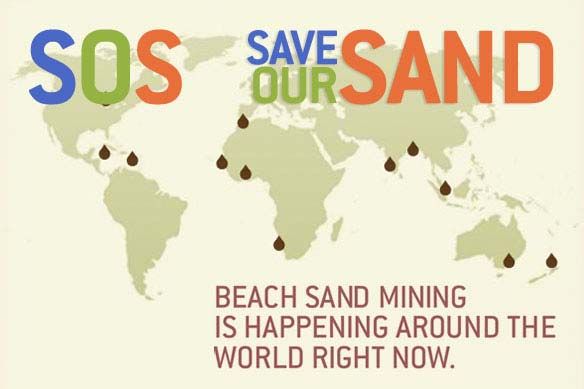
Wave Climate
Climate change may bring bigger waves for down under
Hemer, M. A et al., Nature Climate Change, 2013

Coasts will be exposed to increased risks. Coastal areas will be affected,
as waves shape beach profiles and morphology

implications for the fishing industry as well as for coastal mitigation efforts

The projected effects of climate change on wave heights are at least as
important for coastal impacts in many areas as increasing sea levels

                                                                                  10
The coastal system: Non-climate drivers
Taken from Nicholls et al. (2014)
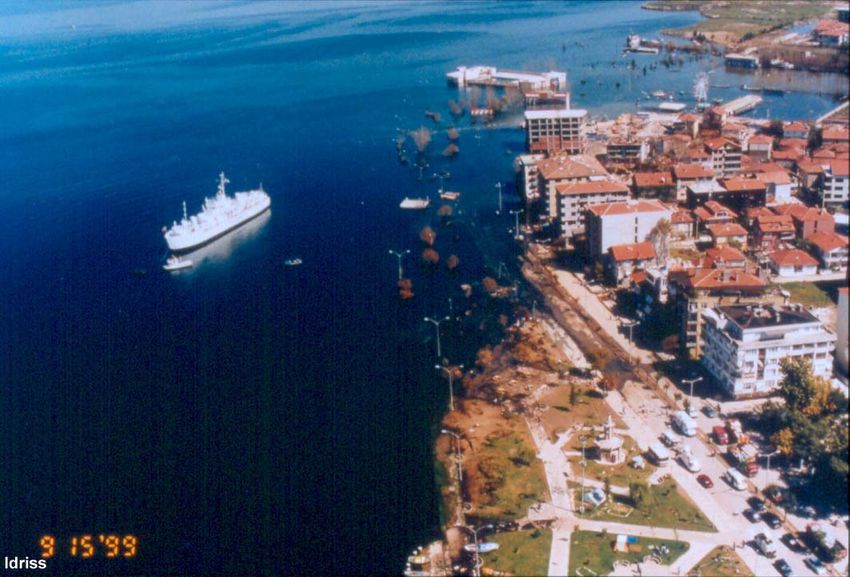
11Land subsidence
Sudden subsidence on the coast of
Turkey following an earthquake in 1999
12Science summary
• Under a high-emissions scenario (RCP8.5), SLR up to 1 m is plausible by
the end of the century: a rise of up to 2 m cannot be discounted for the
purposes of vulnerability and adaptation assessment.
• Higher mean sea level, possibly enhanced by bigger surges, will lead to
escalating risks of coastal inundation and flooding. Under the highest SLR
scenario, by mid-century, inundations that previously occurred once every
hundred years could happen several times a year.
• SLR will not stabilize by 2100. Regardless of reductions in greenhouse gas
emissions, sea level will continue to rise for centuries; an eventual rise of
several meters is possible even with strident climate mitigation.
13Some Climate Change Factors
Timeframe Cause Predictability
Net extreme Recurring Hour–days Wave, wind, Moderate to
event extremes (storm storms uncertain
hazards surge/tide)
Tide ranges Daily–yearly Gravitational Predictable
cycle
Regional sea level Seasonal– Wave climate, Moderate;
variability decadal ENSO, PDO Not well known
Net regional Regional net land Decades– Tectonic Predictable once
mean sea movement millennia measured
level rise
(SLR) Regional SLR Months–- Ocean warm/ Observable;
decades current/climate future uncertain
Global mean SLR Decades – Climate Short term
centuries change (temp, understandable;
ice melt) future uncertain
14Overview of impacts of climate change
15Biophysical impacts of climate change
Climate driver Main physical/ecosystem
(trend) effects on coastal ecosystems
(CO2) concentration Increased CO2 concentration, decreases ocean acidification negatively
impacting coral reefs and other pH
Surface sea temperature Increased stratification/changes circulation; reduced incidence of sea
(SST) (I, R) ice at higher latitudes; increased coral bleaching and mortality; pole-
(I: increasing, R: Regional ward species migration; increased algal blooms
variability)
Sea level (I, R) Inundation, flood and storm damage; erosion; saltwater intrusion; rising
water tables/impeded drainage; wetland loss (and change)
Storm intensity (I, R) Increased extreme water levels and wave heights; increased episodic
erosion, storm damage, risk of flooding and defence failure
Storm frequency (?, R); Altered surges and storm waves, and hence risk of storm damage and
Storm track (?, R) flooding
Wave climate Altered wave conditions, including swell; altered patterns of erosion
and accretion; re-orientation of beach plan form
Run-off (R) Altered flood risk in coastal lowlands; altered water quality/salinity;
altered fluvial sediment supply; altered circulation and nutrient supply
16Impacts of sea level rise, including interacting factors
Interacting factors
Biophysical impact Climate Non-climate
1. Inundation, a. Surge Wave/storm climate Sediment supply
flood and storm (sea flooding) Erosion Flood management
damage Sediment supply Erosion
Land reclamation
b. Backwater effect Run-off Catchment management
(river flooding) Land use
2. Wetland loss (and change) CO2 fertilisation of Sediment supply
biomass production Migration space
Sediment supply Land reclamation
Migration space
3. Erosion (of “soft” morphology) Sediment supply Sediment supply
Wave/storm climate
4. Saltwater a. Surface Waters Run-off Catchment management
Intrusion Land use
b. Ground-water Rainfall Land use
Aquifer use
5. Rising water tables/ impeded drainage Rainfall Land use
Run-off Aquifer use
Catchment management
After Nicholls (2010)
17Potential Impacts
Effect category Example effects on the coastal Environment
Bio-geophysical Displacement of coastal lowlands and wetlands
Increased coastal erosion
Increased flooding
Salinization of surface groundwater
Socio-economic Loss of property and lands
Increased flood risk/loss of life
Damage to coastal infrastructures
Loss of renewable and subsistence resources
Loss of tourism and coastal habitants
Impacts of agriculture/aquiculture and decline soil and
water quality
18Example Effects of Climate Change on the Coastal Zone (continued)
Effect category Example effects on the coastal Environment
Secondary impacts Impact on livelihoods and human health
of accelerated SLR Decline in healthy/living standards as a result of decline
in drinking water quality
Threat to housing quality
Infrastructure and Diversion of resources to adaptation responses to SLR
economic activity impacts
Increasing protection costs
Increasing insurance premiums
Political and institutional instability, and social unrest
Threats to particular cultures and ways of life
19Impacts of sea level rise, including interacting factors
Interacting factors
Biophysical impact Climate Non-climate
1. Inundation, a. Surge Wave/storm climate Sediment supply
flood and storm (sea flooding) Erosion Flood management
damage Sediment supply Erosion
Land reclamation
b. Backwater effect Run-off Catchment management
(river flooding) Land use
2. Wetland loss (and change) CO2 fertilisation of Sediment supply
biomass production Migration space
Sediment supply Land reclamation
Migration space
3. Erosion (of “soft” morphology) Sediment supply Sediment supply
Wave/storm climate
4. Saltwater a. Surface Waters Run-off Catchment management
Intrusion Land use
b. Ground-water Rainfall Land use
Aquifer use
5. Rising water tables/ impeded drainage Rainfall Land use
Run-off Aquifer use
Catchment management
Nicholls, 2010
20Biophysical Impacts
Climate driver (trend) Main physical/ecosystem effects on coastal
ecosystems
(CO2) concentration Increased CO2 concentration, ocean acidification negatively
impacting coral reefs and other pH
Surface sea temperature Increased stratification/changes circulation; reduced incidence of
(SST) (I, R) sea ice at higher latitudes; increased coral bleaching and mortality;
(I: increasing, R:Regional pole-ward species migration; increased algal blooms.
variability)
Sea level (I, R) Inundation, flood and storm damage; erosion; saltwater intrusion;
rising water tables/impeded drainage; wetland loss (and change)
Storm intensity (I, R) Increased extreme water levels and wave heights; increased
episodic erosion, storm damage, risk of flooding and defence
failure
Storm frequency (?, R); Altered surges and storm waves, and hence risk of storm damage
Storm track (?, R) and flooding
Wave climate Altered wave conditions, including swell; altered patterns of erosion
and accretion; re-orientation of beach plan form
Run-off (R) Altered flood risk in coastal lowlands; altered water quality/salinity;
altered fluvial sediment supply; altered circulation and nutrient
supply.
21Threats to the Coastal Environment
22Threats to Coastal Environment (continued)
23Threats to Coastal Environment (continued)
24Vulnerable Regions Mid-estimate by the 2080s
Caribbean
Pacific A B
Oc ean
SMALL C Indian
ISLANDS C
Oc ean
SMALL
PEOPLE ATRISK ISLANDS
(millions per region)
A > 50 million
B 10 - 50 million
C < 10 million
region boundary
vulnerable island region
25Vulnerable regions by type
• Small islands
• Deltaic areas
• Coastal cities
• Coastal wetlands and other ecosystems
• Geographically
26Methods for integrated assessment of coastal zones under climate
change
27Three levels of assessment are suggested
Level of Time-scale Precision Prior Issues considered
assessment knowledge
1. Screening 2–3 Lowest Low Define the key issues and directions
assessment months of change in broad qualitative or semi-
quantitative terms. Strong focus on
(issue sea level rise.
scoping)
2. Impact 1–2 years Medium Medium Building on the screening
assessment assessment, impacts are quantified,
including the possible role of other
(initial impact climate change and non-climate
and drivers. The adaptive capacity should
adaptation be considered.
assessment)
3. Planning Ongoing Highest High Building on impact assessment, more
assessment (as part of comprehensive assessments are
adaptation conducted considering all relevant
(linking to processes) drivers (using multiple scenarios to
wider coastal explore uncertainty). Adaptation is
management) integral.
28Assessment Level 1: Screening assessment
• A rapid assessment to highlight possible impacts of a sea level rise and
identify information/data gaps
• Qualitative or semi-quantitative
• Steps
a) Collation of existing coastal data
b) Assessment of the possible impacts
(using a 1-m sea level rise scenario)
c) Implications of future development
d) Consider possible responses
29Step 1: Collation of existing data
• Topographic surveys
• Aerial/remote sensing images – topography/land cover
• Coastal geomorphology classification
• Evidence of subsidence
• Long-term relative sea level rise
• Magnitude and damage caused by flooding
• Coastal erosion
• Population density
• Activities located on the coast (cities, ports, resort areas and tourist
beaches, industrial and agricultural areas)
30Step 2: Assessment of possible impacts of 1-m sea level rise
• Four main impacts are considered, although other issues can be
introduced if desired:
a) Increased storm flooding
b) Beach/bluff erosion
c) Wetland and mangrove inundation and loss
d) Salt water intrusion
e) Others????
31(i) Increased storm flooding
• Describe what is located in flood-prone coastal areas
• Describe historical floods, including location, magnitude and damage, the
response of the local people, and the response of government
• How have policies towards coastal flooding evolved?
32(ii) Beach/bluff erosion
• Describe what is located within 300 m of the ocean coast.
• Describe beach types.
• Describe the various livelihoods of the people living in coastal areas such
as commercial fishers, international-based coastal tourism, or subsistence
lifestyles.
• Describe any existing problems of beach erosion including quantitative
data. These areas will experience more rapid erosion given accelerated
sea-level rise.
• For important beach areas, conduct a Bruun rule analysis (Nicholls, 1998)
to assess the potential for shoreline recession given a
1-m rise in sea level – assume retreat is 100 times the rise in sea level.
• What coastal infrastructure might be impacted by such recession?
33(iii) Wetland and mangrove inundation
• Describe the wetland areas, including human activities and resources that
depend on the wetlands. For instance, are mangroves being cut and used,
or do fisheries depend on wetlands?
• Have wetlands or mangroves been reclaimed for other uses, and is this
likely to continue?
• Are these wetlands viewed as a valuable resource for coastal fisheries and
hunting or merely thought of as wasteland?
34(iv) Salt water intrusion
• Is there any existing problem with water supply for drinking purposes?
• Does it seem likely that salinization due to sea-level rise will be a problem
for surface and/or subsurface water?
35Step 3: Implications of future developments
• Possible examples include:
a) New and existing river dams and impacts on downstream deltas
b) New coastal settlements
c) Expansion of coastal tourism
d) Possibility of transmigration
e) Others?
36Step 4: Responses to the sea level rise impacts
• What adaptation responses might be considered, recognising that there
are three major types of response
a) Protect (i.e., hard and soft defences, seawalls, beach nourishment)
b) Accommodate (i.e., raise buildings above flood levels)
c) Planned retreat (i.e., setback of defenses)
37Screening assessment matrix (biophysical vs. socioeconomic impacts)
Socio-economic impacts
Financial services
Human health
Others (add)?
Water supply
settlements
Agriculture
Fisheries
Tourism
Gender
Human
Biophysical
impacts
Inundation
Erosion
Flooding
Salinization
Others (add)?
38Assessment Level 2: Impact assessment
• Building on screening assessment, impacts are quantified, including other
climate change and non-climate drivers. Adaptation responses and
adaptive capacity should be explicitly considered. Duration: 1–2 years.
• Issues:
I. Erosion
II. Flooding
III. Coastal wetland/ecosystem loss
IV. Other issues?
39Coastal Vulnerability Assessment
Nicholls, 2002
40Impact Assessment
Three levels of assessment are suggested
Level of Timescale Precision Prior Other scenarios in
assessment required knowledge addition to SLR
Strategic level 2-3 months Lowest Low Direction of change
(screening
assessment)
Vulnerability 1-2 years Medium Medium Likely socio-economic
assessment scenarios and key
scenarios of key
climate drivers
Site-specific Ongoing Highest High All climate change
level (planning drivers (often with
assessment) multiple scenarios)
41Impact assessment
Source: Kay et al (2006)
42(i) Impact assessment: Beach erosion
43..Human factors outweigh…
Sediment Budget Shorelines are subjected to
The existence of a sandy beach
change, with the ocean
depends on the balance between the
power in waves and currents and the
eroding landward as well as
sediment available for transport. This building seaward. Underlying
balance or budget is calculated from the seasonal damage caused by
the sediment flux contributions and natural occurrences one could
losses to the cell. find that human factors,
unwise planning and man-made
Much like a bank account, there are modifications contributed to the
deposits (sediment flux from streams), problem.
withdrawals (loss to shelf and
submarine canyons), and the balance
(sand in transport along the beach).
44SLR will be a inexorable cause of beach erosion
Eos, Transactions American Geophysical Union , Vol. 81, Issue 6, 2011
Sea Level Rise Shown to Drive Coastal Erosion
The link is highly multiplicative , with the long-term shoreline retreat rate averaging
about 150 times that of sea level rise
SLR will be a inexorable cause of beach erosion in shoreline revision zones of
man made structures
45(ii) Impact assessment: Coastal flooding
• Increase in flood levels due to rise in sea level
• Increase in inundation probability and flood risk (e.g., damage per events
and year)
• Increase in populations in coastal floodplain
• Adaptation:
a) Increase in flood protection
b) Management and planning in the floodplain
46(iii) Impact assessment: Wetland/ecosystem loss
• Inundation and displacement of wetlands, e.g., mangroves, saltmarsh,
intertidal areas
a) Wetlands provide:
• Flood protection
• Nursery areas for fisheries
• Important areas for nature conservation
• Loss of valuable resources, tourism
47Coastal squeeze (of coastal wetlands)
Coastal squeeze under SLR: wetlands are squeezed between the rising sea level and
fixed (and protected) human development (Image: DCCEE, 2009)
48Assessment Level 3: Planning assessment
• Building on impact assessment, more comprehensive assessments are
conducted considering all relevant drivers
• Uncertainty analysis is essential
• Understanding adaptation is integral
• Needs to be embedded in wider coastal management processes –
mainstreaming the activity
49Method for planning assessment
Scenarios Analysis Overall
Assessment
Climate Change, Regional
Sea-Level Rise Wave/Surge
Scenarios Models
SCAPE
Flood
Regional
Risk Analysis
Morphological
(LISTFLOOD-FP)
Model
Integrated
Protection, Cell-scale
Socio-economic Assessment
Scenarios
SCAPE GIS Cliff Erosion
Data Storage Analysis
50Results
• The more you protect the cliffs (lower erosion risk), the more the flood risk
increases in the coastal lowlands
• Erosion damage is much smaller than flood damage, so managing flood
risk is a priority
• If the coast is allowed to erode under rising sea levels, cliff-top land and
properties are lost, but the sediment produced is sufficient to maintain wide
beaches, greatly minimise flood risk
• This research emphasises the important trade-offs in coastal management
under changing climate, which need to be assessed more widely
51Associated tools and data requirements
52Tools for vulnerability and adaptation assessment
Examples associated with the UNFCCC Compendium
Method Strengths Limitations
Shoreline Widespread application around the Requires customization to individual coastal
planning world’s coasts in coastal zone management administrative systems.
method management based on a one-
dimensional data model (Box 5-1)
Coastal Generally easily calculated and Requires customization of variables for case-
vulnerability employed for rapid vulnerability by-case use.
indices (CVI) assessment
Dynamic Provides an overview of climatic Provides coarse-scale resolution of potential
interactive and socio-economic scenarios and coastal impacts at a national scale, some
vulnerability adaptation policies on regional and limited perspectives on vulnerability of the
analysis (DIVA) global scales. Could be downscaled coast to climate change. Downscaling requires
providing a useful database significant data collection and is not well
resource documented (not currently available for
download).
CoastClim and Commercial decision-making aid for Requires purchase.
SimClim changed climate conditions
Smartline Cost effective and rapid geomorphic Adaptation to local and site-specific scale will
mapping of coastal sensitivity; require testing and validation.
applicable at multiple scales
53Example datasets
Category Title Description Link
Sea-level data Permanent Service The PSMSL is the global data bank for http://www.psmsl.org/
for Mean Sea long-term sea-level change information
Level (PSMSL) from tide gauges and bottom pressure http://ilikai.soest.hawai
recorders around the globe i.edu/uhslc/data.html/
Sea-level data Global Sea Level The GLOSS provides data from http://www.gloss-
Observing System 290 sea-level stations around the world sealevel.org/
(GLOSS) for long-term climate change and
oceanographic sea-level monitoring
Remotely Land Process The LP DAAC is a component of https://lpdaac.usgs.go
sensed Distributed Active NASAs Earth Observing System Data v/data_access/
topography data Archive Centre (LP and Information System (EOSDIS) that
DAAC) processes, archives and distributed
land data and products derived from
EOS sensors
Remotely Shuttle Radar The SRTM is a NASA project providing http://www2.jpl.nasa.g
sensed Topography high-resolution digital topographic ov/srtm/
topography data Mission (SRTM) database of the Earth, excluding the
high latitudes
Oceanographic NOAA National The NODC provides global and http://www.nodc.noaa.
drivers Oceanographic regional data on a range of oceanic gov/
Data Center drivers and parameters
(NODC)
54Adaptation planning in coastal zones
55Adaptation
• Mitigation and/or adaptation?
• Socio-economic systems in coastal zones also have the capacity to
respond autonomously to climate change
• Farmers may switch to more salt-tolerant crops, people may move out of
areas increasingly susceptible to flooding, and property prices may change
– autonomous adaptation
• Because impacts are likely to be significant, even considering autonomous
adaptation, planned adaptation is needed
56Planned adaptation to sea level rise
57Example approach to adaptation measures
• Caribbean small island developing country
• Climate change predictions:
a) Rise in sea level
b) Increase in number and intensity of tropical weather systems
c) Increase in severity of storm surges
d) Changes in rainfall
e) Reclamation of land, sand mining, and lack of comprehensive natural
system engineering approaches to control flooding and sedimentation
have increased the vulnerability to erosion, coastal flooding and storm
damage in Antigua
58Example approach to adaptation measures (cont.)
• Coastal impacts:
a) Damage to property/infrastructure – particularly in low-lying areas,
which can affect the employment structure of the country
b) Damage/loss of coastal/marine ecosystems
c) Destruction of hotels and tourism facilities – create psychological
effects to visitors
d) Increased risk of disease – increased risk of various infectious
diseases, increased mental and physical stress
e) Damage/loss of fisheries infrastructure
f) General loss of biodiversity
g) Submergence/inundation of coastal areas
59Example approach to adaptation measures (cont.)
• Adaptation (retreat, protect, accommodate):
a) Improved physical planning and development control
b) Strengthening/implementation of Environmental Impact Assessments
(EIA) regulations
c) Formulation of Coastal Zone Management Plan
d) Monitoring of coastal habitats, including beaches
e) Formulation of national climate change policy
f) Public awareness and education.
60Adaptation options related to goals
Source: U.S. EPA, 2008
61Adaptation planning, integration, and mainstreaming
• Coastal managers, stakeholders and decision -makers can use the
following range of criteria in deciding the best adaptation option within a
given local context:
a) Technical effectiveness: How effective will the adaptation option be in
solving problems?
b) Costs: What is the cost to implement the adaptation option and what
are the benefits?
c) Benefits: What are the direct climate change-related benefits?
• Does taking action avoid damages to human health, property, or
livelihoods?
• Or, does it reduce insurance premiums?
• Implementation considerations:
a) How easy is it to design and implement the option in terms of level of
skill required, information needed, scale of implementation, and other
barriers?
• Most adaptation measures can help in achieving multiple objectives and
benefits. “No regrets” measures should be the priority.
62Case Study
IMPLICATIONS OF SEA LEVEL
RISE SCENARIOS ON LAND
USE/ LAND COVER CLASSES
OF THE COASTAL ZONES OF
COCHIN, INDIA
63Journal of Environmental M a n a g e me n t 14 8 (2015 ) 12 4e 13 3
Contents lists available at ScienceDirect
Journal of Environmental Man a g em en t
j o u r n a l h omep ag e : w w w . e l s evier.com/locate/je n vm a n
Implications of sea level rise scenarios o n land use /land cover classes of t h e
coastal zones of Cochin, India
a, * b
R. Mani M u rali , P.K. Dinesh Ku m a r
a
CSIR-National Institute of Oceanogra p h y, Dona Paula, Goa 4 0 3 0 0 4, India
b
Regional Centre, CSIR-National Institute of Oceanogra p h y, Kochi, India a b s t r a c t
Article history: Physical responses of t h e coastal z o n es in t h e vicinity of Cochin, India d u e t o sea level rise a r e investi- gated based on
Receive d 15 July 2 013 analysis of in u n d a t i o n s cena rios. Quantifi cation of p o tentia l habita t loss w as m a d e b y m e r g ing t h e Land use/La n d
Receive d i n revise d f o r m
cover (LU/LC) p r e p a r e d from t h e satellite i magery w i t h t h e digital elevation m o d e l. Scenarios w e re g e n e ra t e d for t w o
21 M a r c h 2 014
different r a tes of sea level rise a n d responses of changes occurr e d w e re m a d e t o ascertain t h e vulne rability a n d loss
Accept e d 10 June 2 014
Available o n l i n e 16 July 2 014 in extent. LU/LC classes overlaid o n 1 m a n d 2 m elevatio n s h ow e d t h a t it w as mostly cover e d by vegetation areas followed
by w at e r a n d urb a n zones. For t h e sea level rise scenarios of 1 m a n d 2 m , t h e total i n u n d ation zo n es w e r e
e s t i ma t e d t o b e
169.11 k m 2 a n d 59 8.83 k m 2 respectively u sing Geographic Inform ation Syste m (GIS). The losses of u r b a n areas w e re
estimated at 43 k m 2 a n d 187 km 2 for t h e 1 m a n d 2 m sea level rise respectively w h ich is alarm ing information for
t h e m o s t densely p o p u lated state of India. Q ua ntitativ e c o mp a r ison of o t h e r LU/ LC classes s h ow e d signifi ca n t c ha n ges
u n d e r e ac h of t h e in u n d a t i o n scenarios. The results o b t a i n ed conclusively po in t t h a t sea level rise scenarios will b ring
p ro fo und effects o n t h e land use a n d land cover classes as well as o n coastal landfo r ms in t h e s t ud y region. Coastal
in u n d a t i o n w o u l d leave ocea n front a n d i nl and pro perti es vulnerable. Increase in t h e s e w ater levels w o u l d alter t h e
coasta l drainage gra- dients. Red u ction in these gradients w o u l d in crease fl ooding attributa ble to rainsto r ms w h ich
could p r o m ot e salt w a t er in trusion into coasta l a q uifers an d force w a t e r tables t o rise . Changes in t h e coastal landfo r m s
associated w i t h i n u n d ation g e n e ra t e conce r n in t h e background t h a t t h e coastal region ma y continue to r e ma i n
vulnerable in t h e c o min g decades d u e t o p o p u lation g r o w t h a n d d e v e l o p me n t pressures.
1. I n t roduction
Global sea level rise (SLR) ranging from 0.5 m to 2 m has been p redicted
over the n ext century a n d it w ould disrupt t he p hysical p rocesses, * C o r r e s p o n d i n g a u t h o r.
economic activities a n d social systems in t he coastal zones (Gommes et E-mail ad d resses: m m u r a i @ n i o.org, n i o m u r ali@gmail.com (R. M a n i M u r ali),
al., 1997; NOAA Report, 1999; Solomon et al., 20 07). Besides the destruction p k d i n e s h k u ma r @ ya h o o . c o m (P.K. D i n e s h Ku ma r ) .
t h ro ug h increased rates of erosion, sea level rise situations increase the
risk of inundation (Nicholls et al., 1999). Among the different impacts of
climate change, sea level rise raise mu c h concern mainly d ue to the
direct p hysical impact of inundation a n d pot e n tial habitat loss. A
co mparative analysis o n the impact of perma ne nt inundation due to sea
level rise o n 84 countries of the w orld revealed tha t h u n d reds of millions © 2 014 Elsevier Ltd. All rights reserved.
h t t p : / / d x . d o i . o r g / 10.1016 / j . j en v m a n .2014.0 6.010
0 3 01 - 47 97 / © 2 014 Elsevier Ltd. All ri g h ts r e s e rved.
64Background
The effects of Climate Change are placing coastal communities at increasing
risk of inundation. Variations resulting will be site specific and depending on
coastal configuration
Sustainable development relies upon effective management of the risk of
Inundation
Aims to provide an example of good practice in preparedness for and
awareness of sea level related hazards
Elements, approaches and tools used could be replicated for similar
conditions, or to provide a basis more appropriate for other regions to create
safer coasts in future
May provide insights and lessons managers, policy makers, development
planners at national/local levels
65Presentation Orientation
Genesis
Case study
Environmental setting
Methodology
Results
Implications, Impacts
Significant impact concerns
Information gains and future
66Genesis
Coastal Cities - Grown dramatically over the past 50 years, a trend that is
projected to continue into the foreseeable future, stimulated by the
expanding economy, stresses fragile but important ecosystems.
Urbanization, Population growth, Expansion of economic activities,
Environmental and resource over use
Added up problem: CLIMATE CHANGE
Wider Perspectives - An opportunity than a problem
Will show measures to reduce vulnerabilities
Related to actions that promote urban development for the future – not
just in theory
67…Genesis
Conceptual framework of relative environmental constancy and planning
Inadequacy of short term economic planning in terms of achieving
sustainable development
Stress on: ‘climate change’ component
Need to review the planning processes to incorporate the elements of
environmental changes into future development planning
The change in perspective is now nowhere more important than in human
use in coastal cities
68Case Study
Srinagar
J&K
Jammu
India
Himachal
0 Miles 300
Pradesh
Shimla
Chandigarh
Punjab
Arunachal
Haryana Pradesh
Delhi
Sikkim
Uttar Pradesh
Jaipur Lucknow
Guwahati Assam
Nagaland
Rajasthan Patna
Meghalava
Bihar Manipur
Gandhinagar Mizoram
Bhopal Calcutta
Madhya Pradesh Tripura
Gujarat
West
Bhubaneshwar Bengal
Maharashtra Orissa
Mumbai
(Bombay)
Hyderabad
Andhra
Karnataka
Pradesh
Goa
Chennai
Bangalore (Madras)
Port Blair
Lakshadweep Pondicherry Andaman and
Tamil Nadu Nicobar Islands
KERALA
Kerala
Thiruvananthapuram
(Trivandrum)
SRI
LANKA
69Physical Setting
Cochin - Largest city, along the west coast after Mumbai.
High Population density, Most Industrialized
Major rivers; chain of brackish water bodies - Largest of its
kind on the west coast of India
Support fishery, avian fauna, mangroves, agriculture,
recreation, tourism, inland navigation
Finest natural harbor Indispensable medium for living
Significant role in the socio-economic/cultural history
70…Physical Setting
71….Physical Setting
72Methodology
Inundation mapping and analysis of flooding impacts demands data on
land surface elevations, land use and land cover
Quantification of potential habitat loss can be estimated by merging the
land use /land cover with the digital elevation model
IRS P6 LISS-3 image of 2007 has been used for deriving the different land
use/ land cover classes and SRTM digital elevation model is used to
extract the different elevation areas. Topo-sheets were geo-referenced
and mosaic using image processing software ERDAS 9.1
Supervised classification was used to generate the land use and land
cover map of the region. Different land use and land cover classes within
the area of inundation due to sea level rise and different water level rise
scenarios were demarcated
73Results
74…Results
76°7'0"E 76°12'30"E 76°18'0"E 76°23'30"E 76°29'0"E 76°34'30"E 76°40'0"E
10°17'0"N 10°17'0"N
10°11'30"N 10°11'30"N
10°6'0"N 10°6'0"N
10°0'30"N 10°0'30"N
9°55'0"N 9°55'0"N
9°49'30"N 9°49'30"N
9°44'0"N 9°44'0"N
9°38'30"N 9°38'30"N
9°33'0"N 9°33'0"N
9°27'30"N 9°27'30"N
25
9°22'0"N Kilometers 9°22'0"N
76°7'0"E 76°12'30"E 76°18'0"E 76°23'30"E 76°29'0"E 76°34'30"E 76°40'0"E
75Impacts, Implications
Increased risk of flooding, direct physical impact of inundation and potential
habitat loss
Existing intertidal area to become permanently submerged.
Slope is critical
Sediment redistribution
Sediment availability to override first order effects
Destruction of barrier lands
Ocean front structures to be more vulnerable
Scenarios:
Coincides with those observed today. Sea water spills ; inundations;
aggregate the water logging problems and associated engineering problems
due to elevation of water tables. Remaining coastal ridges will be over
washed. Part of the city including the port will be inundated at high seas.
Environmental and health related problems related to domestic waste
disposal will escalate. Severe infrastructure failures and collapse of economy
76Significant Impact Concerns..
The results obtained conclusively point that sea level rise scenarios will bring
profound effects on the land use and land cover classes as well as on
coastal landforms in the study region.
Coastal inundation would leave ocean front and inland properties vulnerable.
Increase in these water levels would alter the coastal drainage gradients.
Reduction in these gradients would increase flooding attributable to
rainstorms which could promote saltwater intrusion into coastal aquifers and
force water tables to rise
Changes in the coastal land forms associated with inundation generate
concern in the background that the coastal region may continue to remain
vulnerable in the coming decades due to population growth and development
pressures
77Information gains..looks into the future..
Signatures of the inundation were found to be strong
Inundation also leads to geomorphic differences in the coastal zones and
adjacent water bodies which lead to modify the flows. Flooding would leave
ocean front and inland properties vulnerable. Higher water levels would
reduce coastal drainage gradients. Reduction in these gradients would
increase flooding attributable to rainstorms, could promote saltwater intrusion
into coastal aquifers and force water tables to rise
Millions of dollars are invested for the infrastructural projects recently such as
Metro rail. Overall probable inundation zones, its land use, land cover, the
expansion plans of future and the assessment of current situation will help to
devise the adaptive management. Preventive planning will reduce the
hassles in the future and long term planning of managing the urban and
industrial areas should be initiated at the earliest
78Thank you
You can also read


