Corridor Information Document - Implementation Plan Update December 2020 - Med
←
→
Page content transcription
If your browser does not render page correctly, please read the page content below
Corridor Information Document
                   -
          Implementation Plan
                   -
        Update December 2020

“RFC North Sea – Med is co-financed by the European Union's CEF. The sole responsibility
 of this publication lies with the author. The European Union is not responsible for any use
                    that may be made of the information contained therein”

CID Implementation Plan – 01/01/2021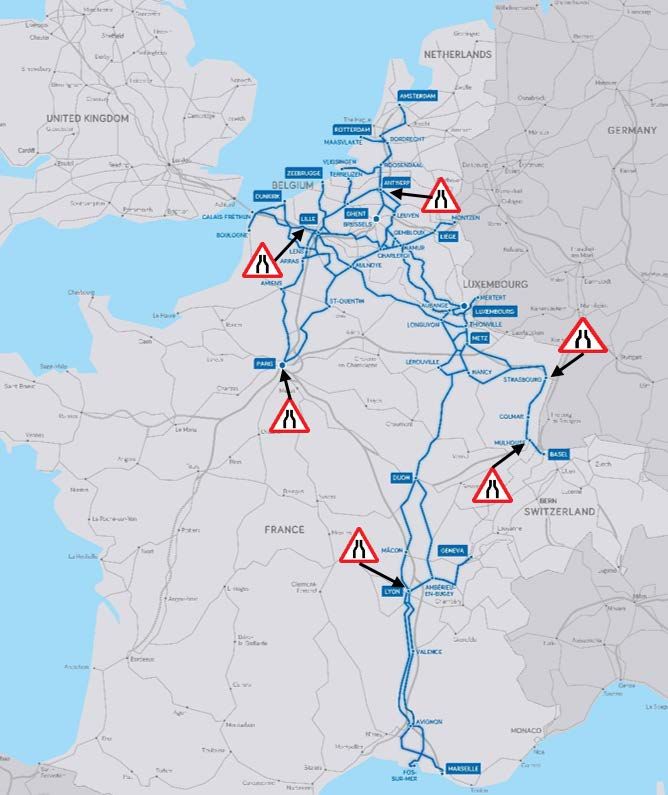
Version Control

 Version                Chapter changed       Changes

 20/11/2020             Review 1 Permanent      -   Based on the last final version published
                        team                        (TT 2020);
                                                -   Extension from Ghent to Terneuzen as
                                                    connecting line in 2019;
                                                -   With the withdrawal of the United
                                                    Kingdom out of the European Union,
                                                    and by consequence the leave as
                                                    members of Network Rail and
                                                    Eurotunnel, the content of this book
                                                    has been adapted accordingly.
 27/11/2020             Review 2                -   Changes have been made on the basis of
                        Management Board            the input and comments provided by the
                        for review by               members of the Management Board;
                        Executive Board and     -   This version has been sent to the
                        in parallel                 Executive Board members for review;
                        Stakeholder             -   In parallel, this reviewed version has been
                        consultation                sent out for stakeholder consultation.
 10/12/2020             Final Draft             -   Changes have been made on the basis of
                                                    the input and comments provided by the
                                                    members of the Executive Board;
                                                -   Changes have been made on the basis of
                                                    comments received during the
                                                    Stakeholder consultation.
 17/12/2020             Final version               The final version has been approved by
                        approved by the             the Executive Board for publication on the
                        Executive board for         website on 01/01/2021.
                        publication on the
                        website
 01/01/2021             Publication on the
                        website

CID Implementation Plan – 01/01/2021                                                     2 of 44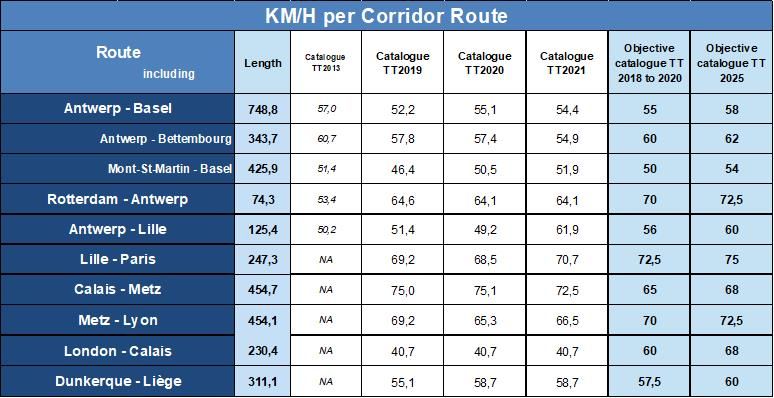
Table of Contents

1.       INTRODUCTION ....................................................................................................................................... 5

2.       CORRIDOR DESCRIPTION ......................................................................................................................... 6

     2.1     KEY PARAMETERS OF CORRIDOR LINES ........................................................................................................... 6
        2.1.1 Routes and Lines ............................................................................................................................... 6
        2.1.2 Number of tracks .............................................................................................................................. 9
        2.1.3 Speed limits ..................................................................................................................................... 11
        2.1.4 Electrical systems ............................................................................................................................ 12
        2.1.5 Signalling systems ........................................................................................................................... 14
        2.1.6 Maximum axle load ........................................................................................................................ 14
        2.1.7 Train length ..................................................................................................................................... 16
        2.1.8 Loading Gauges .............................................................................................................................. 18
        2.1.9 Gradients ........................................................................................................................................ 21
        2.1.10    Connections with Other Corridors .............................................................................................. 23
             2.1.10.1        Connection points with other Corridors ................................................................................................ 23
             2.1.10.2        Contiguous Traffic Flows with other Corridors ...................................................................................... 23
             2.1.10.3        RFC Rhine Alpine .................................................................................................................................... 23
             2.1.10.4        RFC Atlantic ............................................................................................................................................ 23
             2.1.10.5        RFC Mediterranean ................................................................................................................................ 23
             2.1.10.6        RFC North Sea - Baltic ............................................................................................................................ 24
             2.1.10.7        RFC Rhine-Danube ................................................................................................................................. 24
             2.1.10.8        Multiple Corridor Flows ......................................................................................................................... 24
     2.2         CORRIDOR TERMINALS .............................................................................................................................. 24
     2.3         BOTTLENECKS .......................................................................................................................................... 24
     2.4         RFC GOVERNANCE ................................................................................................................................... 25

3.       MARKET ANALYSIS STUDY ..................................................................................................................... 26

4.       LIST OF MEASURES ................................................................................................................................ 27
     4.1     COORDINATION OF PLANNED TEMPORARY CAPACITY RESTRICTIONS................................................................... 27
     4.2     CORRIDOR ONE STOP SHOP ....................................................................................................................... 27
     4.3     CAPACITY ALLOCATION PRINCIPLES .............................................................................................................. 27
     4.4     APPLICANTS ............................................................................................................................................ 27
     4.5     TRAFFIC MANAGEMENT ............................................................................................................................ 27
     4.6     TRAFFIC MANAGEMENT IN THE EVENT OF DISTURBANCE ................................................................................. 27
     4.7     QUALITY EVALUATION ............................................................................................................................... 27
        4.7.1 Performance Monitoring Report ..................................................................................................... 27
     4.8     CORRIDOR INFORMATION DOCUMENT ......................................................................................................... 28

5.       OBJECTIVES / PERFORMANCE ................................................................................................................ 29

     5.1     TRAIN PERFORMANCE MANAGEMENT: A CORRIDOR ORIENTED PERFORMANCE SCHEME ......................................... 29
     5.2     PUNCTUALITY OBJECTIVES.......................................................................................................................... 29
     5.3     CAPACITY OBJECTIVES ............................................................................................................................... 30
        5.3.1 Trains running on the Corridor ........................................................................................................ 30
        5.3.2 Strategy for the number of Pre-arranged Paths ............................................................................. 30
        5.3.3 Planned Average Speed of Corridor Capacity Objectives ................................................................ 31

CID Implementation Plan – 01/01/2021                                                                                                                                          3 of 44
5.4 ALLOCATION OBJECTIVES ........................................................................................................................... 32
5.5 PERFORMANCE MONITORING ..................................................................................................................... 33
5.5.1 Harmonisation of Measurements across Corridors ........................................................................ 34
5.5.2 Key Performance Indicators ............................................................................................................ 34
5.5.2.1 Other Measurements ............................................................................................................................. 35
5.5.3 User Satisfaction Survey.................................................................................................................. 36
6. INDICATIVE INVESTMENT PLAN ............................................................................................................. 37
6.1 CAPACITY MANAGEMENT PLAN .................................................................................................................. 37
6.1.1 Projects ........................................................................................................................................... 37
6.1.1.1 Lyon Railway Node (NFL) ....................................................................................................................... 37
6.1.1.2 Flyover Oude Landen ............................................................................................................................. 37
6.1.1.3 Other improvement projects ................................................................................................................. 38
6.1.2 Train length increase ...................................................................................................................... 38
6.1.3 Loading gauge increase .................................................................................................................. 38
6.2 LIST OF PROJECTS ..................................................................................................................................... 39
6.3 DEPLOYMENT PLAN RELATING TO INTEROPERABLE SYSTEMS .............................................................................. 39
6.3.1 ERTMS strategy along the corridor ................................................................................................. 39
6.3.2 Compulsory systems and deactivation of national legacy systems ................................................ 40
6.3.3 ERTMS deployment plan (cf. EC Implementing Act of January 2017, EDP and National
Implementation Plan NIP) ............................................................................................................................ 40
6.4 REFERENCE TO UNION CONTRIBUTION ......................................................................................................... 43
ANNEX I: INDICATIVE INVESTMENT PLAN ...................................................................................................... 44
CID Implementation Plan – 01/01/2021 4 of 441. Introduction The Rail Freight Corridor (RFC) North Sea-Mediterranean Management Board consulted applicants to draft this new version of the Implementation Plan. This document is periodically updated, following its first submission to the Executive Board in 2013. In 2019, an extension from Ghent to Terneuzen as a Connecting line was done on RFC North Sea-Mediterranean, but no update of the Implementation Plan was published at that time, due to the nature of the extension. From 2021 on, a revised version of the Implementation Plan is made available, with regard to the withdrawal of the United Kingdom from the European Union, leading to the leave of the members Network Rail and Eurotunnel. This new version was approved by the Executive Board on the 17th of December 2020. CID Implementation Plan – 01/01/2021 5 of 44
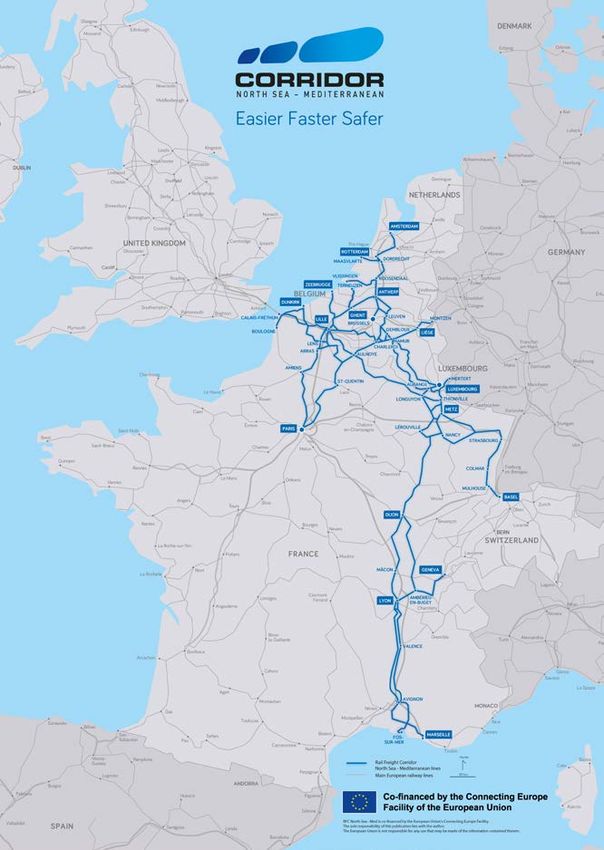
2. Corridor Description

2.1      Key Parameters of Corridor Lines

All information on the routing of the corridor can be found in the corridor information
platform.

2.1.1 Routes and Lines

The RFC North Sea-Mediterranean is the continuation of the former ERTMS Corridor C, as all
Corridor C lines still belong to this RFC.

CID Implementation Plan – 01/01/2021                                                 6 of 44
The designated RFC North Sea-Mediterranean lines can be split into four different categories:

    •    Principal lines, on which Pre-arranged Paths (PaPs) are offered
    •    Diversionary lines, on which PaPs may be considered
    •    Expected lines, which are lines that are either planned in the future or under
         construction but not yet completed, or which are existing lines planned to become a
         corridor line in the future
    •    Connecting lines, which are lines connecting a terminal to a principal or a diversionary
         line and where there is no obligation for PaP supply.

The table below presents the breakdown of RFC North Sea-Mediterranean lines by country.
This breakdown is based on the length of principal and diversionary lines, excluding the length
of the connecting lines.

                                       Length of lines from January 2021 on (in km)
                        Country
                      Netherlands                          306
                      Belgium                             1081
                      France                              3486
                      Luxembourg                           87
                      Switzerland                          19
                         Whole
                                                          4959
                        Corridor

                       Breakdown of RFC North Sea-Mediterranean lines by country

CID Implementation Plan – 01/01/2021                                                       7 of 44
Liefkenshoek tunnel
Haven van
Rotterdam Haven van
Port de Amsterdam / Beverwijk
Port de
Calais Dunkerque Teneuzen Haven van
Port de Boulogne Haven van Vlissingen
Zeebrugge
Grande Synthe
Haven van
Kijfhoek NL
Outreau Gent CTN Antwerpen
Calais Roosendaal
Fréthun Terminal
Hazebrouck IPG Gent
Lille Délivrance
Port de Lille Mouscron Dry Port Haven Antwerpen Noord
van Gent
Lens Brussels Aarschot
Terminal
Intermodal Muizen
Dourges Leuven
Ghlin
Somain Ottignies
Arras
Fleurus
La Louvière
Gembloux
Busigny Liège Log .
Aulnoye
Dry Port Charleroi Auvelais Port de Namur
Intermodal
BE
Monceau sur Sambre Liège Trilogiport
Kinkempois
Liège Container Terminal
Vise
Charleville Ardenne
Amiens Logistics
Tergnier Montzen
Arlon
Athus
Luxembourg
Port of
Mertert LU Belval Usines
Bettembourg Differdange
Esch / Alzette
Pétange
Thionville
Longuyon
Woippy Port d'Illange
Metz Port
Metz Sablon
Lérouville Réding
Port of
Bobigny Strasbourg
Noisy le Sec Hausbergen
Gennevilliers Le Bourget Toul Nancy Frouard
Champigneulles Colmar
Valenton Colmar Neufbrisach
Chalindrey
Bonneuil sur Marne
Mulhouse Ottmarsheim
Is-sur-Tille
Terminal
Chalon sur Saône
Dijon
Basel SBB
CH
Connected Terminal
Harbour area Mâcon Basel Terminals
Bourg en
Principal line Bresse
Diversionary line
Connecting line
St Germain
au Mont d'Or
FR Geneva
La Praille
Ambérieu
Perrache Bellegarde
Marchandises
P.E.H Vénissieux
Badan Culoz
Sibelin
Valence
Avignon
Miramas
GPMM/Port of Fos
Marseille
GPMM/Port of Marseille
Map of the categories of lines of the corridor
CID Implementation Plan – 01/01/2021 8 of 442.1.2 Number of tracks All corridor sections have 2 to 4 tracks, except less than 30 kilometers in Belgium, six short lines in France and a small section in Luxembourg. The following map shows the sections with two or more tracks and the ones with a single track (in red). All sections in the Netherlands (except the stretch between the Belgian border and Terneuzen) and Switzerland have two tracks or more. Belgium has a section between Fleurus and Auvelais, one between Jemeppe-sur-Sambre and Gembloux and one South of Aubange with single track, as well as the line between Ghent and Terneuzen. France has one short single track line in the Lyon node, two single track connecting lines in Alsace and some single track lines in the vicinity of the ports of Calais and Boulogne. CID Implementation Plan – 01/01/2021 9 of 44
Liefkenshoek tunnel
Haven van Haven van
Rotterdam Amsterdam / Beverwijk
Port de Port de Haven van
Terneuzen Haven van
Port de Boulogne Calais Dunkerque Vlissingen
Haven van
Zeebrugge Rotterdam (Kijfhoek)
Haven van
Outreau Gent CTN Antwerpen
Roosendaal
NL
Calais Terminal
Fréthun IPG Gent
Hazebrouck
Haven Antwerpen Noord
Mouscron
Lille van Gent
Antwerpen Berchem
Lens Kortrijk Brussels
Aarschot
Tournai Terminal
Mechelen
Intermodal Leuven
Dourges
Douai Ghlin Ottignies
Arras Fleurus
Busigny La Louvière Gembloux
Maubeuge
BE
Liège Log .
Aulnoye Charleroi Intermodal
Auvelais
Namur
Dinant Liège
Vise
Ardenne Libramont
Amiens Logistics
Bertrix
Montzen
Arlon
Athus
Luxembourg
Port of
Mertert
LU
Longueil-Ste-Marie Bettembourg
Longuyon Thionville
Hagondange
Conflans Jarny
Creil Metz
Onville Réding
Ory la Ville
Port of
Strasbourg
Strasbourg
Gennevilliers Le Bourget Nancy
Toul
Colmar
Colmar Neufbrisach
Paris (Valenton)
Mulhouse Ottmarsheim
≥ 4 tracks
Dijon
Basel SBB
CH
3 tracks
2 tracks Mâcon Bourg en
1 track
FR
Bresse
Geneva La Praille
Collonges
Lyon Ambérieu
Bellegarde
Perrache Vénissieux
Marchandises
Culoz
Badan Sibelin
Valence <
Avignon
Miramas
GPMM/Port of Fos
Marseille
GPMM/Port of Marseille
Map with the number of tracks on the corridor
CID Implementation Plan – 01/01/2021 10 of 442.1.3 Speed limits
The following map provides an overview on the speed limits on the corridor lines.
Liefkenshoek tunnel Haven van
Haven van
Rotterdam
Amsterdam / Beverwijk
Port de Port de
Calais Haven van Haven van
Dunkerque
Port de Boulogne Terneuzen Vlissingen
Haven van
Zeebrugge Haven van Rotterdam (Kijfhoek)
Outreau Gent CNR Antwerpen
Roosendaal
NL
Calais Terminal
Fréthun IPG Gent
Hazebrouck
Haven Antwerpen Noord
Mouscron
Lille van Gent
Antwerpen Berchem
Lens Kortrijk
Brussels
Aarschot
Tournai Terminal
Mechelen
Intermodal Leuven
Dourges
Douai Ghlin Ottignies
Arras Fleurus
Busigny La Louvière Gembloux
Maubeuge
BE
Liège Log .
Aulnoye Charleroi Intermodal
Auvelais
Namur
Dinant Liège
Vise
Ardenne Libramont
Amiens Logistics
Bertrix
Montzen
Arlon
Athus
Luxembourg
Port of
Mertert LU
Longueil-Ste-Marie Bettembourg
Longuyon Thionville
Hagondange
Conflans Jarny
Creil Metz
Onville Réding
Ory la Ville
Port of
Strasbourg
Strasbourg
Gennevilliers Le Bourget Nancy
Toul
Colmar
Colmar Neufbrisach
Paris (Valenton)
Mulhouse Ottmarsheim
CH
=160 km/h
FR
Bresse
Geneva La Praille
Collonges
Lyon
Ambérieu
Bellegarde
Perrache Vénissieux
Marchandises
Culoz
Badan Sibelin
Valence
Avignon
Miramas
GPMM/Port of Fos
Marseille
GPMM/Port of Marseille
Speed limitation on the corridor
CID Implementation Plan – 01/01/2021 11 of 442.1.4 Electrical systems All principal and diversionary lines of the corridor are electrified. They comply with the TEN-T core network standard which allows: 25 kV AC, 50 Hz; 3 kV DC; 15 kV AC, 16.7 Hz; 1.5 kV DC, 750V DC. CID Implementation Plan – 01/01/2021 12 of 44
Liefkenshoek tunnel Haven van Haven van
Rotterdam Amsterdam / Beverwijk
Port de Port de
Haven van
Calais Dunkerque Haven van
Terneuzen
Port de Boulogne Vlissingen
Haven van Gent Container Haven van Rotterdam (Kijfhoek)
Zeebrugge Terminal Antwerpen
Outreau Roosendaal
NL
Calais
Frethun IPG Gent
Hazebrouck
Haven Antwerpen Noord
Mouscron
Lille van Gent
Antwerpen Berchem
Lens Kortrijk
Brussels
Aarschot
Tournai Terminal
Mechelen
Intermodal Leuven
Dourges
Douai Ghlin Ottignies
Arras Fleurus
Busigny La Louvière Gembloux
Maubeuge
BE
Liège Log .
Aulnoye Charleroi Intermodal
Auvelais
Namur
Dinant Liège
Vise
Ardenne Libramont
Amiens Logistics
Bertrix
Montzen
Arlon
Athus
Luxembourg
Port of
Mertert LU
Longueil-Ste-Marie Bettembourg
Longuyon Thionville
Hagondange
Conflans Jarny
Creil Metz
Onville Réding
Port of
Strasbourg
Strasbourg
Gennevilliers Le Bourget Nancy
Toul
Colmar
Colmar Neufbrisach
Paris (Valenton)
Mulhouse Ottmarsheim
750 V DC
Dijon
Basel SBB
CH
1,5 kV DC
3 kV DC Mâcon Bourg en
25 kV AC Bresse
FR
Geneva La Praille
15 kV AC
No electrification Collonges
Lyon
Ambérieu
Bellegarde
Perrache Vénissieux
Marchandises
Culoz
Badan Sibelin
Valence
Avignon
Miramas
GPMM/Port of Fos
Marseille
GPMM/Port of Marseille
Electrical systems on the corridor
CID Implementation Plan – 01/01/2021 13 of 442.1.5 Signalling systems ERTMS is progressively deployed on the RFC North Sea – Mediterranean lines. Section 6.3.3 about the interoperable system presents in detail the planning of the ETCS deployment. 2.1.6 Maximum axle load According to the TEN-T standards, the axle load on the core network should be at least 22.5 ton per axle. All RFC North Sea-Mediterranean lines (with the exception of the small section to the Port of Calais) comply with this standard. CID Implementation Plan – 01/01/2021 14 of 44
Liefkenshoek tunnel
Haven van Haven van
Rotterdam Amsterdam / Beverwijk
Port de Port de Haven van
Calais Dunkerque Terneuzen Haven van
Port de Boulogne Vlissingen
Haven van Haven van Rotterdam (Kijfhoek)
Zeebrugge Gent Container Antwerpen
Outreau Roosendaal
Calais
NL
Terminal
Frethun
Hazebrouck IPG Gent
Haven Antwerpen Noord
Mouscron
Lille van Gent
Antwerpen Berchem
Lens Kortrijk
Brussels
Aarschot
Tournai Terminal
Mechelen
Intermodal Leuven
Dourges
Douai Ghlin Ottignies
Arras Fleurus
Busigny La Louvière Gembloux
Maubeuge
BE
Liège Log .
Aulnoye Charleroi Intermodal
Auvelais
Namur
Dinant Liège
Vise
Ardenne Libramont
Amiens Logistics
Bertrix
Montzen
Arlon
Athus
Luxembourg
Port of
Mertert LU
Longueil-Ste-Marie Bettembourg
Longuyon Thionville
Hagondange
Conflans Jarny
Creil Metz
Onville Réding
Port of
Le Bourget Strasbourg
Strasbourg
Gennevilliers Nancy
Toul
Colmar
Colmar Neufbrisach
Paris (Valenton)
Mulhouse Ottmarsheim
20 t / axle load
Dijon
Basel SBB
CH
22,5 t / axle load
Mâcon Bourg en
FR
Bresse
Geneva La Praille
Collonges
Lyon
Part Dieu
Ambérieu
Bellegarde
Perrache
Marchandises P.E.H
Vénissieux
Culoz
Badan Sibelin
Valence
Avignon
Miramas
GPMM/Port of Fos
Marseille
GPMM/Port of Marseille
Map of maximum axle load
CID Implementation Plan – 01/01/2021 15 of 442.1.7 Train length The standard train length is expected to be set at 740/750 meters (including locomotives). In Belgium, 740-meter-long trains are not allowed to run on some sections during peak hours. The Netherlands, Luxembourg, Switzerland and France fully meet the TEN-T standard. On the section Bettembourg – Le Boulou, trains of the rolling highway as well as combined transport trains with “high performance” wagons are allowed to run with a length of 850 meters. CID Implementation Plan – 01/01/2021 16 of 44
Liefkenshoek tunnel Haven van Haven van
Rotterdam Amsterdam / Beverwijk
Port de Port de Haven van Haven van
Calais Dunkerque
Port de Boulogne Terneuzen Vlissingen
Rotterdam (Kijfhoek)
Haven van Haven van
Outreau Zeebrugge Gent Container Antwerpen
Calais Roosendaal
NL
Terminal
Frethun
Hazebrouck IPG Gent
Haven Antwerpen Noord
Mouscron
Lille van Gent
Antwerpen Berchem
Lens Kortrijk
Brussels
Aarschot
Tournai Terminal
Mechelen
Intermodal Leuven
Dourges
Douai Ghlin Ottignies
Arras Fleurus
Busigny La Louvière Gembloux
Maubeuge
BE
Liège Log .
Aulnoye Charleroi Intermodal
Auvelais
Namur
Dinant Liège
Vise
Ardenne Libramont
Amiens Logistics
Bertrix
Montzen
Arlon
Athus
Luxembourg
Port of
Mertert LU
Longueil-Ste-Marie Bettembourg
Longuyon Thionville
Hagondange
Conflans Jarny
Creil Metz
Onville Réding
Port of
Strasbourg
Strasbourg
Gennevilliers Le Bourget Nancy
Toul
Colmar
Colmar Neufbrisach
Paris (Valenton)
Mulhouse Ottmarsheim
less than 750 m (700 m without loco)
Dijon
Basel SBB
CH
750 m (700 m without loco)
Mâcon Bourg en
Bresse
Collonges
Lyon
FR Geneva La Praille
Ambérieu
Bellegarde
Perrache Vénissieux
Marchandises
Culoz
Badan Sibelin
Valence
Avignon
Miramas
GPMM/Port of Fos
Marseille
GPMM/Port of Marseille
Maximum train length
CID Implementation Plan – 01/01/2021 17 of 442.1.8 Loading Gauges There is no TEN-T core network standard requirement for loading gauge. However, available loading gauge can be a criterion for railway undertakings to choose between two routes. The loading gauge is different whether we consider conventional freight trains or combined transport freight trains. The following figures indicate the technical characteristics of loading gauge, and the specification per corridor section. In addition, a new baseline for the gauge P400 is currently been defined by SNCF Réseau and will allow to run most of the 4 meter semi-trailers loaded on pocket wagons. CID Implementation Plan – 01/01/2021 18 of 44
CID Implementation Plan – 01/01/2021 19 of 44
Liefkenshoek tunnel
Haven van Haven van
Rotterdam Amsterdam / Beverwijk
Port de Port de Haven van
Calais Dunkerque Haven van
Terneuzen
Port de Boulogne Vlissingen
Haven van Haven van Rotterdam (Kijfhoek)
Zeebrugge Gent Container Antwerpen
Outreau Roosendaal
Calais
NL
Terminal
Frethun
Hazebrouck IPG Gent
Haven Antwerpen Noord
Mouscron
Lille van Gent
Antwerpen Berchem
Lens Kortrijk
Brussels
Aarschot
Tournai Terminal
Mechelen
Intermodal Leuven
Dourges
Douai Ghlin Ottignies
Arras Fleurus
Busigny Maubeuge La Louvière Gembloux
BE
Liège Log .
Aulnoye Charleroi Intermodal
Auvelais
Namur
Dinant Liège
Vise
Ardenne Libramont
Amiens Logistics
Bertrix
Montzen
Arlon
Athus
Luxembourg
Port of
Mertert LU
Longueil-Ste-Marie Bettembourg
Longuyon Thionville
Hagondange
Conflans Jarny
Creil Ormoy-Villers Metz
Onville Réding
Port of
Strasbourg
Strasbourg
Gennevilliers Le Bourget Nancy
Toul
Colmar
Colmar Neufbrisach
Paris (Valenton)
Mulhouse Ottmarsheim
GC - C80
CH
GB1 - C70 Dijon
GB1 - C60
GB1 - C45
GB - C50 Mâcon
FR Basel SBB
Bourg en
GB - C45 Bresse
GA
Geneva La Praille
G1 Collonges
Lyon
3.3 - C22
Ambérieu
W9
Bellegarde
W9 & W10 Perrache Vénissieux
Marchandises
Culoz
Badan Sibelin
Valence
Avignon
Miramas
GPMM/Port of Fos Marseille
GPMM/Port of Marseille
Loading gauge
CID Implementation Plan – 01/01/2021 20 of 442.1.9 Gradients To meet most of the railway undertakings’ expectations to use only one loco for one train, the gradient shall not exceed 12.5‰. The Netherlands fully meet the standard. Switzerland meets the standards except on the section La Plaine – Genève La Praille. France meets the standard on all lines, except between Bellegarde and the Swiss border. Luxembourg meets the expectation on the section between Autelbas and Bettembourg (30 km). The Athus – Zoufftgen section (35 km) has a slope greater than 19‰. In Belgium, there are only 40% of the sections, which meet railway undertakings expectations. CID Implementation Plan – 01/01/2021 21 of 44
Liefkenshoek tunnel
Haven van
Haven van
Rotterdam
Amsterdam / Beverwijk
Haven van
Port de Port de Terneuzen
Dunkerque Haven van
Calais
Port de Boulogne Vlissingen
Rotterdam (Kijfhoek)
Haven van Haven van
Gent Container
Outreau Zeebrugge Antwerpen
Calais Terminal Roosendaal
Frethun
Hazebrouck
IPG Gent
IPG Gent NL
Haven Antwerpen Noord
Mouscron
Lille van Gent
Antwerpen Berchem
Lens Kortrijk
Brussels
Aarschot
Tournai Terminal
Mechelen
Intermodal Leuven
Dourges
Douai Ghlin Ottignies
Arras Fleurus
Busigny La Louvière Gembloux
Maubeuge
BE
Liège Log .
Aulnoye Charleroi Intermodal
Auvelais
Namur
Dinant Liège
Vise
Ardenne Libramont
Amiens Logistics
Bertrix
Montzen
Arlon
Athus
Luxembourg
Port of
Mertert LU
Longueil-Ste-Marie Bettembourg
Longuyon Thionville
Hagondange
Conflans Jarny
Creil Ormoy-Villers Metz
Onville Réding
Port of
Strasbourg
Strasbourg
Gennevilliers Le Bourget Nancy
Toul
Colmar
Colmar Neufbrisach
Paris (Valenton)
Ottmarsheim
Mulhouse
Dijon
CH
≤ 12,5 ‰ Mâcon
FR Basel SBB
Basel Terminals
Bourg en
>12,5 ‰ Bresse
Geneve La Praille
Collonges
Lyon
Ambérieu
Bellegarde
Perrache Vénissieux
Marchandises
Culoz
Badan Sibelin
Valence
Avignon
Miramas
GPMM/Port of Fos Marseille
GPMM/Port of Marseille
Gradients
CID Implementation Plan – 01/01/2021 22 of 442.1.10 Connections with Other Corridors
2.1.10.1 Connection points with other Corridors
Several important freight routes are partly on RFC North Sea-Mediterranean and partly on
another corridor. For example, a lot of trains run from Antwerp to Italy through Luxembourg,
France and Switzerland.
Generally speaking, RFC North Sea-Mediterranean is connected to five other rail freight
corridors:
- In Amsterdam, Rotterdam, Antwerp, Ghent, Zeebrugge, Mechelen, Montzen and Basel
with Corridor Rhine-Alpine;
- In Strasbourg, Metz and Paris with the Atlantic Corridor;
- Between Lyon and Marseille, and in Ambérieu with the Mediterranean Corridor;
- In Rotterdam and Antwerp and between Antwerp and Roosendaal, in Amsterdam, and
Montzen with Corridor North Sea-Baltic
- In Strasbourg with Corridor Rhine-Danube.
Exact information on routing on all adjacent corridors can be found via the multicorridor view
of the corridor information platform.
2.1.10.2 Contiguous Traffic Flows with other Corridors
As RFC North Sea – Mediterranean is linked in many locations with other corridors, the
importance to act as one network of corridors should not be underestimated. Many traffic flows
using at least partly RFC North Sea – Mediterranean lines continue on/come from one or more
other corridors. Below a non-exhaustive overview of these traffic flows is provided.
2.1.10.3 RFC Rhine Alpine
One of the dominant traffic flows using RFC North Sea – Mediterranean lines connects the
Benelux region with the north of Italy, using RFC North Sea – Mediterranean and RFC Rhine-
Alpine lines. The main connection point for this traffic is Basel.
2.1.10.4 RFC Atlantic
The Benelux region is connected to Spain using RFC North Sea – Mediterranean and Atlantic
Corridor lines. The main connection between the two corridors for this traffic is made in Paris.
2.1.10.5 RFC Mediterranean
Various regions in the North or Central France are connected to Italy via Dijon and Modane,
using RFC North Sea – Mediterranean and Mediterranean Corridor lines. The connection
between the two corridors for this traffic is made in Ambérieu.
CID Implementation Plan – 01/01/2021 23 of 442.1.10.6 RFC North Sea - Baltic
Transit traffic through the Netherlands from the Belgian harbours on RFC North Sea -
Mediterranean (via Roosendaal and Bad Bentheim) exists, which continue until Eastern
Germany, Poland or the Czech Republic using RFC North Sea – Baltic lines.
2.1.10.7 RFC Rhine-Danube
As the RFC Rhine – Danube was just installed; traffic between the two RFC’s will grow in the
future.
2.1.10.8 Multiple Corridor Flows
Several traffic flows exist on RFC North Sea – Mediterranean, using at least three corridors.
Please find some examples below:
• Sweden – Belgium using RFC North Sea – Mediterranean, North Sea – Baltic and
ScanMed lines (via Bad Bentheim and Hamburg).
• Germany – Spain using RFC North Sea – Mediterranean, Atlantic and Mediterranean
lines (via Forbach and Lyon).
• Le Havre – Italy using RFC North Sea – Mediterranean, Atlantic and Rhine-Alpine lines
(via Metz and Basel).
2.2 Corridor Terminals
In Regulation (EU) 913/2010, terminals are broadly defined. They can be the Infrastructure
Managers’ marshalling yards and sidings which are necessary for rail system operations like
train formation operations. They can also be many other entry points of the various
transportation systems in the commercial zone of influence of the corridor:
- combined transport terminals;
- river ports;
- multimodal platforms;
- maritime ports;
- private rail freight terminals.
The list of terminals is provided in Section 3 of the Corridor Information Document, and more
detailed information can be found in our Customer information platform (CIP).
2.3 Bottlenecks
RFC North Sea-Mediterranean calls “bottleneck” all rail sections where it has identified a
capacity problem. Typically, this means that it is difficult to elaborate a train path if this path
crosses one of these bottlenecks during peak hours.
CID Implementation Plan – 01/01/2021 24 of 44RFC North Sea-Mediterranean has identified the bottlenecks ( ) which are highlighted on the map below. Additional information about RFC North Sea-Mediterranean bottlenecks is provided in chapter 6.1. 2.4 RFC Governance All details can be found in Section 1 of the CID. CID Implementation Plan – 01/01/2021 25 of 44
3.       Market Analysis Study
In view of Article 9 of Regulation (EU) 913/2010, the RFC North Sea-Mediterranean
Management board has commissioned a consortium of consultant firms to carry out a first
Transport Market Study. This study was carried out in 2012 and 2013.

In June 2016, an update has been made (as an addendum) in order to assess the market for
international rail freight in the United Kingdom.

Since 2016, no updates were done on the Transport Market Study.

The essential elements of these studies have been published and are on the website of RFC
North Sea-Mediterranean.

A synthesis can be found on our website, or directly by clicking here.

CID Implementation Plan – 01/01/2021                                               26 of 44
4.       List of Measures
Since the corridor is implemented, the subchapters 4.1 – 4.6 are not applicable for updates.
The state of play and further developments regarding concrete measures and procedures is
included in Section 4 of the CID.

4.1      Coordination of Planned Temporary Capacity Restrictions

All information on the coordination of planned temporary capacity restrictions can be found in
Section 4 of the CID.

4.2      Corridor One Stop Shop

All information on the Corridor One Stop Shop can be found in Section 4, chapter 4.2 of the
CID.

4.3      Capacity Allocation Principles

All information on capacity allocation can be found in Section 4, chapter 4.3 of the CID.

4.4      Applicants

All information on applicants can be found in Section 4, chapter 4.3.2 of the CID.

4.5      Traffic Management

All information on traffic management can be found in Section 4, chapter 4.5 of the CID.

4.6      Traffic Management in the Event of Disturbance

All information on traffic management in the event of disturbance can be found in Section 4,
chapter 4.5.3 of the CID, including the International Contingency Management.

4.7      Quality Evaluation

4.7.1 Performance Monitoring Report

RFC North Sea-Mediterranean publishes an annual performance report on its website, and
presents these figures during a TAG and RAG meeting, to its customers. This annual
publication is foreseen in the first quarter of each year. The report is based on the RNE
Guidelines on the Key Performance Indicators of the Rail Freight Corridors:

CID Implementation Plan – 01/01/2021                                                        27 of 44
http://www.rne.eu/rail-freight-corridors/downloads-documents/. More information on KPI and
objectives can be found in chapter 5.

4.8      Corridor Information Document

The CID, which consists of 4 sections and this implementation plan as an annex, is
published every year in January. From January 2021 on, this will be published in a new tool
called Network and Corridor Information (NCI) portal. Access to the NCI portal is free of
charge and without user registration. For accessing the application, as well as for further
information, use the following link: http://nci.rne.eu/.

Following the Sector Statement (priority 10), continuous efforts are being made to harmonise
the CID even further.

CID Implementation Plan – 01/01/2021                                                  28 of 44
5.       Objectives / Performance
The performance of the corridor is monitored via different KPIs and other measurements. For
all KPIs, measurable objectives are fixed. These can be found in this chapter.

5.1      Train Performance Management: a corridor oriented performance
         scheme

All information concerning the Train Performance Management project on RFC North Sea-
Mediterranean can be found in the CID Section 4 chapter 4.6.

5.2      Punctuality Objectives

It is the goal of the RFC North Sea-Mediterranean to improve punctuality on the Corridor. This
goal can be reached by three methods. The Train Performance Management (TPM), an
improved harmonisation and resilience of the PaP Catalogue and the removal of traffic
bottlenecks. TPM is described in chapter 5.1. The removal of bottlenecks is described more
in detail in chapter 2.3 and 6.1.

The setup of the yearly PaP catalogue can help to improve punctuality by implementing
specific procedures on harmonisation at border points. Furthermore, an improvement in
punctuality can be achieved by insisting on realistic train paths. With these three strategies,
RFC North Sea-Mediterranean intends to contribute to the improvement of punctuality on
problematic Corridor sections and passing points.

To fix a measurable objective of 80% in 2021, we have taken into account the punctuality of
the past years, measured from more than 30 minutes delay, on a selection of Corridor trains,
in 26 measuring points along the corridor. The evolution of this figure is displayed in the table
below.

     Yearly RFC NSM punctuality
                                               13

                                                        14

                                                                 15

                                                                          16

                                                                                   17

                                                                                            18

                                                                                                     19

     (30min on selected corridor trains)
                                            20

                                                     20

                                                              20

                                                                       20

                                                                                20

                                                                                         20

                                                                                                  20

          punctuality evolution
                                           78%      79%      79%      77%      78%      78%      80%
          compared to TT2013

CID Implementation Plan – 01/01/2021                                                                      29 of 44
5.3 Capacity Objectives
Capacity on RFC North Sea-Mediterranean is measured mainly in three different fields: trains
running on the corridor lines, the number of PaPs offered, and the average running time on
the main corridor sections.
5.3.1 Trains running on the Corridor
The total volume of Corridor trains is measured in KPI 1. All trains crossing at least one corridor
border, and running at least 70 continuous kilometres on the Corridor are taken into account.
This means that not only trains running on PaPs are considered. The evolution of the total
amount of corridor traffic is heavily influenced by the economic growth of the corridor region.
However, the corridor aims to increase the amount of corridor trains in the following manner,
compared to the year 2013, taking into account a low economic growth:
2013 2022 2030
Base 100 + 3% + 9%
5.3.2 Strategy for the number of Pre-arranged Paths
Each year, around X-18, the RFC North Sea-Mediterranean C-OSS, together with the other
RFCs, organises a client survey (“Capacity Wishes Survey”) to have a better view on the
quantity of PaPs needed for the next PaP catalogue. Based on the outcome of this survey,
the Management board makes a preliminary decision about a PaP strategy (as far as quantity
is concerned) based on a proposal from the C-OSS. For this proposal, other parameters are
also taken into account:
- offer previous timetable
- quantity of allocated PaPs of previous timetable
- total of allocated paths of previous timetable
- total of used paths of previous timetable
- transport market study interpretation
- capacity needs survey
- capacity availability and strategy IM (capacity model)
This proposal is then presented to the Executive board and the Advisory Groups, and adapted
according to their input when it is deemed relevant by the Managing board.
At first, the PaP catalogue consisted largely of paths reflecting historic market demand. RFC
North Sea-Mediterranean is extending this offer gradually with a number of PaPs designed for
the development of new traffics. These paths are published on top of the amount of market
demand paths for two reasons. The Corridor offers more flexibility to the market in number of
paths and alternative routes, and it anticipates on possible extra traffics and promotes the use
of under exploited lines and trajectories.
It is the objective of the RFC North Sea-Mediterranean to offer a complete PaP offer (at X-11)
on all Corridor principal lines and to increase the share of requests for international freight
CID Implementation Plan – 01/01/2021 30 of 44paths along corridor lines, that go via the C-OSS, from around 10%, to at least 50% by 2025
(compared to the concerned timetable year).
The table below gives an overview on the capacity offered as PaP in the RFC North Sea-
Mediterranean catalogues from timetable (TT) 2015 to 2021 and an objective for TT2025 on
the short and long term. Because of the maximisation of the capacity offered for TT2021,
which meant that in principle all harmonised international paths were published as a PaP, the
objective for TT2022 is to offer a similar amount of capacity than for TT2021.
Evolution PaP Capacity on RFC North Sea-Mediterranean
million
objective *
kms
TT2018
TT2019
TT2017
TT2015
TT2016
TT2020
TT2021
TT2025
construct
ed
X
days
offered 7,6 9,2 15,1 12,6 21,3 24,7 21,7 Maximisation: 100% preconstructed paths crossing
the corridor border as PaP
* compared to TT2021
5.3.3 Planned Average Speed of Corridor Capacity Objectives
The goal of RFC North Sea-Mediterranean is to be a fast, efficient and high quality rail link.
This objective means increasing the efficiency, reliability and durability of end-to-end rail
freight traffic, thereby strengthening the railway’s competitive position, in line with European
freight transport targets. Therefore it is vital to continue the optimisation of harmonisation of
train paths between the different IMs and ABs.
The follow-up on the average speed is monitored in KPI 3. The objective is based on the
following parameters:
- preview of works
- preview of infrastructure investments
- the evolution of the path journey time in the past catalogue
- the evolution of the timetable journey time
Taking into account these parameters, the Corridor has defined the following objectives
concerning the published PaPs:
CID Implementation Plan – 01/01/2021 31 of 44Average Speed Objectives
5.4 Allocation Objectives
The Corridor OSS allocates capacity on the Corridor. To be able to measure the success of
this new way of allocating capacity, the Corridor has chosen the following objectives for the
KPIs concerned:
Requests for pre-arranged paths (capacity)
The number of requests for pre-arranged paths is measured for two periods:
- X-11 untill X-8
- X-8 until X-2 (with feeder/outflow sections).
RFC North Sea-Mediterranean objectives:
- X-11 until X-8: 50% of PaPs offered at X-11 requested (in km per year).
- X-8 until X-2: 20% of the PaPs offered at X-8 requested (in km per year).
Allocated pre-arranged paths (capacity)
The number of pre-arranged paths which are pre-booked by the C-OSS is measured for two
periods:
- X-11 until X-8
- X-7.5 until X
RFC North Sea-Mediterranean objective is to allocate 85% of the Published PaP’s.
CID Implementation Plan – 01/01/2021 32 of 44Reserve Capacity Offer
The Corridor wants to provide Reserve Capacity of at least 10% of the capacity provided in
the yearly timetable PaP Catalogue (in kms). To be able to calculate this, the length of the
Corridor sections has been fixed, and can be found in annex of the CID Section 4.
Allocated Reserve Capacity
RFC North Sea-Mediterranean objective is to allocate 85% of the published Reserve Capacity.
5.5 Performance Monitoring
RFC North Sea-Mediterranean monitors its performance by using a number of Key
Performance Indicators (KPIs) and other measurements (OMs). These were chosen on the
basis of the following parameters:
- Measurability: performance should be measurable with the tools and resources
available to the corridor
- Clarity: KPI should be understandable for all public it is designed for
- Comparability: KPI should be comparable across time and region
- Relevance and empowerment: KPI should provide information on which project
decisions can be based
The difference between general measurements and KPIs lies in the fact that concrete
objectives are linked to the KPIs in terms of threshold values, while this is not the case for
general measurements.
The list is updated regularly, depending on management needs and availability of data. They
form the basis, together with the results from the user satisfaction survey, of the annual
performance report.
For the KPIs or other measurements, only RFC North Sea-Mediterranean trains are taken into
account. On RFC North Sea-Mediterranean, a “Corridor train” is an international freight train
which crosses at least one RFC North Sea-Mediterranean border, and runs at least 70
continuous kilometres on this Corridor.
The KPIs and OMs have been divided into three categories:
- Operations
- Capacity Management
- Market Development (not measured on RFC North Sea – Med)
CID Implementation Plan – 01/01/2021 33 of 445.5.1 Harmonisation of Measurements across Corridors In order to facilitate data processing and data provision for the calculation of the KPIs of the corridors, as well as to establish a common interpretation of similar measurements, the corridors, together with RNE, have drafted a common guideline, to ensure a certain degree of harmonisation of the KPIs. This guideline is under constant review and updated regularly, on the basis of customer feedback. Our list of measurements has been updated accordingly. 5.5.2 Key Performance Indicators Operations: KPI 1: Traffic Volume (Total) Measures the number of train runs on RFC North Sea-Mediterranean. Trains that pass two RFC North Sea-Mediterranean border points will not be counted twice. KPI 2: Corridor Punctuality Measures the average punctuality of corridor trains on a fixed number of passage points, including an overview on the punctuality at origin and at destination. Capacity Management : KPI 3: Average planned speed of PaPs Makes the comparison between the average running time of the yearly timetable and of the prearranged path for predefined RFC North Sea-Mediterranean routes. The average speed will also be calculated, to be able to compare along the Corridor. This KPI is updated yearly after the publication of the Corridor PaPs Catalogue at X-11. KPI 4: Volume of offered capacity The KPI is calculated as: Kilometres x days offered at X-11 (yearly PaP catalogue), X-8 (PaPs for late requests and Reserve Capacity). KPI 5: Volume of requested capacity CID Implementation Plan – 01/01/2021 34 of 44
The KPI is calculated as: Kilometres x days requested as a PaP in the period X-11 until X-8
and X-8 (-1 day) until X-30 days (without feeder/outflow sections).

KPI 6: Volume of pre-booked capacity

The KPI is calculated as: Kilometres x days requested as a PaP in the period X-11 until X-8
(without feeder/outflow sections) that have been pre-booked by the C-OSS.

Market Development:

KPI 7: Ratio between capacity allocated by the C-OSS and total (scheduled) traffic

The KPI is a comparison between the number of trains (for selected timetable) allocated by
the C-OSS per corridor border (final allocation X-3.5) and the total amount of scheduled trains
at the start of the given timetable year.

5.5.2.1 Other Measurements

Operations:

OM 1: Traffic Volume (Per Corridor Border)

Measures all corridor trains per RFC North Sea-Mediterranean border point.

OM 2: Cancelled Trains

Measures the average amount of cancelled trains (entire trajectory) on the corridor.

Capacity Management:

OM 3: Volume of requests

This OM is calcuted as the number of requests submitted to the C-OSS in the period X-11
until X-8 and X-8 (-1 day) until X-30 days.

OM 4: Number of conflicts

This OM is calcuted as the number of requests submitted to the C-OSS which are in conflict
with at least one other request at X-8.

CID Implementation Plan – 01/01/2021                                                    35 of 44
OM 5: Relation between the results of the capacity wishes survey, the published and
the requested capacity

Comparison between the results of the capacity wishes survey and the actual published and
requested capacity for the corresponding timetable year, on predefined corridor O/Ds.

5.5.3 User Satisfaction Survey

Every year as required by the Regulation (EU) 913/2010, a common satisfaction survey is
organised by the RFC’s, and the results are published on the website, the annual report as
well as a base for discussion and exchange with stakeholders, e.g. in the Advisory Groups.

To make the results of the satisfaction survey more comparable, RFC North Sea-
Mediterranean works with all active RFC's and the support of the RFC Network Secretary on
the survey. The 2020's survey was sent out in Fall. The questionnaire addresses topics such
as coordination of works, the CID, capacity allocation, C-OSS, traffic management, train
performance management, communication tools and advisory groups.

All results of the User Satisfaction Survey can be found on our dedicated figures page of our
website: https://www.rfc-northsea-med.eu/en/page/figures-performance-corridor

CID Implementation Plan – 01/01/2021                                                   36 of 44
6.       Indicative Investment plan
RFC North Sea-Mediterranean collected data about investments from its Infrastructure
Managers members. The investments planned by IMs are either renewal or development of
the infrastructure. Some IMs combine both investment types if possible.
This investment plan takes into account four categories:
    • The deployment of ERTMS to encourage interoperability and to avoid as quickly as
        possible the multiplication of on board control command systems for operators.
    • The improvement of the loading gauge to support the growth of the market share of
        combined transport with the carriage of P400 semi-trailers.
    • The bottlenecks relief to facilitate the traffic in railway nodes experiencing capacity
        problems.
    • The increase of the train length up to 740m (with loco) to standardise this technical
        characteristic on all the sections of the corridor.

6.1      Capacity Management Plan

6.1.1 Projects

6.1.1.1 Lyon Railway Node (NFL)

This junction is:

         -    on the Northern Europe - Mediterranean axis and on two European freight corridors
              (RFC Mediterranean and RFC North Sea – Mediterranean);
         -    at the heart of national and international high-speed links;
         -    on a territory of 7.9 million inhabitants in Auvergne-Rhône-Alpes with a strong
              demographic growth.

Located at the convergence of 15 European, national and regional railway lines, the Lyon
railway junction is extremely busy, and its infrastructures are at the limit of capacity. This is
why a short and medium-term mobilization plan has been put in place aiming at restoring the
system's robustness by acting on all components: operations and standards, equipment,
regeneration of installations and investment works. This plan was approved by ministerial
decision on 2 June 2015.

6.1.1.2 Flyover Oude Landen

The Port of Antwerp is the largest Belgian and the second largest European port after
Rotterdam and the number of containers handled at the port is gradually increasing. Over the
past decade Infrabel has strengthened the railway infrastructure in and around the port in
various strategic locations, such as the Liefkenshoek Rail Link. A range of other projects can
support the further development of the port in the future. Today all trains travel from the Port
of Antwerp to the hinterland via a single line between Antwerp North and Mortsel (L 27A). This
line has reached its capacity limits. The construction of a flyover, called Oude Landen, in order
to replace the current junction Schijn at the entrance of the marshalling yard Antwerp North,

CID Implementation Plan – 01/01/2021                                                      37 of 44
is a first step on the way to enhancing the capacity on the line L27A. This project can be
considered as the first phase of a long-term solution to improve the access to the Port of
Antwerp, consisting in the construction of a complete new railway line between Antwerp North
and Lier, the so-called second railway access. If all goes according to plan the flyover should
become operational by the end of 2027.
6.1.1.3 Other improvement projects
Other projects are planned to ease operations on RFC North Sea-Mediterranean.
The freight traffic between Basel and the French border is limited to two trains per hour per
direction, due to flat junctions and the signalling system. To increase the capacity, the
signalisation should be upgraded.
6.1.2 Train length increase
740m long trains can run on RFC North Sea-Mediterranean except in Belgium during peak
hours. Works are in progress or planned to extend some sidings. A study is ongoing at Infrabel.
In France and Luxemburg, some 850 m trains are allowed to run and effectively run on the
Bettembourg-Lyon section.
6.1.3 Loading gauge increase
The Corridor Transport Market study performed in 2012 and 2013 showed a major market
demand for the transport of trailers/trucks. This has been unanimously and repeatedly
reaffirmed by railway undertakings in the advisory group meetings since 2013.
As P400 loading gauge already exists in Belgium and the Netherlands, and as a similar study
was performed in Switzerland, studies were performed in 2015 to assess the opportunity to
enhance the loading gauge on the French and Luxembourg part of the corridor.
These studies enabled to assess the best solution and the related cost for the necessary
infrastructure upgrade to have P400 loading gauge on the Rotterdam – Antwerp – Metz - Basel
route of the corridor. If the project goes live, it will facilitate the traffic of trains carrying
trailers/trucks across borders (France, Belgium, Netherlands, Luxembourg, Germany, and
Switzerland). It will also enable the connection with other lines with similar gauge, such as
Perpignan – Luxembourg.
In Switzerland, on the Calais-Basel route, two tunnels (Kannenfeld, Schützenmatt) still need
to be enhanced to achieve P400 loading gauge. Timetable and financing of the enhancement
are currently being investigated.
• Kannenfeld (length 800m/ current profile: EBV2): renewal foreseen
• Schützenmatt (length 286m/ current profile: EBV2): renewal foreseen
In France, the study showed that on the Calais – Basel route, 11 tunnels (tunnels of Liart,
Martinsart, Montmédy, Vachemont, Platinerie, Fontoy, Mercy, Arzviller, Lutzelbourg,
Niederrheinthal and Haut Barr) needed to be enhanced to meet the AFM 427 gauge (close to
P400 with usage of 27cm high wagons), and most of them needed to obtain external financing.
CID Implementation Plan – 01/01/2021 38 of 44In 2020, a socio-economic study was conducted by SNCF Réseau on the main routes of its
network, including the RFC North Sea-Mediterranean lines. The results, will serve as a basis
for the French ministry to make decisions on the financing of the loading gauge. This topic is
also being dealt within an ad hoc working group in the Network Operators Committee
("COOPERE").
6.2 List of projects
RFC North Sea-Mediterranean identified a list of projects or programs which may go live in a
10 year time horizon.
WARNING: this list displayed in the table in annex is provided on an indicative basis. The list
of projects provided in this document is presumably considered as secured, unless indicated
otherwise. This matter falls within the remit of the Member States, in accordance with the
principle of subsidiarity. A number of technical, political or financial factors may affect the
completion of the listed projects. It is therefore possible that at least some of these projects
will not be put into service or will be delayed. Similarly, the dates and costs presented in this
list may be modified from time to time in the future.
All projects can be found in Annex I to this Implementation Plan, and some are displayed on
the interactive map in CIP.
For ERTMS projects, please refer to the ERTMS deployment plan map (§ 6.3.3.)
6.3 Deployment Plan relating to interoperable systems
RFC North Sea-Mediterranean already complies with most of the interoperability criteria. To
comply with the control command and signalling specifications for interoperability, RFC North
Sea-Mediterranean is currently deploying ETCS (European Train Control System) on its lines.
6.3.1 ERTMS strategy along the corridor
ETCS version 2.3.0.d level 1 FS (punctual information given to the trains by in-track balises)
is installed all along the principal routes of former Corridor C, except for the section Kapellen
– Dutch border. Infrabel intends to install ETCS level 2 FS version 2.3.0d compatible
(continuous information exchanged between track and on-board systems through GSM-R) on
this section.
In Switzerland Baseline 3 balises are implemented for the Limited Supervision mode. 2.3.0d
on board systems cannot run on Baseline 3 tracks in ETCS Level 1 to reach Basel SBB
Rangierbahnhof (Marshalling Yard), the Northern destination of the Corridor, and access to
the Swiss part of the Corridor Rhine-Alpine. Locomotives will have to be equipped with
baseline 3 on-board equipment to be able to run under ETCS limited supervision in
Switzerland according to Notified National Technical Requirements (NNTR). At middle term
CID Implementation Plan – 01/01/2021 39 of 44You can also read


