Now you see me: evaluating performance in long-term visual tracking
←
→
Page content transcription
If your browser does not render page correctly, please read the page content below
arXiv:1804.07056v1 [cs.CV] 19 Apr 2018
                                              Now you see me: evaluating performance in
                                                      long-term visual tracking

                                                        Alan Lukežič1 , Luka Čehovin Zajc1 , Tomáš Vojı́ř2 ,
                                                                Jiřı́ Matas2 and Matej Kristan1
                                         1
                                             Faculty of Computer and Information Science, University of Ljubljana, Slovenia
                                         2
                                             Faculty of Electrical Engineering, Czech Technical University in Prague, Czech
                                                                                Republic

                                                Abstract. We propose a new long-term tracking performance evalu-
                                                ation methodology and present a new challenging dataset of carefully
                                                selected sequences with many target disappearances. We perform an ex-
                                                tensive evaluation of six long-term and nine short-term state-of-the-art
                                                trackers, using new performance measures, suitable for evaluating long-
                                                term tracking – tracking precision, recall and F-score. The evaluation
                                                shows that a good model update strategy and the capability of image-
                                                wide re-detection are critical for long-term tracking performance. We in-
                                                tegrated the methodology in the VOT toolkit to automate experimental
                                                analysis and benchmarking and to facilitate the development of long-
                                                term trackers.

                                 1            Introduction
                                 The field of visual object tracking has significantly advanced over the last decade.
                                 The progress has been fostered by the emergence of standardized datasets and
                                 performance evaluation protocols [1,2,3,4,5] in combination with tracking chal-
                                 lenges [6,5]. Dominant single-target tracking benchmarks [7,2,3,4] focus on short-
                                 term trackers. Over the time, this which lead to the development of short-term
                                 trackers that cope well with significant appearance and motion changes and are
                                 robust to short-term occlusions. Several recent publications [8,9,10] have shown
                                 that short-term trackers fare poorly on very long sequences, since the localization
                                 errors and updates gradually deteriorate their visual model, leading to drift and
                                 failure. Failure recovery, however, is primarily addressed in long-term trackers.
                                     Long-term tracking does not just refer to the sequence length, as stated
                                 in [8,9,10], but also to the sequence properties (number of target disappear-
                                 ances, etc.) and the type of tracking output expected. As shown in Figure 1, in
                                 a short-term tracking setup the object is always in the camera field of view, but
                                 not necessarily fully visible. The tracker thus reports the position of a target,
                                 which is present in each frame. In a long-term setup, the object may leave the
                                 field of view or become fully occluded for a long period. A long-term tracker is
                                 thus required to report the target position in each frame and provide a confi-
                                 dence score of target presence. A crucial difference to short-term tracking is thus
                                 the re-detection capability, which requires fundamentally different visual model
2       Lukežič A., Čehovin Zajc L., Vojı́ř T., Matas J., Kristan M.

Fig. 1: Differences between short-term and long-term tracking. (a) In short-term track-
ing, the target, a red box, may move and change appearance, but it is always at least
partially visible. (b) In long-term tracking, the box may disappear from the view or
be fully occluded by other objects for long periods of time. Within these periods, the
state of the object is not defined and should not be reported by the tracker.

adaptation mechanisms. These long-term aspects have been explored far less
than the short-term counterparts due to lack of benchmarks and performance
measures probing long-term capabilities. This is the focus of our work.
    The paper makes the following contributions. (1) A new long-term tracking
performance evaluation methodology which introduces new performance mea-
sures to evaluate trackers: tracking precision, recall and F-score. (2) We con-
structed a new dataset of carefully selected sequences with many target dis-
appearances that emphasize long-term tracking properties. Sequences are an-
notated with ten visual attributes which enable in-depth analysis of trackers.
(3) We provide a new short-term/long-term taxonomy. We experimentally show
that re-detection capability is critically important for long-term tracking per-
formance. (4) We performed an extensive evaluation of many long-term and
short-term trackers in the long-term tracking scenario together with an analysis
of their speed. All trackers, performance measures and evaluation protocol have
been integrated into the VOT toolkit [4], to automate experimental analysis and
benchmarking and facilitate development of long-term trackers. The dataset, all
the trackers as well as the changes to the toolkit will be made publicly available.

2    Related work
Performance evaluation in single-object tracking has primarily focused on short-
term trackers [7,4,3,2]. The currently widely-used methodologies originate from
three benchmarks, OTB [1,7], VOT [11,4] and ALOV [2] which primarily differ
in the dataset construction, performance measures and evaluation protocols.
    Benchmarks like [7,2,3] propose large datasets, reasoning that quantity re-
duces the variance in performance estimation. Alternatively, the longest-running
benchmark [4] argues that quantity does not necessarily mean quality and pro-
motes moderate-sized datasets with carefully chosen diverse sequences for fast an
informative evaluation. Several works have focused on specific tracking setups.
Mueller et. al. [8] proposed the UAV123 dataset for tracking from aerial vehicles.
Galoogahi et al. [12] introduced a high-frame-rate dataset to analyze trade-offs
between tracker speed and robustness. Čehovin et al. [13] proposed a dataset
with an active camera view control using omni directional videos for accurate
Now you see me: evaluating performance in long-term visual tracking      3

tracking analysis as a function camera motion attributes. The target never leaves
the field of view in these datasets, making them unstable for long-term tracking
properties evaluation.
    Many performance measures have been explored in tracking [14]. All domi-
nant short-term performance measures [7,2,4] are based on the overlap (intersec-
tion over union) between the ground truth bounding boxes and tracker predic-
tions, but significantly differ in the use. ALOV [2] uses the F-measure computed
at overlap threshold of 0.5. OTB [7] avoids the threshold by computing the av-
erage overlap over the sequences as the primary measure. The VOT [4] resets
the tracker once the overlap drops to zero, and proposes to measure robustness
by the number of times the tracker was reset, the accuracy by average overlap
during successful tracking periods and an expected average overlap on a typical
short-term sequence. These measures do not account for tracker ability to report
target absence and are therefore not suitable for long-term tracking.
    A few papers have recently addressed the datasets focusing on long-term
performance evaluation. Tao et al. [10] created artificial long sequences by re-
peatedly playing shorter sequences forward and backward. Such a dataset ex-
poses the problem of gradual drift in short-term trackers, but does not fully
expose the long-term abilities since the target never leaves the field of view.
Mueller et al. [8] proposed UAV20L dataset of twenty long sequences with tar-
get frequently exiting and re-entering the scene, but used it to evaluate mostly
short-term trackers. A dataset with many cases of fully occluded and absent
target has been recently proposed in [9]. Unfortunately, the large number of tar-
get disappearances was obtained by significantly increasing the sequence length,
which significantly increases the storage requirements. To cope with this, a very
high video compression is applied, thus sacrificing the image quality.
    In the absence of clear a long-term tracking definition, much less attention
has been paid to long-term performance measures. The UAV20L [8] and [9]
apply the short-term average overlap measure [7], which does not account for
situation when the tracker reports target absence and favors the trackers that
report target positions at every frame. Tao et al. [10] adapted this measure by
specifying an overlap 1 when the tracker correctly predicts the target absence.
Nevertheless, this value is not ”calibrated” with the tracker accuracy when the
target is visible, which skews the overlap-based measure. Furthermore, reduc-
ing the actual tracking accuracy and failure detection to a single overlap score
significantly limits its the insight it brings.

3   Short-term/Long-term tracking spectrum

A long-term tracker is required to handle target disappearance and reappearance
(Figure 1). Relatively few published trackers fully address the long-term require-
ments, and yet some short-term trackers address them partially. We argue that
trackers should not be simply classified as short-term or long-term, but they
rather cover an entire short-term–long-term spectrum. The following taxonomy
is used in our experimental section for accurate performance analysis.
4      Lukežič A., Čehovin Zajc L., Vojı́ř T., Matas J., Kristan M.

 1. Short-term tracker (ST0 ). The target position is reported at each frame.
    The tracker does not implement target re-detection and does not explicitly
    detect occlusion. Such trackers are likely to fail on first occlusion as their
    representation is affected by any occluder.
 2. Short-term tracker with conservative updating (ST1 ). The target po-
    sition is reported at each frame. Target re-detection is not implemented, but
    tracking robustness is increased by selectively updating the visual model
    depending on a tracking confidence estimation mechanism.
 3. Pseudo long-term tracker (LT0 ). The target position is not reported
    in frames when the target is not visible. The tracker does not implement
    explicit target re-detection but uses an internal mechanism to identify and
    report tracking failure.
 4. Re-detecting long-term tracker (LT1 ). The target position is not re-
    ported in frames when the target is not visible. The tracker detects tracking
    failure and implements explicit target re-detection.

    The ST0 and ST1 trackers are what is commonly considered a short-term
tracker. Typical representatives from ST0 are KCF [15], SRDCF [16] and CSRDCF [17].
MDNet [18] and ECO [19] are current state-of-the art trackers from ST1 . Many
short-term trackers can be trivially converted into pseudo long-term trackers
(LT0 ) by using their visual model similarity scores at the reported target posi-
tion. While straightforward, this offers means to evaluate short-term trackers in
the long-term context.
    The level LT1 trackers are the most sophisticated long-term trackers, in that
they cover all long-term requirements. These trackers typically combine two
components, a short-term tracker and a detector, and implement an algorithm
for their interaction. The LT1 trackers originate from two main paradigms in-
troduced by TLD [20] and Alien [21], with modern examples CMT [22], Ma-
trioska [23], MUSTER [24], LCT [25], PTAV [26], and FCLT [27]. Interestingly,
two recently published trackers LCT [25] and PTAV [26], that perform well in
short-term evaluation benchmarks (OTB50 [1] and OTB100 [7]), are presented
as long-term trackers [26,25], but experiments in Section 6.2 show they are in
the LT0 class.

4   Long-term tracking performance measures

A long-term tracking performance measure should reflect the localization ac-
curacy, but unlike short-term measures, it should also capture the accuracy of
target absence prediction as well as target re-detection capabilities. These prop-
erties are quantified by the precision and recall measures widely used in detection
literature [28], and they are the basis for the proposed long-term performance
measures.
     Let Gt be the ground truth target pose, let At (τθ ) be the pose predicted by
the tracker, θt the prediction certainty score at time-step t and τθ be a clas-
sification threshold. If the target is absent, the ground truth is an empty set,
Now you see me: evaluating performance in long-term visual tracking                         5

i.e., Gt = ∅. Similarly, if the tracker did not predict the target or the predic-
tion certainty score is below a classification threshold i.e., θt < τθ , the output is
At (τθ ) = ∅. The agreement between the ground truth and prediction is specified
by their intersection over union Ω(At (τθ ), Gt )1 . In detection literature, the pre-
diction matches the ground truth if the overlap Ω(At (τθ ), Gt ) exceeds a threshold
τΩ . Given the two thresholds (τθ , τΩ ), the precision P r and recall Re are defined
as
                    P r(τθ , τΩ ) = |{t : Ω(At (τθ ), Gt ) ≥ τΩ }|/Np ,                              (1)
                       Re(τθ , τΩ ) = |{t : Ω(At (τθ ), Gt ) ≥ τΩ }|/Ng ,                            (2)
where | · | is the cardinality, Ng is the number of frames with Gt 6= ∅ and Np is
the number of frames with existing prediction, i.e. At (τθ ) 6= ∅.
   In detection literature, the overlap threshold is set to 0.5 or higher, while
recent work [4] has demonstrated that such threshold is over-restrictive and
does not clearly indicate a tracking failure in practice. A popular short-term
performance measure [1], for example, addresses this by averaging performance
over various thresholds, which was shown in [14] to be equal to the average
overlap. Using the same approach, we reduce the precision and recall to a single
threshold by integrating over τΩ , i.e.,

                       Z    1
                                                       1           X
          P r(τθ ) =            P r(τθ , τΩ )dτΩ =                               Ω(At (θt ), Gt ),   (3)
                        0                              Np
                                                             t∈{t:At (θt )6=∅}
                                Z    1
                                                             1       X
              Re(τθ ) =                  Re(τθ , τΩ )dτΩ =                       Ω(At (θt ), Gt ).   (4)
                                 0                           Ng
                                                                  t∈{t:Gt 6=∅}

    We call P r(τθ ) tracking precision and Re(τθ ) tracking recall to distinguish
them from their detection counterparts. Detection-like precision/recall plots can
be drawn to analyze the tracking as well as detection capabilities of a long-term
tracker (Figure 5). Similarly, a standard trade-off between the precision and
recall can be computed in form of a tracking F-score [28]
                       F (τθ ) = 2P r(τθ )Re(τθ )/(P r(τθ ) + Re(τθ )),                              (5)
and visualized by the F-score plots (Figure 5). Our primary score for ranking
long-term trackers is therefore defined as the highest F-score on the F-score
plot, i.e., taken at the tracker-specific optimal threshold. This avoids manually-
set thresholds in the primary performance measure.
    Note that the proposed primary measure (5) for the long-term trackers is
consistent with the established short-term tracking methodology. Consider an
ST0 short-term tracking scenario: the target is always (at least partially) visible
and the target position is predicted at each frame with equal certainty. In this
case our F-measure (5) reduces to the average overlap, which is a standard
measure in short-term tracking [1,4].
1
    The output of Ω(·, ·) is 0 if any of the two regions is ∅.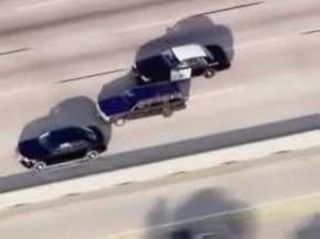
6 Lukežič A., Čehovin Zajc L., Vojı́ř T., Matas J., Kristan M.
5 The long-term dataset (LTB35)
Table 1 quantifies the long-term statistics of the common short-term and existing
long-term tracking datasets. Target disappearance is missing in the standard
short-term datasets except for UAV123 which contains on average less than
one full occlusion per sequence. This number increases four-fold in UAV20L [8]
long-term dataset. The recent TLP [9] dataset increases the number of target
disappearances by an order of magnitude, but at a cost of increasing the dataset
size in terms of the number of frames by more than an order of magnitude, i.e.
target disappearance events are less frequent in TLP [9] than in UAV20L [8], see
Table 1. Moreover, the videos are heavily compressed with many artifacts that
affect tracking.
Table 1: Datasets – comparison of long-term properties: the number of sequences, the
total number of frames, the number of target disappearances (DSP), the average length
of disappearance interval (ADL), the average number of disappearances in sequence
(ADN). The first four datasets are short-term with virtually no target disappearances,
the last column shows the properties of the proposed dataset.
Dataset ALOV300 [2] OTB100 [7] VOT2017 [6] UAV123 [8] UAV20L [8] TLP [9] LTB35 (ours)
# sequences 315 100 60 123 20 50 35
Frames 89364 58897 21356 112578 58670 676431 146847
DSP 0 0 0 63 40 316 433
ADL 0 0 0 42.6 60.2 64.1 40.6
ADN 0 0 0 0.5 2 6.3 12.4
In the light of the limitations of the existing datasets, we created a new long-
term dataset. We followed the VOT [4] dataset construction paradigm which
states that the datasets should be kept moderately large and manageable, but
rich in attributes relevant to the tested tracker class. We started by including
all sequences from UAV20L since they contain a moderate occurrence of occlu-
sions and potentially difficult to track small targets. Three sequences were taken
from [20]. We collected six additional sequences from Youtube. The sequences
contain larger targets with numerous disappearances. To further increase the
number of target disappearances per sequence, we have utilized the recently pro-
posed omni-directional AMP dataset [13]. Six additional challenging sequences
were generated from this dataset by controlling the camera such that the target
repeatedly entered the field of view from one side and left it at the other.
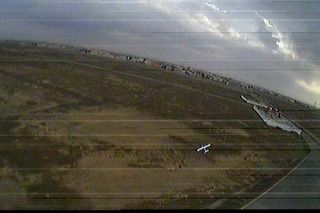
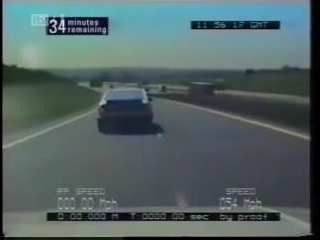
The targets were annotated by axis-aligned bounding-boxes. Each sequence
is annotated by ten visual attributes: full occlusion, out-of-view motion, partial
occlusion, camera motion, fast motion, scale change, aspect ratio change, view-
point change, similar objects, and deformable object. The LTB35 thus contains
35 challenging sequences of various objects (persons, car, motorcycles, bicycles,
animals, etc.) with the total length of 146847 frames. Sequence resolutions range
between 1280 × 720 and 290 × 217. Each sequence contains on average 12 long-
term target disappearances, each lasting on average 40 frames. An overview of
the dataset is shown in Figure 2.
Now you see me: evaluating performance in long-term visual tracking            7

Fig. 2: The LTB35 dataset – a frame selected from each sequence. Name and length
(top), number of disappearances and percentage of frames without target (bottom
right). Visual attributes (bottom left): (O) Full occlusion, (V) Out-of-view, (P) Partial
occlusion, (C) Camera motion, (F) Fast motion, (S) Scale change, (A) Aspect ratio
change, (W) Viewpoint change, (I) Similar objects, (D) Deformable object.

6     Experimental evaluation

6.1   Evaluation protocol

A tracker is evaluated on a dataset of several sequences by initializing on the
first frame of a sequence and run until the end of the sequence without re-sets.
The precision-recall graph (3) is calculated on each sequence and averaged into
a single plot. This guarantees that the result is not dominated by extremely long
sequences. The F-measure plot (5) is computed from the average precision-recall
plot and used to compute the primary ranking score. The evaluation protocol
along with plot generation was implemented in the VOT [4] toolkit to automate
experiments and thus reduce potential human errors.

6.2   Evaluated trackers

An extensive collection of top-performing trackers was complied to cover the
short-term–long-term spectrum. In total fifteen trackers, summarized in Table 2
and Figure 3, were evaluated. We included six long-term state-of-the-art track-
ers with publicly available source code: (i) TLD [20], which uses optical flow for
short-term component and normalized-cross-correlation for detector and a P-N
learning framework for detector update. (ii) LCT [25] and (iii) MUSTER [24]
that use a discriminative correlation filter for the short-term component and ran-
dom ferns and keypoints, respectively, for the detector. (iv) PTAV [26] that uses
8         Lukežič A., Čehovin Zajc L., Vojı́ř T., Matas J., Kristan M.

Table 2: Evaluated trackers. All trackers are characterized by the short-term component
and their confidence score, long-term trackers are also characterized by the detector
type and its interaction with the short-term component. We also summarize model
update and search strategies. Trackers marked by ∗ were published as LT1 , but did not
pass the re-detection test.
                             Short-term Interaction
Tracker       S-L Detector                                       Update              Search
                             component     Score
                Random                  P-N learning             Positive,        Entire image
TLD [20]    LT1              Flow
                   fern              Score: conser. sim.     negative samp.         (cascade)
                Keypoints              F-B, RANSAC          ST: every frame       Entire image
MUSTER [24] LT1               CF
                 (SIFT)               Score: max. corr. LT: when confident (keypoint matching)
                                        Resp. thresh.,     ST: when confident     Entire image
FCLT [27]   LT1 CF (reg.) CF (reg.)
                                    Score: resp. quality LT: mix ST + LT (correlation + motion)
                                       F-B, clustering,
                Keypoints Keypoints                            ST: always         Entire image
CMT [22]    LT1                       correspondencies
                 (static)   (flow)                              LT: never     (keypoint matching)
                                     Score: # keypoints
                                        Conf. thresh,
                 Siamese      CF                               ST: always,       Search window
PTAV∗ [26]  LT0                     const. verif. interval
                 network  (fDSST)                               LT: never       (enlarged region)
                                      Score: CNN score
                Random              k-NN, resp. thresh.           When           Search window
LCT∗ [25]   LT0               CF
                   fern               Score: max. corr.         confident       (enlarged region)
                                              -                  Always          Search window
SRDCF [16] ST0       -        CF
                                      Score: max. corr.       (exp. forget.)    (enlarged region)
                              CF              -                  Always          Search window
ECO [29]    ST1      -
                          (deep f.)   Score: max. corr.        (clustering)     (enlarged region)
                                              -                  Always          Search window
ECOhc [29]  ST1      -        CF
                                      Score: max. corr.        (clustering)     (enlarged region)
                                              -                  Always          Search window
KCF [15]    ST0      -        CF
                                      Score: max. corr.       (exp. forget.)    (enlarged region)
                                              -                  Always          Search window
CSRDCF [17] ST0      -        CF
                                      Score: max. corr.       (exp. forget.)    (enlarged region)
                                              -                  Always          Search window
BACF [30]   ST0      -        CF
                                      Score: max. corr.       (exp. forget.)    (enlarged region)
                                              -                                  Search window
SiamFC [31] ST1      -      CNN                                   Never
                                      Score: max. corr.                         (enlarged region)
                                              -             When confident          Random
MDNet [18] ST1       -      CNN
                                      Score: CNN score      (hard negatives)        sampling
                                              -                  Always          Search window
CREST [32] ST0       -      CNN
                                      Score: max. corr.        (backprop)       (enlarged region)

a correlation filter for short-term component and a CNN retrieval system [33]
for detector. (v) FCLT [27] that uses a correlation filter for both, short-term
component and detector. (vi) CMT [22] that uses optical flow for short-term
component and key-points for detector. These trackers further vary in the fre-
quency and approach for model updates (see Table 2).
    In addition to the selected long-term trackers, we have included recent state-
of-the art short-term trackers. A standard discriminative correlation filter KCF [15],
four recent advanced versions SRDCF [16], CSRDCF [17], BACF [30], ECOhc [29]
and the top-performer on the OTB [1] benchmark ECO [29]. Two state-of-the-
art CNN-based top-performers from the VOT [34] benchmark SiamFC [31] and
MDNet [18] and a top-performing CNN-based tracker CREST [32] were included
as well. All these short-term trackers were modified to be LT0 compliant. A rea-
sonable score was identified in each tracker and used as the uncertainty score to
Now you see me: evaluating performance in long-term visual tracking                                    9

detect tracking failure. All trackers were integrated in the VOT [4] toolkit for
automatic evaluation.

Re-detection experiment. An experiment was designed to position the tested
trackers on the LT/ST spectrum, and in particular to verify their re-detection
capability. Artificial sequences were generated from the initial frame of each
sequence in our dataset, in these sequences the target appearance was kept
constant to emphasize the re-detection mechanism performance.
    An initial frame of a sequence was padded with zeros right and down to the
three times original size (Figure 4). This frame was repeated for the first five
frames in the artificial sequence. For the remainder of the frames, the target
was cropped from the initial image and placed in the bottom right corner of the
frame. A tracker was initialized in the first frame and we measured the number
of frames required to re-detect the target after position change.

                                    Random fern        Detector
                             FCLT
                                        Keypoints
                   MDNet
                                             Corr. filter
              SiamFC                             CNN
          ECO                                        Without

   ECOhc                                                       Short-term
                                                               component
CSRDCF                                                         Flow

                                                                Corr. filter
CREST
                                                                 CNN

PTAV

                                                                  Features
BACF
                                                                Hand-crafted

MUSTER                                                         CNN-based

        KCF
                                                                 Update
           TLD                                        When confident
                                                  Always (exp. forg.)
              SRDCF
                                             Always (clust.)
                       LCT
                                         P-N learn
                             CMT     Never

Fig. 3: Structure of the trackers. The links                                   Fig. 4: Re-detection experiment – the arti-
characterize tracker components. Color                                         ficially created sequence structure by rep-
codes performance on the LTB35 bench-                                          etition, padding and target displacement.
mark, yellow - best, blue worst.                                               For more, see text.

    Results are summarized in Table 3. The trackers MDNet, BACF, ECO,
ECOhc, SRDCF, SiamFC, CREST, CSRDCF and KCF never re-detected the
target, which confirms their short-term design. The only tracker that success-
fully re-detected the target was FCLT, while MUSTER, CMT and TLD were
successful in most sequences – this result classifies them as LT1 trackers. The
difference in detection success come from the different detector design. FCLT
and TLD both train template-based detectors. The improvement of the FCLT
likely comes from the efficient discriminative filter training framework of the
FCLT detector. The keypoint-based detectors in MUSTER and CMT are sim-
ilarly efficient, but require sufficiently well textured targets. Interestingly the
re-detection is imminent for Muster, CMT and TLD, while FCLT requires on
average 79 frames. This difference comes form the dynamic models. The Muster,
CMT and TLD apply a uniform dynamic model in the detector phase over the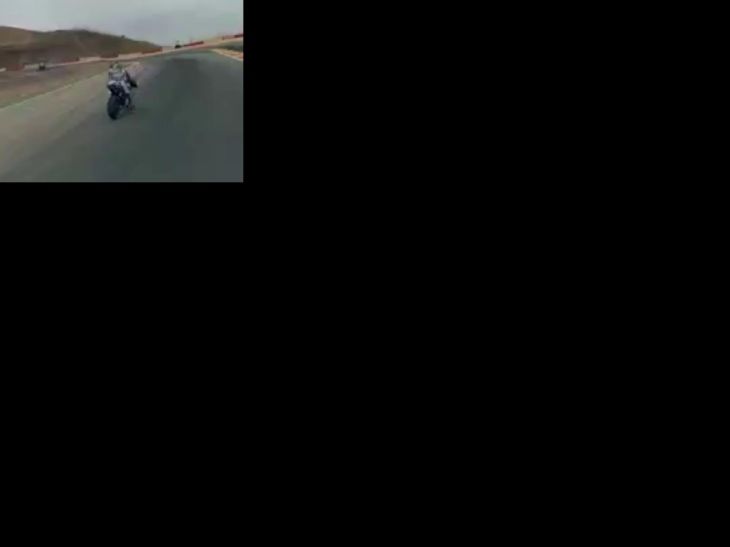
10      Lukežič A., Čehovin Zajc L., Vojı́ř T., Matas J., Kristan M.

Table 3: Re-detection results. Success – the number of successful re-detections in 35
sequences. Frames – the average number of frames before successful re-detection.
Tracker FCLT MUSTER CMT TLD PTAV LCT MDNet BACF ECO ECOhc SRDCF SiamFC CREST CSRDCF KCF
Success 35     29    28  17   1   0    0     0   0    0     0      0     0      0    0
Frames 79       0     1  0   35   -    -     -   -    -     -      -     -      -    -

entire image, while the FCLT applies a random walk model, that gradually in-
creases the target search range with time.
    Surprisingly two recent long-term trackers, LCT and PTAV nearly never suc-
cessfully detected the target. A detailed inspection of their source code revealed
that these trackers do not apply their detector to the whole image, but rather
a small neighborhood of the previous target position, which makes these two
trackers a pseudo long-term, i.e., LT0 level.

6.3   Overall performance

The overall performance on the TLB dataset is summarized in Figure 5. The
highest ranked is FCLT, an LT1 class tracker, which uses discriminative correla-
tion filters on hand-crafted features for short-term component as well as detec-
tor in the entire image. Surprisingly FCLT is followed by three short-term ST1
class CNN-based trackers MDNet, SiamFC and ECO. These implement different
mechanisms to deal with occlusion. MDNet applies very conservative updates,
SiamFC does not update the model at all and ECO applies clustering-based
update mechanism prevent learning from outliers. SiamFC applies a fairly large
search regions, while the search region size is adapted in the MDNet by a motion
model. Two long-term trackers CMT (LT1 ) and LCT (LT0 ) perform the worst
among the tested trackers. The CMT entirely relies on keypoints, which poorly
describe non-textured targets. The relatively poor performance of LCT is likely
due to small search window and poor detector learning. This is supported by the
fact that LCT performance is comparable to KCF, a standard correlation filter,
also used as the short-term component in LCT. The performance of short-term
trackers ST0 class trackers does not vary significantly.

6.4   Per-sequence evaluation

The sequences are divided into groups according to the number of target dis-
appearances: (Group 1) over ten disappearances, (Group 2) between one and
ten disappearances and (Group 3) no disappearances. Per-sequence F-scores are
summarized in Figure 6.
    Group 1 results: Most short-term trackers performed poorly due to lack of
target re-detection. Long-term trackers generally perform well, but there are
differences depending on their structure. For example, the “following” and “liv-
errun” sequences contain cars, which only moderately change the appearance.
SiamFC does not adapt the visual model and is highly successful on these se-
quences. The LCT generally performs poorly, except from “yamaha” sequence
Now you see me: evaluating performance in long-term visual tracking 11
Fig. 5: Long-term tracking performance on the LTB35 dataset. The average tracking
precision-recall curves (left), the corresponding F-score curves (right). Tracker labels
are sorted according to maximum of the F-score.
in which the target leaves and re-enters the view at the same location. Thus the
poor performance of LCT is due to a fairly small re-detection range. Surpris-
ingly some of the CNN short-term trackers perform moderately well (MDNet,
CREST and SiamFC), which is likely due to highly discriminative visual features
and relatively large target localization range.
Group 2 results: Performance variation comes from a mix of target disappear-
ance and other visual attributes. However, in “person14” the poor performance
is related to long-lasting occlusion at the beginning, where most trackers fail.
Only some of LT1 class trackers (FCLT, MUSTER, and TLD) overcome the
occlusion and obtain excellent performance.
Group 3 results: The performance of long-term trackers does not significantly
differ from short-term trackers since the target is always visible. The strength
of the features and learning in visual models play a major role. These sequences
are least challenging for all trackers in our benchmark.
6.5 Attribute evaluation
Figure 7 shows tracking performance with respect to ten visual attributes from
Section 5. Long-term tracking is mostly characterized by performance on full
occlusion and out-of-view attributes, since these require re-detection. The FCLT
(LT1 class) achieves top performance, which is likely due to the efficient learning
of the detector component. The other LT1 trackers, MUSTER and TLD perform
comparably to best short-term trackers (SiamFC and MDNet), while the CMT
performs poorly due to a poor visual model.
The other two challenging attributes are fast motion and deformable object.
Fast object motion is related to long-term re-detection, in both cases a large
search range is beneficial (FCLT, SiamFC, MDNet). Deformable objects require
quickly adaptable visual models, which is often in contradiction with the con-
servative updates that are required in long-term tracking.12 Lukežič A., Čehovin Zajc L., Vojı́ř T., Matas J., Kristan M.
Fig. 6: Maximum F-score of each tracker on all sequences. Sequences are sorted, left-to-
right, top-to-bottom, by the number of target disappearances, i.e. the largest number
at top-left. Red label: > 10 disappearances, green: 1 − 10, blue: no disappearance.
The similar objects attribute shows the capability of handling multiple ob-
jects in the image. The performance here is similar to the performance on
the short-term attributes since most of the trackers do not perform target re-
detection on the whole image. The trackers which perform full-image re-detection
have mechanism to prevent false detection of the similar targets, e.g., motion
model in FCLT or they are not very successful in re-detecting due to the weak
visual model like MUSTER and CMT.
6.6 Tracking speed analysis
Tracking speed is a decisive factor in many applications. We provide a detailed
analysis by three measures: (i) initialization time, (ii) maximum per-frame time
and (iii) average per-frame time. The initialization time is computed as the initial
frame processing time averaged over all sequences. The maximal time is com-
puted as the median of the slowest 10% of the frames averaged over all sequences.
The average time is averaged over all frames of the dataset. All measurements
are in milliseconds per frame (MPF). The tracking speed is given in Figure 8
with trackers categorized into three groups according to the average speed: fast
(> 15fps), moderately fast (1fps-15fps) and slow (< 1fps).Now you see me: evaluating performance in long-term visual tracking 13
Fig. 7: Maximum F-score averaged over overlap thresholds for the visual attributes. The
most challenging attributes are fast motion, full occlusion, out-of-view and deformable
object.
The fastest tracker is the KCF due to efficient model learning and localization
by fast Fourier transform. The slowest methods are CNN-based MDNet and
CREST due to the time-consuming model adaptation and MUSTER due to
slow keypoint extraction in detection phase. Several trackers exhibit a very high
initialization time (in order of several thousand MPF). The delay comes from
loading CNNs (SiamFC, ECO, PTAV, MDNet, CREST) or pre-calculating visual
models (ECOhc, CMT, TLD, SRDCF).
Ideally, the tracking speed is approximately constant over all frames, which is
reflected in small difference between the maximum per-frame and average time.
This difference is largest for the following trackers: ECOhc and ECO (due to
a time-consuming update every five frames), FCLT (due to re-detection on the
entire image, which is slow for large images), PTAV (due to the slow CNN-based
detector) and MDNet (due to the slow update during reliable tracking period).
Fig. 8: Speed performance of evaluated trackers. Trackers are ordered into three groups:
fast (left), moderately fast (middle) and slow (right). All numbers are in milliseconds
and an average speed frames-per-second is shown next to the name of each tracker.14 Lukežič A., Čehovin Zajc L., Vojı́ř T., Matas J., Kristan M.
7 Conclusions and discussion
The paper introduced a new long-term single-object tracking benchmark. We
proposed a short-term/long-term taxonomy of visual trackers that predicts per-
formance on sequences with long-term properties. New performance evaluation
measures, sensitive to long-term aspects of tracking, were proposed as well. These
measures offer significant insights into long-term tracker performance and re-
duce to a standard short-term performance measures in a short-term tracking
scenario, linking the two tracking problems.
We constructed a new dataset, the LTB35, which focuses on target disap-
pearances and emphasizes long-term tracking attributes. Six long-term and nine
short-term SOTA trackers were analyzed using the proposed methodology and
the dataset. The overall evaluation, presented in Section 6.3, shows that the
dataset is challenging, the best tracker achieves average F-score of 0.48, leaving
room for improvement. Results show that, apart from efficient target re-detection
mechanisms, careful updating of the visual model is crucial for dealing with long-
term sequences. This is supported by the fact that several short-term trackers
with conservative model updates perform well.
Results in Section 6.4 show that long-term tracking performance is not di-
rectly correlated with the sequence length, but rather with the number of target
disappearances. This is further highlighted in the per-attribute analysis (Sec-
tion 6.5) and supports our approach to the LTB35 dataset construction. Full
occlusions and out-of-view disappearances are among the most challenging at-
tributes. The other are fast motion (related to the search range of the tracker)
and deformable targets which requires highly adaptive and robust visual model.
Tracking speed analysis experiments show that reporting solely average speed
may be misleading and insufficient for applications that require short response
times. In Section 6.6 we show that many trackers, especially long-term, perform
very expensive re-detection or learning operations at regular or even unpre-
dictable time instances. Furthermore, initialization times for several trackers are
order of magnitude larger than the standard tracking iteration. We conclude
that additional information, like the maximum response time and initialization
times should be reported as part of standard analysis.Now you see me: evaluating performance in long-term visual tracking 15
References
1. Wu, Y., Lim, J., Yang, M.H.: Online object tracking: A benchmark. In: Comp.
Vis. Patt. Recognition. (2013) 2411– 2418
2. Smeulders, A., Chu, D., Cucchiara, R., Calderara, S., Dehghan, A., Shah, M.:
Visual tracking: An experimental survey. IEEE Trans. Pattern Anal. Mach. Intell.
36(7) (July 2014) 1442–1468
3. Liang, P., Blasch, E., Ling, H.: Encoding color information for visual tracking:
Algorithms and benchmark. IEEE Trans. Image Proc. 24(12) (Dec 2015) 5630–
5644
4. Kristan, M., Matas, J., Leonardis, A., Vojir, T., Pflugfelder, R., Fernandez, G.,
Nebehay, G., Porikli, F., Cehovin, L.: A novel performance evaluation methodology
for single-target trackers. IEEE Trans. Pattern Anal. Mach. Intell. (2016)
5. Leal-Taixé, L., Milan, A., Reid, I., Roth, S., Schindler, K.: MOTChallenge 2015:
Towards a benchmark for multi-target tracking. arXiv:1504.01942 [cs] (April 2015)
arXiv: 1504.01942.
6. Kristan, M., Leonardis, A., Matas, J., Felsberg, M., Pflugfelder, R., Cehovin Zajc,
L., Vojir, T., Hager, G., Lukezic, A., Eldesokey, A., Fernandez, G.: The visual
object tracking vot2017 challenge results. In: The IEEE International Conference
on Computer Vision (ICCV). (2017)
7. Wu, Y., Lim, J., Yang, M.H.: Object tracking benchmark. IEEE Trans. Pattern
Anal. Mach. Intell. 37(9) (Sept 2015) 1834–1848
8. Mueller, M., Smith, N., Ghanem, B.: A benchmark and simulator for uav tracking.
In: Proc. European Conf. Computer Vision. (2016) 445–461
9. Moudgil, A., Gandhi, V.: Long-term visual object tracking benchmark. arXiv
preprint arXiv:1712.01358 (2017)
10. Tao, R., Gavves, E., Smeulders, A.W.: Tracking for half an hour. arXiv preprint
arXiv:1711.10217 (2017)
11. Kristan, M., Pflugfelder, R., Leonardis, A., Matas, J., Porikli, F., Čehovin, L.,
Nebehay, G., Fernandez, G., Vojir, T.e.a.: The visual object tracking vot2013
challenge results. In: Vis. Obj. Track. Challenge VOT2013, In conjunction with
ICCV2013. (Dec 2013) 98–111
12. Kiani Galoogahi, H., Fagg, A., Huang, C., Ramanan, D., Lucey, S.: Need for speed:
A benchmark for higher frame rate object tracking. In: Int. Conf. Computer Vision.
(2017)
13. Cehovin Zajc, L., Lukezic, A., Leonardis, A., Kristan, M.: Beyond standard bench-
marks: Parameterizing performance evaluation in visual object tracking. In: Int.
Conf. Computer Vision. (2017)
14. Čehovin, L., Leonardis, A., Kristan, M.: Visual object tracking performance mea-
sures revisited. IEEE Trans. Image Proc. 25(3) (2016) 1261–1274
15. Henriques, J.F., Caseiro, R., Martins, P., Batista, J.: High-speed tracking with
kernelized correlation filters. IEEE Trans. Pattern Anal. Mach. Intell. 37(3) (2015)
583–596
16. Danelljan, M., Hager, G., Shahbaz Khan, F., Felsberg, M.: Learning spatially
regularized correlation filters for visual tracking. In: Int. Conf. Computer Vision.
(2015) 4310–4318
17. Lukežič, A., Vojı́ř, T., Čehovin Zajc, L., Matas, J., Kristan, M.: Discriminative
correlation filter with channel and spatial reliability. In: Comp. Vis. Patt. Recog-
nition. (2017) 6309–631816 Lukežič A., Čehovin Zajc L., Vojı́ř T., Matas J., Kristan M.
18. Nam, H., Han, B.: Learning multi-domain convolutional neural networks for visual
tracking. In: Comp. Vis. Patt. Recognition. (June 2016) 4293–4302
19. Danelljan, M., Häger, G., Khan, F.S., Felsberg, M.: Convolutional features for cor-
relation filter based visual tracking. In: IEEE International Conference on Com-
puter Vision Workshop (ICCVW). (Dec 2015) 621–629
20. Kalal, Z., Mikolajczyk, K., Matas, J.: Tracking-learning-detection. IEEE Trans.
Pattern Anal. Mach. Intell. 34(7) (July 2012) 1409–1422
21. Pernici, F., Del Bimbo, A.: Object tracking by oversampling local features. IEEE
Trans. Pattern Anal. Mach. Intell. 36(12) (2013) 2538–2551
22. Nebehay, G., Pflugfelder, R.: Clustering of static-adaptive correspondences for
deformable object tracking. In: Comp. Vis. Patt. Recognition. (2015) 2784–2791
23. Maresca, M.E., Petrosino, A.: Matrioska: A multi-level approach to fast tracking
by learning. In: Proc. Int. Conf. Image Analysis and Processing. (2013) 419–428
24. Hong, Z., Chen, Z., Wang, C., Mei, X., Prokhorov, D., Tao, D.: Multi-store tracker
(muster): A cognitive psychology inspired approach to object tracking. In: Comp.
Vis. Patt. Recognition. (June 2015) 749–758
25. Ma, C., Yang, X., Zhang, C., Yang, M.H.: Long-term correlation tracking. In:
Comp. Vis. Patt. Recognition. (2015) 5388–5396
26. Fan, H., Ling, H.: Parallel tracking and verifying: A framework for real-time and
high accuracy visual tracking. In: Int. Conf. Computer Vision. (2017) 5486–5494
27. Lukezic, A., Zajc, L.C., Vojı́r, T., Matas, J., Kristan, M.: FCLT - A fully-
correlational long-term tracker. CoRR abs/1711.09594 (2017)
28. Everingham, M., Van Gool, L., Williams, C.K., Winn, J., Zisserman, A.: The
PASCAL visual object classes (VOC) challenge. International journal of computer
vision 88(2) (2010) 303–338
29. Danelljan, M., Bhat, G., Shahbaz Khan, F., Felsberg, M.: Eco: Efficient convolution
operators for tracking. In: Comp. Vis. Patt. Recognition. (2017) 6638–6646
30. Kiani Galoogahi, H., Fagg, A., Lucey, S.: Learning background-aware correlation
filters for visual tracking. In: Int. Conf. Computer Vision. Number 1135–1143
(2017)
31. Bertinetto, L., Valmadre, J., Henriques, J.F., Vedaldi, A., Torr, P.H.: Fully-
convolutional siamese networks for object tracking. (2016)
32. Song, Y., Ma, C., Gong, L., Zhang, J., Lau, R.W.H., Yang, M.H.: Crest: Convolu-
tional residual learning for visual tracking. In: The IEEE International Conference
on Computer Vision (ICCV). (2017)
33. Tao, R., Gavves, E., Smeulders, A.W.M.: Siamese instance search for tracking. In:
Proceedings of the IEEE Conference on Computer Vision and Pattern Recognition.
(2016)
34. Kristan, M., Leonardis, A., Matas, J., Felsberg, M., Pflugfelder, R., Čehovin, L.,
Vojir, T., Häger, G., Lukežič, A., et al. Fernandez, G.: The visual object tracking
vot2016 challenge results. In: Proc. European Conf. Computer Vision. (2016)You can also read