Using Automated Machine Learning to Predict the Mortality of Patients With COVID-19: Prediction Model Development Study
←
→
Page content transcription
If your browser does not render page correctly, please read the page content below
JOURNAL OF MEDICAL INTERNET RESEARCH                                                                                                      Ikemura et al

     Original Paper

     Using Automated Machine Learning to Predict the Mortality of
     Patients With COVID-19: Prediction Model Development Study

     Kenji Ikemura1,2, MD; Eran Bellin3, MD; Yukako Yagi4, PhD; Henny Billett5, MD; Mahmoud Saada2, BS; Katelyn
     Simone2, MM; Lindsay Stahl3, MS; James Szymanski1, MD; D Y Goldstein1, MD; Morayma Reyes Gil1, MD, PhD
     1
      Department of Pathology, Albert Einstein College of Medicine, Montefiore Medical Center, The Bronx, NY, United States
     2
      Tsubomi Technology, The Bronx, NY, United States
     3
      Department of Epidemiology and Population Health and Medicine, Albert Einstein College of Medicine, Montefiore Medical Center, The Bronx, NY,
     United States
     4
      Department of Pathology, Memorial Sloan Kettering Cancer Center, New York, NY, United States
     5
      Department of Oncology and Medicine, Albert Einstein College of Medicine, Montefiore Medical Center, The Bronx, NY, United States

     Corresponding Author:
     Kenji Ikemura, MD
     Department of Pathology
     Albert Einstein College of Medicine
     Montefiore Medical Center
     111 E 210th St
     The Bronx, NY, 10467
     United States
     Phone: 1 9493703777
     Email: kikemura@montefiore.org

     Abstract
     Background: During a pandemic, it is important for clinicians to stratify patients and decide who receives limited medical
     resources. Machine learning models have been proposed to accurately predict COVID-19 disease severity. Previous studies have
     typically tested only one machine learning algorithm and limited performance evaluation to area under the curve analysis. To
     obtain the best results possible, it may be important to test different machine learning algorithms to find the best prediction model.
     Objective: In this study, we aimed to use automated machine learning (autoML) to train various machine learning algorithms.
     We selected the model that best predicted patients’ chances of surviving a SARS-CoV-2 infection. In addition, we identified
     which variables (ie, vital signs, biomarkers, comorbidities, etc) were the most influential in generating an accurate model.
     Methods: Data were retrospectively collected from all patients who tested positive for COVID-19 at our institution between
     March 1 and July 3, 2020. We collected 48 variables from each patient within 36 hours before or after the index time (ie, real-time
     polymerase chain reaction positivity). Patients were followed for 30 days or until death. Patients’ data were used to build 20
     machine learning models with various algorithms via autoML. The performance of machine learning models was measured by
     analyzing the area under the precision-recall curve (AUPCR). Subsequently, we established model interpretability via Shapley
     additive explanation and partial dependence plots to identify and rank variables that drove model predictions. Afterward, we
     conducted dimensionality reduction to extract the 10 most influential variables. AutoML models were retrained by only using
     these 10 variables, and the output models were evaluated against the model that used 48 variables.
     Results: Data from 4313 patients were used to develop the models. The best model that was generated by using autoML and
     48 variables was the stacked ensemble model (AUPRC=0.807). The two best independent models were the gradient boost machine
     and extreme gradient boost models, which had an AUPRC of 0.803 and 0.793, respectively. The deep learning model (AUPRC=0.73)
     was substantially inferior to the other models. The 10 most influential variables for generating high-performing models were
     systolic and diastolic blood pressure, age, pulse oximetry level, blood urea nitrogen level, lactate dehydrogenase level, D-dimer
     level, troponin level, respiratory rate, and Charlson comorbidity score. After the autoML models were retrained with these 10
     variables, the stacked ensemble model still had the best performance (AUPRC=0.791).
     Conclusions: We used autoML to develop high-performing models that predicted the survival of patients with COVID-19. In
     addition, we identified important variables that correlated with mortality. This is proof of concept that autoML is an efficient,
     effective, and informative method for generating machine learning–based clinical decision support tools.

     https://www.jmir.org/2021/2/e23458                                                                  J Med Internet Res 2021 | vol. 23 | iss. 2 | e23458 | p. 1
                                                                                                                       (page number not for citation purposes)
XSL• FO
RenderX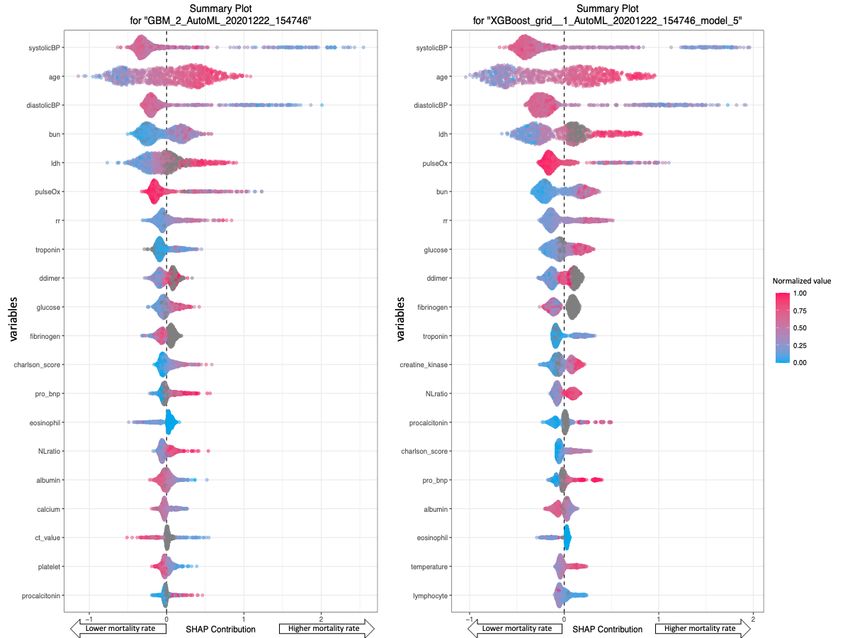
JOURNAL OF MEDICAL INTERNET RESEARCH                                                                                                Ikemura et al

     (J Med Internet Res 2021;23(2):e23458) doi: 10.2196/23458

     KEYWORDS
     automated machine learning; COVID-19; biomarker; ranking; decision support tool; machine learning; decision support; Shapley
     additive explanation; partial dependence plot; dimensionality reduction

     Introduction                                                         Methods
     Many regions worldwide are still fighting the first wave of the      Variable Selection and Collection
     COVID-19 pandemic, while other areas that have reopened are          After conducting a literature review, we selected 48 variables
     experiencing a resurgence of cases [1]. During such an emergent      for generating high-performing machine learning models. These
     situation, it is important for clinicians to effectively and         variables included demographics such as gender; race; age;
     efficiently triage patients. In recent months, studies have          comorbidities; physical signs/symptoms; and laboratory test
     proposed several machine learning models that can accurately         results, such as ferritin, interleukin-6, tumor necrosis factor-α,
     predict COVID-19 disease severity. Many of these studies have        D-dimer, C-reactive protein, and lactic dehydrogenase (LDH)
     been successful in generating a high-performing model [2-4].         levels [2-4, 6-12].
     However, until now, these models have only been trained on
     one kind of machine learning algorithm, and many researchers         Data collection and analysis were approved by the Albert
     have limited the evaluation of their models’ performance to area     Einstein College of Medicine Institutional Review Board. The
     under the curve (AUC) analysis. Studies have either not reported     data were collected by using Clinical Looking Glass (CLG),
     areas under the precision-recall curve (AUPRCs) or have only         which is an interactive software application that was developed
     reported low AUPRCs. Furthermore, these studies have been            at the Montefiore Medical Center. This application is used to
     difficult to replicate due to hyperparameter tuning. The             evaluate health care quality, effectiveness, and efficiency. CLG
     automation of machine learning end-to-end processes has              integrates clinical and administrative data sets, thereby allowing
     allowed for the development of simple, fast, and                     clinicians to build temporally sophisticated cohorts and assess
     easy-to-replicate models that often outperform manually              outcomes [13-16].
     designed models. This study was designed to (1) optimize the         We queried the CLG database for patients who were aged >18
     performance of predictive models by using automated machine          years, tested positive for COVID-19 (ie, confirmed with a
     learning (autoML) to generate various machine learning models        nasopharyngeal specimen and real-time polymerase chain
     and automate hyperparameter optimization; and (2) choose the         reaction) within 24 hours before or after admission, and were
     best performing machine learning model based on AUPRCs.              admitted to our institution from March 1 to July 3, 2020. The
     Artificial intelligence (ie, machine learning) models have often     index time was when a patient tested positive for COVID-19
     been criticized for being black-box models. We tried to stare        based on their real-time polymerase chain reaction results. We
     into this so-called “black box,” identify the variables that drive   investigated a total of 48 variables and used the earliest values
     model performance, and understand the extent of these variables’     that were available within 36 hours before or after the index
     effects on model performance. The interpretability of models         time. The outcome of interest was mortality from any cause
     is crucial in medical environments; for results to be widely         within 30 days after the index time.
     accepted, they must be explainable to medical providers. To
                                                                          Model Development and Evaluation
     assess the correctness of a model, clinicians must be able to use
     their intuition. Therefore, a model’s response must be               We used the open-source H2O.ai autoML package for the R
     understandable to clinicians and comparable to biologically          language [17-19]. The package can be downloaded to a local
     plausible expectations.                                              device. This allowed us to avoid uploading patient data to a
                                                                          third-party cloud service. The H2O.ai autoML package trains
     In this study, we aimed to generate multiple machine learning        and cross-validates common machine learning algorithms, such
     models, assess their performance, and select the                     as gradient boosting machine (GBM), extreme gradient boosting
     highest-performing model. After ranking variables by                 (XGBoost), general linear models (GLMs), random forest (RF),
     importance, we chose the top 10 most influential variables and       and deep learning (DL). In addition, the package trains two
     retrained the autoML models to generate new models that only         types of stacked ensemble models—one based on all previously
     used these 10 variables. This was done to create high-performing     trained models and another based on the best model of each
     models with low dimensionality. In addition, we sought to            model family. Additional information on how each model was
     provide interpretable black-box model results to clinicians and      built and which hyperparameters were tuned via autoML can
     patients. Finally, the COVID-19 mortality calculator, which is       be found in documentation that is provided by H2O.ai [18,19].
     based on this study, was developed and freely available online
     as a web application [5].This study provides proof of concept        We used the 10-fold cross-validation method to train the autoML
     that autoML is an efficient, effective, and informative method       model on a randomly selected data set that included 80% of the
     for building machine learning–based clinical decision support        original data. We then used the trained autoML model to
     tools.                                                               generate 20 models and rank them in order of performance (ie,
                                                                          AUPRC). These 20 models were based on the remaining 20%
                                                                          of the original data set.

     https://www.jmir.org/2021/2/e23458                                                            J Med Internet Res 2021 | vol. 23 | iss. 2 | e23458 | p. 2
                                                                                                                 (page number not for citation purposes)
XSL• FO
RenderX
JOURNAL OF MEDICAL INTERNET RESEARCH Ikemura et al
The AUPRC is a measure of a model’s predictive performance, A PD plot is a graphical depiction of a variable’s marginal effect
which is based on the relationship between the positive on the predicted outcome (ie, mortality). The effect of a variable
predictive value (PPV) for the outcome (ie, death; y-axis) and was measured with mean response values. In this study,
the model’s sensitivity for detecting patients who actually die mortality had a response value of 1, which indicates a 100%
(ie, x-axis). For reproducibility, we did not use the DL method chance of dying. A PD plot can show whether the relationship
and trained each model separately. For convenience, we named between a target and a feature is linear, monotonic, or complex
the best model that was generated with 48 variables MODEL-48. [21].
After creating Shapley additive explanation (SHAP) and partial
dependence (PD) plots to evaluate MODEL-48, we selected the
Choosing the Top 10 Most Important Variables:
10 most influential variables. We used these 10 variables to Dimensionality Reduction
repeat model training, model ranking, and the selection of the Dimensionality reduction is an important process in machine
best performing autoML-generated model. For convenience, learning model development. Sometimes, the variables in a
we named the best model that was generated with these 10 model correlate with each other, making them redundant
variables MODEL-10. variables (ie, blood urea nitrogen [BUN] level, creatinine level,
and estimated glomerular filtration rate are all indicators of renal
To further evaluate MODEL-48 and MODEL-10, we generated
function). If we could generate a model with a low number of
a binary classifier (ie, dead or alive within 30 days). We chose
unique variables, we would be able to shorten computation
a threshold probability that maximized the F2 score of each
times in real clinical settings. In addition, dimension reduction
model. Unlike the F1 score, which gives equal weight to
allows models to overcome data sparsity by using variables that
precision (ie, PPV) and sensitivity (ie, recall), the F2 score gives
have more data points. Furthermore, by identifying the top 10
more weight to sensitivity and penalizes a model for generating
most important variables, clinicians can focus on ordering
more false negatives than false positives. As our goal was to
medical tests instead of obtaining data on 48 variables, and
identify patients who were at a high risk of death (ie, patients
machine learning developers can have fewer concerns about
who need more attention and further intervention), our model’s
handling missing values.
metric of success was based on enhancing its sensitivity for
detecting patients who were at risk of death. However, this came In this study, after evaluating SHAP and PD plots, we chose
with the drawback of overcalling death as a predicted outcome. the 10 most influential variables for generating MODEL-10 (ie,
Sensitivity, specificity, PPVs, and negative predicative values a model that requires only 10 input variables to predict
(NPVs) were calculated for each binary classifier. The F-score mortality). We first ranked each variable’s influence according
calculation formula was as follows: to the SHAP values in the highest-performing models.
Afterward, we chose variables that were influential in these
models. Subsequently, if the rank of a variable was not the same
in each model, we chose variables based on clinical insights.
Clinically speaking, we wanted at least one unique variable for
In this formula, to calculate the F2 score, β must equal 2. each biological process (ie, cardiac processes, renal processes,
coagulation processes, etc). If there was more than a single
Opening the Black Box: Intuitive Understanding of variable for describing the same clinical domain or biological
Model Variable Utility process (ie, troponin and probrain natriuretic peptide levels),
Once a model determined the most important variable in its we chose the variable with the fewest number of missing data
internal black box, we used SHAP and PD plots to develop our points (ie, variables that are commonly ordered by clinicians).
understanding of the black box. A SHAP plot displays variables Handling Missing Values
in a top-to-bottom format; the most important variable is
displayed at the top and the least important variable is displayed Different autoML models have different methods for handling
at the bottom. Variable importance is determined by the model missing values. For example, in a tree-based model (ie, GBM,
in question. In this study, SHAP values (ie, x-axis) were XGBoost, RF models), missing values are interpreted as data
indicative of the relative contribution of each patient’s variable that contain information (ie, data that are missing for a reason)
values (eg, a systolic blood pressure of 50 mmHg) to the overall instead of data that are missing at random. During tree building,
prediction of a patient’s mortality. SHAP values of >0 on the split decisions are made at every node. Each decision is based
x-axis were indicative of variables that contribute to a greater on the option that minimizes the loss of model functionality and
chance of mortality, and SHAP values ofJOURNAL OF MEDICAL INTERNET RESEARCH Ikemura et al
Figure 1. Flowchart summary of our methodology. AutoML: automated machine learning; AUPRC: area under the precision-recall curve; NPV:
negative predictive value; PD: partial dependence; PPV: positive predictive value; SHAP: Shapley additive explanation.
Data Access, Responsibility, and Analysis Results
KI had full access to all the data in this study. KI takes
Study Population
responsibility for the integrity of the data and the accuracy of
the data analysis. Between March 1 and July 3, 2020, 4313 adult patients tested
positive for COVID-19 and were admitted to a Montefiore
Health System hospital within 24 hours of their first
COVID-19–positive test. Of these 4313 patients, 1087 (25.2%)
died within 30 days of infection (Figure 2).
Figure 2. A graph that shows the number of patients who were admitted to the hospital due to SARS-CoV-2 infection (ie, blue line; number of cases
per day) and the number of patients who died (ie, red line; number of deaths per day). Data were collected from March 1 to July 3, 2020 at the Montefiore
Medical Center.
https://www.jmir.org/2021/2/e23458 J Med Internet Res 2021 | vol. 23 | iss. 2 | e23458 | p. 4
(page number not for citation purposes)
XSL• FO
RenderXJOURNAL OF MEDICAL INTERNET RESEARCH Ikemura et al
A summary of case data, patients’ survival rates, and patients’ patients. Summaries of the variables for the entire cohort, the
demographic characteristics is shown in Table 1. The training training data set, and the testing data sets are provided in Tables
set consisted of 3468 patients, and the test set consisted of 845 S1, S2, and S3 in Multimedia Appendix 1.
Table 1. Summary of patients’ demographic characteristics.
Characteristics Value
Age (years), mean (SD) 63.97 (16.77)
Gender, n (%)
Male 2289 (53.07)
Female 2024 (46.93)
Hispanic ethnicity, n (%) 1785 (41.38)
Race, n (%)
Asian 113 (2.61)
Black 1560 (36.17)
White 428 (9.92)
Other Pacific Islander 4 (0.09)
Native American or Alaskan 5 (0.12)
Unknown/undeclared 418 (9.69)
Other 1785 (41.39)
Charlson score, mean (SD) 2.3 (2.34)
Charlson score of 1, n (%)
Myocardial infarction 235 (5.44)
Congestive heart failure 702 (16.28)
Peripheral vascular disease 145 (3.36)
Cerebrovascular disease 334 (7.74)
Dementia 716 (16.6)
Chronic pulmonary disease 1030 (23.88)
Rheumatic disease 70 (1.62)
Peptic ulcer disease 33 (0.77)
Mild liver disease 197 (4.57)
Diabetes without chronic complications 616 (14.28)
Charlson score of 2, n (%)
Diabetes with chronic complications 999 (23.16)
Hemiplegia or paraplegia 118 (2.74)
Renal disease 1314 (30.47)
Any malignancy 178 (4.13)
Charlson score of 3, n (%)
Moderate or severe liver disease 28 (0.65)
Charlson score of 6, n (%)
Metastatic solid tumor 58 (1.34)
AIDS/HIV 40 (0.93)
Survivors after 30 days, n (%) 3226 (74.8)
Length of hospital stay to death (number of days)a, mean (SD) 8.4 (6.91)
a
In total, 1087 patients died within 30 days of infection.
https://www.jmir.org/2021/2/e23458 J Med Internet Res 2021 | vol. 23 | iss. 2 | e23458 | p. 5
(page number not for citation purposes)
XSL• FO
RenderXJOURNAL OF MEDICAL INTERNET RESEARCH Ikemura et al
MODEL-48 Generation and Performance independent models were the GBM and XGBoost models, which
The output of the 20 machine learning models that were trained had an AUPRC of 0.803 and 0.793, respectively. The distributed
via autoML is depicted in Table 2. The best performing model RF model (AUPRC=0.783) came in 14th place and the GLM
was the stacked ensemble of all machine learning models (AUPRC=0.738) came in last place. The DL model was
(AUPRC=0.806). This was MODEL-48. The best performing generated separately from the autoML models for reproducibility
purposes. The AUPRC of the DL model plateaued at 0.736.
Table 2. Output of the automated machine learning models that used 48 variables. Model ranks are ordered according to AUPRCsa.
Rank Model ID AUPRC Area under the curve
1 StackedEnsemble_AllModels_AutoML_20201219_141057 0.807 0.917
2 GBM_2_AutoML_20201219_141057 0.803 0.911
3 StackedEnsemble_BestOfFamily_AutoML_20201219_141057 0.800 0.912
4 XGBoost_grid__1_AutoML_20201219_141057_model_5 0.793 0.907
5 GBM_5_AutoML_20201219_141057 0.792 0.907
6 GBM_3_AutoML_20201219_141057 0.791 0.908
7 XGBoost_2_AutoML_20201219_141057 0.790 0.905
8 XGBoost_grid__1_AutoML_20201219_141057_model_6 0.790 0.910
9 XGBoost_grid__1_AutoML_20201219_141057_model_4 0.788 0.903
10 XGBoost_3_AutoML_20201219_141057 0.788 0.910
11 GBM_grid__1_AutoML_20201219_141057_model_3 0.785 0.909
12 GBM_grid__1_AutoML_20201219_141057_model_2 0.785 0.898
13 GBM_4_AutoML_20201219_141057 0.784 0.914
14 DRF_1_AutoML_20201219_141057 0.784 0.905
15 GBM_grid__1_AutoML_20201219_141057_model_1 0.782 0.913
16 GBM_1_AutoML_20201219_141057 0.781 0.903
17 XGBoost_grid__1_AutoML_20201219_141057_model_1 0.779 0.896
18 XGBoost_grid__1_AutoML_20201219_141057_model_3 0.779 0.909
19 XRT_1_AutoML_20201219_141057 0.775 0.899
20 XGBoost_grid__1_AutoML_20201219_141057_model_2 0.769 0.893
21 XGBoost_1_AutoML_20201219_141057 0.763 0.899
22 GLM_1_AutoML_20201219_141057 0.738 0.877
a
AUPRC: area under the precision-recall curve.
indicated whether the effect of a variable was associated with
Variable Importance a higher or lower chance of death [22]. Variable-specific SHAP
Figure 3 shows the SHAP plots for the GBM and XGBoost values of >0 indicated an increased risk of death. For example,
models. In these plots, variables were ranked in descending the GBM and XGBoost models determined that systolic blood
order of importance. Each patient was represented by one dot pressure was the most important variable, followed by age and
on each variable line. The horizontal location of each dot diastolic blood pressure.
https://www.jmir.org/2021/2/e23458 J Med Internet Res 2021 | vol. 23 | iss. 2 | e23458 | p. 6
(page number not for citation purposes)
XSL• FO
RenderXJOURNAL OF MEDICAL INTERNET RESEARCH Ikemura et al
Figure 3. SHAP summary plots of the GBM and XGBoost models. According to the GBM and XGBoost models, higher systolic blood pressure levels
(ie, red dots) were associated with a lower probability of death (ie, the left side of the vertical dotted line), and older age (ie, red dots) was associated
with higher probability of death (ie, the right side of the vertical dotted line). BUN: blood urea nitrogen; charlson_score: charlson comorbidity index;
ct_value: cycle threshold value; diastolicBP: diastolic blood pressure; GBM: gradient boosting machine; LDH: lactate dehydrogenase; NLratio:
neutrophil-lymphocyte ratio; pro_bnp: pro-brain natriuretic peptide; pulseOx: pulse oximetry; rr: respiratory rate; SHAP: Shapley additive explanation;
systolicBP: systolic blood pressure; XGBoost: extreme gradient boosting.
PD plots show the marginal effect that one variable can have increased with age (ie, starting at around 50 years of age).
on the predicted outcome of a machine learning model. PD plots Similarly, all models determined that percent mortality increased
for the most influential variables are depicted in Multimedia with glucose level. However, this was only true for glucose
Appendix 2. Each line in a PD plot depicts the best performing levels ofJOURNAL OF MEDICAL INTERNET RESEARCH Ikemura et al
Figure 4. Partial dependence plots for age and glucose level. Partial dependence plots for the other variables are shown in Multimedia Appendix 2.
Each line represents a different machine learning algorithm. DRF: distributed random forest; GBM: gradient boosting machine; GLM: generalized
linear model; XGBoost, extreme gradient boosting; XRT: extremely randomized trees.
https://www.jmir.org/2021/2/e23458 J Med Internet Res 2021 | vol. 23 | iss. 2 | e23458 | p. 8
(page number not for citation purposes)
XSL• FO
RenderXJOURNAL OF MEDICAL INTERNET RESEARCH Ikemura et al
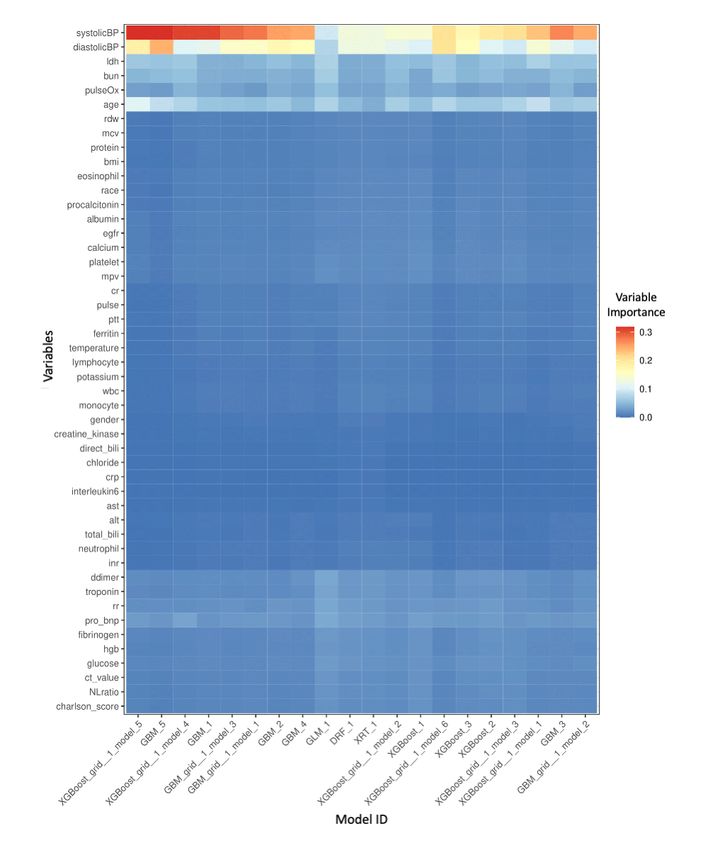
Figure 5. A heatmap that represents the importance of each variable in every machine learning model. DRF: distributed random forest; GBM: gradient
boosting machine; GLM: generalized linear model; XGBoost: extreme gradient boosting; XRT: extremely randomized trees.
and cardiac function, respectively. With regard to our marker
Selection of the Top 10 Variables: Dimensionality for coagulation, we chose D-dimer level over fibrinogen level
Reduction because it ranked higher and had more data points. Furthermore,
The SHAP plots for the GBM and XGBoost models (ie, the two we used Charlson comorbidity scores to represent comorbidities.
highest-performing models) showed that systolic and diastolic Glucose level was also a highly ranked variable. This was likely
blood pressure, age, LDH level, pulse oximetry level, respiratory due to the increased risk of mortality in patients with diabetes.
rate, BUN level, and troponin level were top 10 variables in However, since the Charlson comorbidity score also accounts
both models. BUN and troponin levels are indicators of renal for diabetes, we believed that the Charlson comorbidity score
https://www.jmir.org/2021/2/e23458 J Med Internet Res 2021 | vol. 23 | iss. 2 | e23458 | p. 9
(page number not for citation purposes)
XSL• FO
RenderXJOURNAL OF MEDICAL INTERNET RESEARCH Ikemura et al
was a more comprehensive predictive variable than glucose level, D-dimer level, and Charlson comorbidity score. We
level. To confirm whether our choice to use Charlson believed that these variables provided a good representation of
comorbidity score over glucose level was justified, we trained biological processes that are affected by SARS-CoV-2 infection.
an autoML model on Charlson comorbidity score data (ie, In addition, these variables are easy to obtain in clinical settings.
without glucose level data). We then compared it to a model They also reduce the incidence of missing values.
that was trained on glucose level data (ie, without Charlson
comorbidity score data). The former model (AUPRC=0.79)
MODEL-10 Generation and Performance
performed better than the latter model (AUPRC=0.78), thereby We used the top 10 influential variables to generate 20 more
validating our choice. machine learning models and rank them in order of AUPRC
(Table 3). The best performing model was the stacked ensemble
According to our variable selection process, the top predictive of each machine learning algorithm family (AUPRC=0.791).
variables were systolic and diastolic blood pressure, age, LDH This was MODEL-10. The best performing independent model
level, pulse oximetry level, respiratory rate, BUN level, troponin was the XGBoost model, which had an AUPRC of 0.790.
Table 3. Output of the automated machine learning models that used 10 variables. Model ranks are ordered according to AUPRCsa.
Rank Model ID AUPRC Area under the curve
1 StackedEnsemble_BestOfFamily_AutoML_20201219_142406 0.791 0.903
2 XGBoost_grid__1_AutoML_20201219_142406_model_6 0.790 0.894
3 StackedEnsemble_AllModels_AutoML_20201219_142406 0.790 0.903
4 GBM_3_AutoML_20201219_142406 0.782 0.898
5 GBM_5_AutoML_20201219_142406 0.782 0.897
6 DRF_1_AutoML_20201219_142406 0.780 0.899
7 XGBoost_grid__1_AutoML_20201219_142406_model_5 0.777 0.893
8 GBM_2_AutoML_20201219_142406 0.777 0.904
9 XGBoost_grid__1_AutoML_20201219_142406_model_1 0.777 0.896
10 XRT_1_AutoML_20201219_142406 0.776 0.900
11 GBM_grid__1_AutoML_20201219_142406_model_1 0.775 0.899
12 XGBoost_grid__1_AutoML_20201219_142406_model_4 0.775 0.894
13 XGBoost_3_AutoML_20201219_142406 0.772 0.891
14 GBM_grid__1_AutoML_20201219_142406_model_2 0.770 0.896
15 GBM_grid__1_AutoML_20201219_142406_model_3 0.770 0.900
16 GBM_1_AutoML_20201219_142406 0.769 0.895
17 XGBoost_2_AutoML_20201219_142406 0.766 0.890
18 GBM_4_AutoML_20201219_142406 0.766 0.897
19 XGBoost_1_AutoML_20201219_142406 0.762 0.886
20 XGBoost_grid__1_AutoML_20201219_142406_model_3 0.761 0.885
21 XGBoost_grid__1_AutoML_20201219_142406_model_2 0.754 0.889
22 GLM_1_AutoML_20201219_142406 0.733 0.860
a
AUPRC: area under the precision-recall curve.
0.735, 0.513, and 0.968, respectively (Figure 6). The maximum
Performance of MODEL-48 and MODEL-10 as Binary F2 score of MODEL-10 was 0.779, and the probability threshold
Classifiers was 0.202. The binary classifier for this threshold had a
The maximum F2 score of MODEL-48 was 0.793, and the sensitivity, specificity, PPV, and NPV of 0.838, 0.836, 0.609,
probability threshold was 0.110. The binary classifier for this and 0.944, respectively (Figure 7).
threshold had a sensitivity, specificity, PPV, and NPV of 0.919,
https://www.jmir.org/2021/2/e23458 J Med Internet Res 2021 | vol. 23 | iss. 2 | e23458 | p. 10
(page number not for citation purposes)
XSL• FO
RenderXJOURNAL OF MEDICAL INTERNET RESEARCH Ikemura et al
Figure 6. Binary classifier of MODEL-48. The model had an optimized F2-score threshold. This classifier had a sensitivity of 0.92, a specificity of
0.74, a positive predictive value of 0.51, and a negative predictive value of 0.97.
Figure 7. Binary classifier of MODEL-10. The model had an optimized F2-score threshold. This classifier had a sensitivity of 0.84, a specificity of
0.84, a positive predictive value of 0.61, and a negative predictive value of 0.94.
in which the model must perform; without this information, the
Discussion model is irrelevant.
Principal Findings Machine learning models can be used to enhance electronic
We were able to use autoML and clinical values (ie, those that medical record systems and calculate the values of variables
were collected early during a patient’s admission to a hospital) that are collected from patients. Based on the performance of
to successfully generate multiple machine learning models, MODEL-10, our dimensionality reduction process was
assess their performance, and select the highest-performing successful; 10 variables were enough to generate
models for predicting patients’ chances of surviving a high-performing models. This shows that not all parameters are
SARS-CoV-2 infection. In addition, our study demonstrates necessary for performing calculations and making predictions.
that machine learning models that only use 10 clinical variables Clinicians and hospitals should begin the patient assessment
can predict survival. These models also had high sensitivity process by prioritizing the ordering of medical tests (ie, tests
values, specificity values, and NPVs. Therefore, autoML is an for the 10 variables). Dimensionality reduction not only reduced
efficient, informative, and easily reproducible method. The the number of variables we needed to consider, but also
clinical implementation of autoML-based models may require minimized the number of missing values in the data set and
further investigation. However, we demonstrate that autoML reduced the risk of imputation bias. This may be the reason why
is a comprehensive approach for building machine the performance of MODEL-10 was similar to that of
learning–based clinical decision support tools. MODEL-48. These 10 variables may also help researchers with
conducting studies on unique cohorts and reproducing our
Our results show that the best models were GBM and XGBoost results.
models. They both had high performance, as determined by
their AUPRCs and AUCs. The RF model, DL model, and GLM The purpose of autoML is not limited to predicting the survival
performed substantially worse compared to the GBM and of patients with COVID-19. AutoML can be used to generate
XGBoost models. The DL model may have performed better models that are based on other types of clinical data and predict
if we had a larger data set, but our DL model required much other outcomes (eg, models for predicting which patients require
longer training times than the other models. Tree-based machine a ventilator). We hope that our study helps other researchers
learning algorithms (eg, GBM, XGBoost, and RF) are more with applying our autoML approach, accelerating the
efficient, and possibly more effective, than neural network implementation of artificial intelligence models into medical
algorithms in terms of analyzing tabular data. We used the systems, and delivering better medical care.
AUPRC as our metric of model utility because it accounts for Clinical Insights From the Black Box
the two critical clinical performance metrics that were of specific
interest to us—the positive predictive value and sensitivity. We The trade-off between predictive power and interpretability is
wanted to identify patients who were likely to die so that we a common issue when working with black-box models,
could take action and treat as many patients as possible. especially in medical environments where results have to be
Alternatively, the AUC accounts for model sensitivity and explained to medical providers and patients. Interpretability is
specificity and ignores the effects of mortality prevalence on crucial for questioning, understanding, and trusting artificial
model performance. The prevalence of mortality sets the context intelligence and machine learning systems. According to our
variable importance heatmap (Figure 5), many models
https://www.jmir.org/2021/2/e23458 J Med Internet Res 2021 | vol. 23 | iss. 2 | e23458 | p. 11
(page number not for citation purposes)
XSL• FO
RenderXJOURNAL OF MEDICAL INTERNET RESEARCH Ikemura et al
determined that age, pulse oximetry level, and systolic and predictor’s for disease progression at admission had similar
diastolic blood pressure were important variables for predicting mortality rates [28]. The results from our machine learning
the outcome. Biomarkers such as BUN level, LDH level, models are in line with those of the logistic regression analysis.
estimated glomerular filtration rate, and probrain natriuretic
In our study, systolic and diastolic blood pressure were the most
peptide level were also influential variables. These findings
important variables. However, these variables may simply
show that our model results are in line with the clinical findings
indicate that patients with severe illnesses and hypotension are
of other researchers [23-27].
at an imminent risk of death. Temporal features were not
Our SHAP and PD plots provided insight into the black box. considered in our analysis. For example, we did not determine
The SHAP plots allowed us to determine the importance of whether hypotension at admission was an important variable
variables and provided information on how the variables for patients who survive during the first 24 hours of admission.
influenced models’ predictions. Alternatively, PD plots provide Further, we did not determine whether a variable’s importance
numerical information on a variable’s effects. For example, the diminishes in populations that survive after the first 48 or 72
SHAP plots for the GBM and XGBoost models showed that hours of admission. In a future study, we would like to test
high glucose levels were associated with an increased probability whether our models are robust enough to predict death during
of mortality (ie, high SHAP value). Additionally, the PD plots different times of admission. For example, we would test our
showed that increases in glucose level were proportional to models’ performance for predicting the death of patients within
increases in patients’ chances of death. However, this was only the first week of admission and the fourth week after admission.
true for glucose levels ofJOURNAL OF MEDICAL INTERNET RESEARCH Ikemura et al
with triaging patients during the COVID-19 pandemic. Our is freely available online as a web-based computer application
COVID-19 mortality calculator, which is based on this study, [5].
Conflicts of Interest
None declared.
Multimedia Appendix 1
Summary of all variables that were collected from the entire cohort and used in the training and testing data sets.
[PDF File (Adobe PDF File), 181 KB-Multimedia Appendix 1]
Multimedia Appendix 2
Partial dependence plots of the most important variables.
[PDF File (Adobe PDF File), 317 KB-Multimedia Appendix 2]
References
1. COVID data tracker. Centers for Disease Control and Prevention. URL: https://www.cdc.gov/coronavirus/2019-ncov/
cases-updates/cases-in-us.html [accessed 2021-02-12]
2. Cheng FY, Joshi H, Tandon P, Freeman R, Reich DL, Mazumdar M, et al. Using machine learning to predict ICU transfer
in hospitalized COVID-19 patients. J Clin Med 2020 Jun 01;9(6):1668 [FREE Full text] [doi: 10.3390/jcm9061668]
[Medline: 32492874]
3. Vaid A, Somani S, Russak AJ, De Freitas JK, Chaudhry FF, Paranjpe I, et al. Machine learning to predict mortality and
critical events in a cohort of patients with COVID-19 in New York City: Model development and validation. J Med Internet
Res 2020 Nov 06;22(11):e24018 [FREE Full text] [doi: 10.2196/24018] [Medline: 33027032]
4. Yan L, Zhang HT, Goncalves J, Xiao Y, Wang M, Guo Y, et al. An interpretable mortality prediction model for COVID-19
patients. Nat Mach Intell 2020 May 14;2:283-288 [FREE Full text] [doi: 10.1038/s42256-020-0180-7]
5. Montefiore Medical Center. Tsubomi Technology. URL: https://www.tsubomi.tech/ [accessed 2021-02-23]
6. Castro VM, McCoy TH, Perlis RH. Laboratory findings associated with severe illness and mortality among hospitalized
individuals with coronavirus disease 2019 in eastern Massachusetts. JAMA Netw Open 2020 Oct 01;3(10):e2023934 [FREE
Full text] [doi: 10.1001/jamanetworkopen.2020.23934] [Medline: 33125498]
7. Liang W, Liang H, Ou L, Chen B, Chen A, Li C, China Medical Treatment Expert Group for COVID-19. Development
and validation of a clinical risk score to predict the occurrence of critical illness in hospitalized patients with COVID-19.
JAMA Intern Med 2020 Aug 01;180(8):1081-1089 [FREE Full text] [doi: 10.1001/jamainternmed.2020.2033] [Medline:
32396163]
8. Kermali M, Khalsa RK, Pillai K, Ismail Z, Harky A. The role of biomarkers in diagnosis of COVID-19 - A systematic
review. Life Sci 2020 Aug 01;254:117788 [FREE Full text] [doi: 10.1016/j.lfs.2020.117788] [Medline: 32475810]
9. Zhou F, Yu T, Du R, Fan G, Liu Y, Liu Z, et al. Clinical course and risk factors for mortality of adult inpatients with
COVID-19 in Wuhan, China: a retrospective cohort study. Lancet 2020 Mar 28;395(10229):1054-1062 [FREE Full text]
[doi: 10.1016/S0140-6736(20)30566-3] [Medline: 32171076]
10. Ruan Q, Yang K, Wang W, Jiang L, Song J. Clinical predictors of mortality due to COVID-19 based on an analysis of data
of 150 patients from Wuhan, China. Intensive Care Med 2020 May;46(5):846-848 [FREE Full text] [doi:
10.1007/s00134-020-05991-x] [Medline: 32125452]
11. Yang J, Zheng Y, Gou X, Pu K, Chen Z, Guo Q, et al. Prevalence of comorbidities and its effects in patients infected with
SARS-CoV-2: a systematic review and meta-analysis. Int J Infect Dis 2020 May;94:91-95 [FREE Full text] [doi:
10.1016/j.ijid.2020.03.017] [Medline: 32173574]
12. Henry BM, de Oliveira MHS, Benoit S, Plebani M, Lippi G. Hematologic, biochemical and immune biomarker abnormalities
associated with severe illness and mortality in coronavirus disease 2019 (COVID-19): a meta-analysis. Clin Chem Lab
Med 2020 Jun 25;58(7):1021-1028. [doi: 10.1515/cclm-2020-0369] [Medline: 32286245]
13. Bellin E. Riddles in Accountable Healthcare: A Primer to Develop Analytic Intuition for Medical Homes and Population
Health. North Charleston, South Carolina: Create Space; Mar 07, 2015.
14. Bellin E. How to Ask and Answer your Research Question using Electronic Medical Record Data. North Charleston, South
Carolina: Create Space; 2017.
15. Bellin E. Missing Management: Health-Care Analytic Discovery in a Learning Health System. Seattle, Washington: Kindle
Direct Publishing; Sep 05, 2019.
16. Bellin E, Fletcher DD, Geberer N, Islam S, Srivastava N. Democratizing information creation from health care data for
quality improvement, research, and education-the Montefiore Medical Center Experience. Acad Med 2010
Aug;85(8):1362-1368. [doi: 10.1097/ACM.0b013e3181df0f3b] [Medline: 20453810]
17. h2oai / h2o-3. GitHub. URL: https://github.com/h2oai/h2o-3 [accessed 2021-02-12]
https://www.jmir.org/2021/2/e23458 J Med Internet Res 2021 | vol. 23 | iss. 2 | e23458 | p. 13
(page number not for citation purposes)
XSL• FO
RenderXJOURNAL OF MEDICAL INTERNET RESEARCH Ikemura et al
18. AutoML: Automatic machine learning. H2O.ai. URL: http://docs.h2o.ai/h2o/latest-stable/h2o-docs/automl.html [accessed
2021-02-12]
19. The R Project for statistical computing. R Foundation. URL: https://www.R-project.org/ [accessed 2021-02-12]
20. Lundberg SM, Erion G, Chen H, DeGrave A, Prutkin JM, Nair B, et al. From local explanations to global understanding
with explainable AI for trees. Nat Mach Intell 2020 Jan;2(1):56-67 [FREE Full text] [doi: 10.1038/s42256-019-0138-9]
[Medline: 32607472]
21. Friedman JH. Greedy function approximation: A gradient boosting machine. Ann Stat 2001;29(5):1189-1232. [doi:
10.1214/aos/1013203451]
22. Molnar C. Interpretable machine learning: A guide for making black box models explainable. GitHub. 2021 Feb 08. URL:
https://christophm.github.io/interpretable-ml-book/ [accessed 2021-02-12]
23. Pei G, Zhang Z, Peng J, Liu L, Zhang C, Yu C, et al. Renal involvement and early prognosis in patients with COVID-19
pneumonia. J Am Soc Nephrol 2020 Jun;31(6):1157-1165. [doi: 10.1681/ASN.2020030276] [Medline: 32345702]
24. Deng Q, Hu B, Zhang Y, Wang H, Zhou X, Hu W, et al. Suspected myocardial injury in patients with COVID-19: Evidence
from front-line clinical observation in Wuhan, China. Int J Cardiol 2020 Jul 15;311:116-121 [FREE Full text] [doi:
10.1016/j.ijcard.2020.03.087] [Medline: 32291207]
25. Thachil J, Tang N, Gando S, Falanga A, Cattaneo M, Levi M, et al. ISTH interim guidance on recognition and management
of coagulopathy in COVID-19. J Thromb Haemost 2020 May;18(5):1023-1026. [doi: 10.1111/jth.14810] [Medline:
32338827]
26. Zhang Y, Xiao M, Zhang S, Xia P, Cao W, Jiang W, et al. Coagulopathy and antiphospholipid antibodies in patients with
covid-19. N Engl J Med 2020 Apr 23;382(17):e38 [FREE Full text] [doi: 10.1056/NEJMc2007575] [Medline: 32268022]
27. Wang S, Ma P, Zhang S, Song S, Wang Z, Ma Y, et al. Fasting blood glucose at admission is an independent predictor for
28-day mortality in patients with COVID-19 without previous diagnosis of diabetes: a multi-centre retrospective study.
Diabetologia 2020 Oct;63(10):2102-2111 [FREE Full text] [doi: 10.1007/s00125-020-05209-1] [Medline: 32647915]
28. Golestaneh L, Neugarten J, Fisher M, Billett HH, Gil MR, Johns T, et al. The association of race and COVID-19 mortality.
EClinicalMedicine 2020 Aug;25:100455 [FREE Full text] [doi: 10.1016/j.eclinm.2020.100455] [Medline: 32838233]
29. Billett HH, Reyes-Gil M, Szymanski J, Ikemura K, Stahl LR, Lo Y, et al. Anticoagulation in COVID-19: Effect of enoxaparin,
heparin, and apixaban on mortality. Thromb Haemost 2020 Dec;120(12):1691-1699. [doi: 10.1055/s-0040-1720978]
[Medline: 33186991]
Abbreviations
AUC: area under the curve
AUPRC: area under the precision-recall curve
autoML: automated machine learning
BUN: blood urea nitrogen
CLG: Clinical Looking Glass
DL: deep learning
GLM: general linear model
GBM: gradient boosting machine
LDH: lactate dehydrogenase
NPV: negative predictive value
PD: partial dependence
PPV: positive predictive value
RF: random forest
SHAP: Shapley additive explanation
XGBoost: extreme gradient boosting
Edited by C Basch; submitted 17.08.20; peer-reviewed by S Nagavally, A James, A Kardos; comments to author 02.12.20; revised
version received 23.12.20; accepted 03.02.21; published 26.02.21
Please cite as:
Ikemura K, Bellin E, Yagi Y, Billett H, Saada M, Simone K, Stahl L, Szymanski J, Goldstein DY, Reyes Gil M
Using Automated Machine Learning to Predict the Mortality of Patients With COVID-19: Prediction Model Development Study
J Med Internet Res 2021;23(2):e23458
URL: https://www.jmir.org/2021/2/e23458
doi: 10.2196/23458
PMID: 33539308
https://www.jmir.org/2021/2/e23458 J Med Internet Res 2021 | vol. 23 | iss. 2 | e23458 | p. 14
(page number not for citation purposes)
XSL• FO
RenderXJOURNAL OF MEDICAL INTERNET RESEARCH Ikemura et al
©Kenji Ikemura, Eran Bellin, Yukako Yagi, Henny Billett, Mahmoud Saada, Katelyn Simone, Lindsay Stahl, James Szymanski,
D Y Goldstein, Morayma Reyes Gil. Originally published in the Journal of Medical Internet Research (http://www.jmir.org),
26.02.2021. This is an open-access article distributed under the terms of the Creative Commons Attribution License
(https://creativecommons.org/licenses/by/4.0/), which permits unrestricted use, distribution, and reproduction in any medium,
provided the original work, first published in the Journal of Medical Internet Research, is properly cited. The complete bibliographic
information, a link to the original publication on http://www.jmir.org/, as well as this copyright and license information must be
included.
https://www.jmir.org/2021/2/e23458 J Med Internet Res 2021 | vol. 23 | iss. 2 | e23458 | p. 15
(page number not for citation purposes)
XSL• FO
RenderXYou can also read


