Impact of the COVID-19 Outbreak on Air Quality in Korea - MDPI
←
→
Page content transcription
If your browser does not render page correctly, please read the page content below
atmosphere
Article
Impact of the COVID-19 Outbreak on Air Quality
in Korea
Ji Hoon Seo 1,2 , Hyun Woo Jeon 3 , Ui Jae Sung 1 and Jong-Ryeul Sohn 1,2,3, *
 1   Department of Health & Environmental Science, Korea University, Seoul 02841, Korea;
     wlgns304@korea.ac.kr (J.H.S.); suj0510@korea.ac.kr (U.J.S.)
 2   BK21PLUS Program in Embodiment: Health-Society Interaction, Department of Public Health Sciences,
     Graduate School, Korea University, Seoul 02841, Korea
 3   Department of Health and Safety Convergence Science, Korea University, Seoul 02841, Korea;
     2012250541@korea.ac.kr
 *   Correspondence: sohn1956@korea.ac.kr

 Received: 23 September 2020; Accepted: 19 October 2020; Published: 21 October 2020

 Abstract: The COVID-19 pandemic has led countries to take action, which has included practicing
 social distancing or lockdown. Many cities are experiencing air quality improvements due to human
 activity restrictions. The purpose of this study was to compare the air quality between 2020 and the
 previous three years, focusing on the two cities (Seoul and Daegu) where coronavirus is spreading
 the fastest in Korea. Significant decreases in PM2.5 , PM10 , CO, and NO2 were observed in both cities.
 In particular, compared to the same period of 2017-2019, in March 2020, PM2.5 showed remarkable
 reductions of 36% and 30% in Seoul and Daegu, respectively. The effects of social distancing have
 maximized improvements in air quality due to reduced transboundary pollutants. The PM2.5 /PM10
 ratio was significantly reduced after social distancing, indicating that the contribution of traffic-related
 PM2.5 declined. Air quality improved overall from January to July, and the most noticeable drop in
 the air quality index (AQI) was observed in April. These findings indicate that relatively weak social
 distancing measures compared to a COVID-19 lockdown can help reduce air pollutant levels. At the
 same time, however, changes in air quality in the neighboring countries caused by COVID-19 control
 action are affecting Korea.

 Keywords: COVID-19; air quality; social distancing; particulate matter; PM2.5

1. Introduction
      The novel coronavirus (COVID-19), which was first reported in Wuhan on December 31, 2019,
is spreading rapidly around the world and was declared a pandemic by the World Health Organization
(WHO) in March 2020 [1]. In Korea, the first confirmed COVID-19 case was reported on January
20, 2020, and the number of confirmed COVID-19 cases began to explode around Seoul and Daegu,
reaching 19,947 cases by 31 August 2020.
      In countries where COVID-19 is spreading, national decisions are being made that range from
social distancing to nationwide lockdowns to stop the spread of the infection [2]. As a result, human
activities have become limited, causing traffic, industrial, and domestic emissions, which contribute to
air pollution [3–5], to decrease. In many studies, changes in air quality across the world due to COVID-19
lockdown have been observed. In particular, significant reductions in atmospheric fine particulates
(PM2.5 ), respirable suspended particulates (PM10 ), nitrogen dioxide (NO2 ), carbon monoxide (CO),
and sulfur dioxide (SO2 ) concentrations in 2020 (compared to the last three years) were observed in
central China [6] where novel coronavirus first broke out. Likewise, positive effects on air quality have
also been reported in the United States [7,8], Italy [9,10], India [3,11,12], and Brazil [2,13,14], which are
also experiencing COVID-19 infections.

Atmosphere 2020, 11, 1137; doi:10.3390/atmos11101137                         www.mdpi.com/journal/atmosphere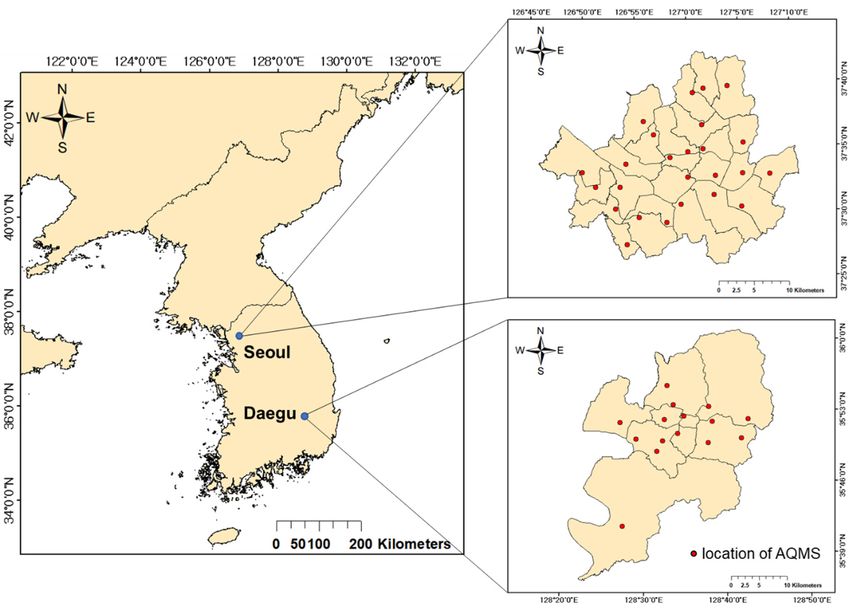
Atmosphere 2020, 11, 1137                                                                            2 of 15

     Air quality deterioration has a serious effect on human health and contributes to 5 million deaths
worldwide every year. It is the fifth highest health-related factor causing disease in humans. Especially
in Southeast Asia, up to 15% of the deaths were due to air pollution [15]. Air pollution in Korea
has been highlighted as an environmental issue, causing 14,700 deaths in 2000 and 17,300 deaths in
2017 [16].
     COVID-19 is causing a great deal of disease burden and worldwide economic deterioration [17],
but it has enabled us to assess the air quality changes [18] induced by reduced industry and human
activities. In previous studies, although social distancing is a weaker measure than COVID-19 lockdown,
a significant improvement in air quality has been observed [19], immediately after the announcement
of social distancing guidelines. In addition, In Sao Paulo, Brazil, which adopted social distancing
similar to Korea, PM2.5 , PM10 , and NO2 decreased by 46%, 45%, and 58%, respectively, due to limited
human activity [3].
     Previous studies have observed changes in the national average air pollution level [20] but have not
analyzed the impact of social distancing centered on metropolitan cities, which have an overwhelming
number of COVID-19 cases. In addition, partial decrease in concentrations of air pollutants was
observed, but there is no long-term analysis of the air quality index (AQI) that can represent air quality.
     Korea experienced SARS-CoV (severe acute respiratory syndrome) in 2003 and the Middle East
respiratory syndrome (MERS-CoV) in 2015, with MERS-CoV in particular, recording the second-highest
number of confirmed cases in the world after Saudi Arabia. However, no studies have been conducted
to assess air quality in the wake of past human coronavirus (HCoV) outbreaks.
     In this study, six typical air pollutants were observed in a time series, and the AQI was analyzed
to observe changes in air quality caused by coronavirus diffusion and social distancing. In particular,
we focused on the two representative cities (Seoul and Daegu) with the largest number of COVID-19
infections, and evaluated (1) the annual difference in air pollution before and after COVID-19 and
MERS-CoV (compared to the past three years), (2) the trend in the PM2.5 /PM10 ratio changes according
to the level of social distancing, and (3) AQI changes and its major contributing pollutants after
COVID-19 control actions.

2. Methods

2.1. Site Description
     Seoul (37◦ 330 N, 126◦ 580 E) and Daegu (35◦ 480 N, 128◦ 330 E), the two cities with the highest
number of COVID-19 cases in Korea, were selected as study areas (Figure 1). Seoul, which has
the top population density among the capitals of the Organization for Economic Co-operation and
Development (OECD) countries [21], has experienced a steady outbreak of mass infections regardless
of social distancing practices. Daegu, the third largest and fourth most populous city, saw a surge in
the number of confirmed cases in the early stages of the COVID-19 outbreak, which led to strict social
distancing guidelines, but it still had the highest number of confirmed cases (35.3%) in South Korea by
August 2020.

2.2. COVID-19 Data
     The daily identification of confirmed COVID-19 cases in Korea was provided by the Ministry of
Health and Welfare of South Korea (MOHW) [22] and subdivided into Seoul and Daegu areas. Changes in
the level of social distancing guidelines were announced by the MOHW. The recommendations of
the South Korean government’s social distancing step-by-step guidelines to prevent the spread of
COVID-19 are presented in Table 1. South Korea has shifted from a social distancing campaign to
a more relaxed way, known as “distancing in daily life”, after new coronavirus cases dropped to
single digits (March 6). These new quarantine protocols helped the public stay safe at home, work,
and during outdoor activities now that gatherings and events are allowed.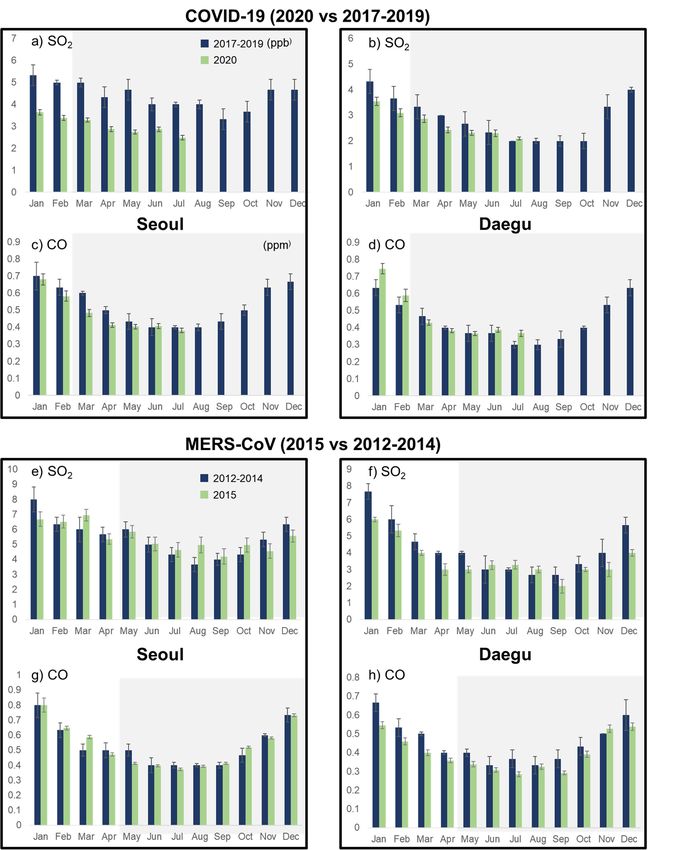
Atmosphere 2020, 11, 1137                                                                                        3 of 15
Atmosphere 2020, 11, x FOR PEER REVIEW                                                                           3 of 17

     Figure 1.1.Location
     Figure      Locationof of
                            Seoul andand
                               Seoul  Daegu in Korea.
                                          Daegu       Red dots
                                                 in Korea.  Redpresent
                                                                 dots the location
                                                                       present  theoflocation
                                                                                       air quality
                                                                                                of monitoring
                                                                                                   air quality
     stations (AQMS).   This  map  was produced by using ArcMap   10.6 of ArcGIS  software.
     monitoring stations (AQMS). This map was produced by using ArcMap 10.6 of ArcGIS software.
               Table 1. Guidelines on social distancing issued by the Government of South Korea.
2.2. COVID-19 Data
                                                          Level of Social Distancing
     TheCategory
          daily identification of confirmed COVID-19 cases in Korea was provided by the Ministry of
                                    Level 1                        Level 2                         Level 3
Health and Welfare of South Korea (MOHW) [22] and subdivided into Seoul and Daegu areas.
                                           Wash your hands carefully for more than 30 s with soap,
Changes
    Personalinhygiene
                 the level of social distancing      guidelines were announced by the MOHW. The
                                                Maintain at least 1~2 m distance with others
recommendations of the South Korean government's social distancing step-by-step guidelines to
                                                           All private and public
prevent the spread of COVID-19         are presented    inindoor
                                                            Tablemeetings
                                                                    1. South    Korea  All private
                                                                                       has         andfrom
                                                                                             shifted   publicaindoor
                                                                                                                social
                           Allowed, recommended   to                        of 50 or
 Gatherings, events, etc.                                                                and outdoor meetings of
distancing campaign respect
                          to a more     relaxed
                                the sanitary     way, more
                                             measures    known      as "distancing
                                                               and outdoor  meetings in daily life", after new
                                                                                            over 10 are banned
coronavirus cases dropped to single digits (Marchof6).over         100 are banned
                                                                These   new quarantine protocols helped the
publicSport
        stayevents            Limitedand
               safe at home, work,    the number
                                           during outdoor activities      now that gatheringsBanned and events are
                                                                No spectators
                                 of spectators
allowed.
                            Allowed (if necessary, they
     Public facilities                                            Suspended                     Suspended
                                can be suspended)
                                                           All high-risk places are       All high-risk places are
                          Allowed (high-risk places can
    Private facilities                                       closed, and sanitary          closed, and sanitary
                                be suspended)
                                                           measures are reinforced.       measures are reinforced.
                                                          Open and distance learning
                                                                                             Distance learning
 Schools, kindergartens    Open and distance learning         (limit the numbers
                                                                                              or suspended
                                                                  of students)
                          Teleworking is recommended             Teleworking is
   Public institutions                                                                   Teleworking is obligated
                                (one-third of all            recommended (half of
    and companies                                                                        except essential members
                                the employees)                   all employees)
   Private institutions                                         Teleworking is           Teleworking is obligated
                               Flexible teleworking
     and companies                                              recommended              except essential members

2.3. Air Quality Data
   The Korean Ministry of Environment (KMOE) has reported the air quality levels in about 16
administrative districts (currently 17) since 2002 and has released data to the public since 2005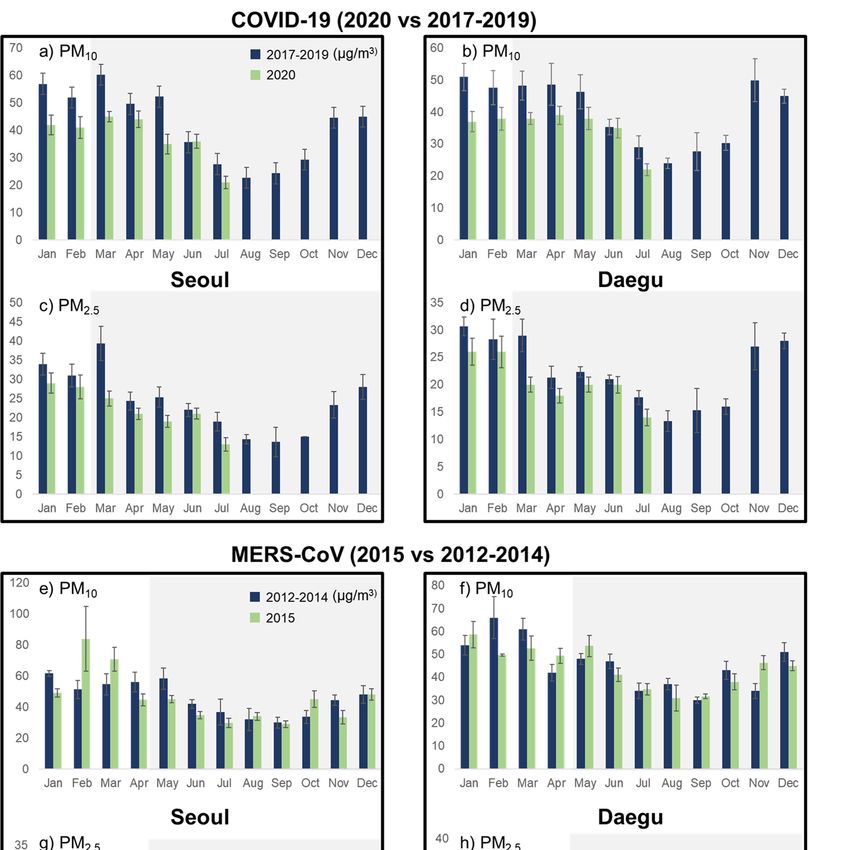
Atmosphere 2020, 11, 1137                                                                               4 of 15

(www.airkorea.or.kr/web). In Seoul and Daegu, where the study targets are located, 25 and 15 air
monitoring networks, respectively, are operated (see Figure 1) and provide daily and hourly data
for PM2.5 , PM10 , SO2 , CO, NO2 , and O3 . Air pollution data were collected from January 2012 to July
2020 for comparison with the previous three years of each pandemic outbreak, including 2020 when
COVID-19 occurred and 2015 when MERS-CoV occurred in Korea (PM2.5 has been monitored since
2015). In addition, meteorological conditions are presented in Table S1.
     The air quality index (AQI) explains air quality in a quantitative way to make it easier for the
public to understand and to protect them from air pollution [23], initially implemented in 1999 by the
US Environmental Protection Agency (USEPA). The individual indexes of the six criteria pollutants are
calculated by Equation (1), and the maximum value is determined as the AQI. The AQI is divided
into six color-coded categories (green–maroon), and each color is identified by a simple informative
descriptor. Higher AQI values mean greater concern for people’s health.
                                        IHi − ILo
                                  Ip =                 Cp − BPLo + ILo                              (1)
                                       BPHi − BPLo

where

Ip = the index for pollutant p;
Cp = the truncated concentration of pollutant p;
BPHi = the concentration breakpoint that is greater than or equal to Cp ;
BPLo = the concentration breakpoint that is less than or equal to Cp ;
IHi = the AQI value corresponding to BPHi ;
ILo = the AQI value corresponding to BPLo .

2.4. Data Analysis
      Statistical analyses were performed using SPSS. A p-value of less than 0.05 was considered
statistically significant. In this study, 24 h averages were used for PM2.5 , PM10 , SO2 , CO, and NO2 ,
and 8 h averages were used for O3 . The means and standard deviation (SD) were calculated to describe
the level of each pollutant. The air quality and meteorological conditions in 2020 and previous years
were compared using paired t-tests and Mann–Whitney U tests between the same dates.

3. Results and Discussion

3.1. COVID-19 Outbreak and Social Distancing in Korea
      Figure 2 shows the trend in COVID-19 diffusion and changes in the social distancing levels
in Seoul and Daegu, South Korea. In Daegu, the confirmed cases began to surge on February 18.
By February 29, there were 2236 cases (71% of the confirmed Korean cases); on March 31, there were
6684 cases (68%); and on August 31, 2020, there were 7047 cases (35%). The number of confirmed cases
increased consistently in Seoul, but was relatively slow compared to Daegu at the early stage of the
epidemic, where the spread by cluster infections increased in August. On February 29, there were
77 cases (2%); on March 31, there were 450 cases (4%); and on August 31, there were 3867 cases (19%).
It is noteworthy that the spread of COVID-19 in South Korea surged first in February and entered the
second phase of a surging trend most recently in August.
      After the first confirmed case of COVID-19 occurred on 20 January 2020, the Korean government
set its infectious disease alert level to yellow. It raised its alert to red after the number of COVID-19 cases
surged, especially around Daegu (February 23). As a result, since the end of February, social distancing
has been in effect among the citizens. To prevent cluster infections, the social distancing level was
tightened and applied until April 19. COVID-19 cases significantly reduced during active participation
in social distancing measures. As the number of newly confirmed cases and unclear infection routes
has decreased, the guidelines have shifted from social distancing to distancing in daily life.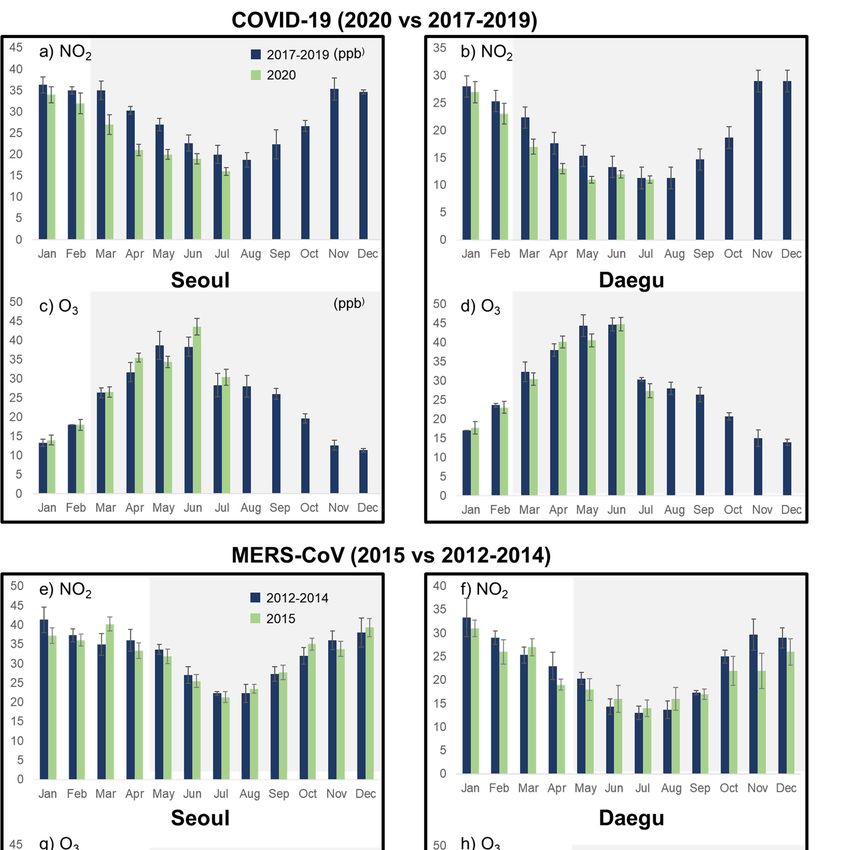
6684 cases (68%); and on August 31, 2020, there were 7047 cases (35%). The number of confirmed
 cases increased consistently in Seoul, but was relatively slow compared to Daegu at the early stage
 of the epidemic, where the spread by cluster infections increased in August. On February 29, there
 were 77 cases (2%); on March 31, there were 450 cases (4%); and on August 31, there were 3867 cases
 (19%). It is noteworthy that the spread of COVID-19 in South Korea surged first in February
Atmosphere 2020, 11, 1137
                                                                                                 and
                                                                                              5 of 15
 entered the second phase of a surging trend most recently in August.

     Figure 2. Daily new confirmed cases and changes in social distancing (SD) level. The blue line
     represents
      Figure 2. the whole
                 Daily newcountry, the yellow
                            confirmed         line represents
                                        cases and   changes inSeoul,
                                                                socialand  the red line
                                                                        distancing      represents
                                                                                     (SD)          Daegu.
                                                                                          level. The blue line
       represents the whole country, the yellow line represents Seoul, and the red line represents Daegu.
      In a field test study in a hospital, all air samples were confirmed negative at 2 m or more from the
bed used
       Afterbythea patient  with COVID-19
                   first confirmed               [24]. Therefore,
                                      case of COVID-19              it seems
                                                             occurred   on 20 that  social
                                                                               January      distancing
                                                                                         2020,          wasgovernment
                                                                                               the Korean     helpful in
suppressing     the spread
 set its infectious          of alert
                       disease  the virus
                                      levelin toKorea.
                                                 yellow. It raised its alert to red after the number of COVID-19
 cases surged, especially around Daeguinfection
      However,     as  the number     of cluster    (February cases
                                                                23). centered   in Seoul
                                                                      As a result,  since increased
                                                                                           the end ofagain   in August,
                                                                                                       February,    social
social  distancing
 distancing           was in
                has been   upgraded     to level
                              effect among      the2 citizens.
                                                     on August To16  and further
                                                                   prevent   clusterstrengthened   to level
                                                                                      infections, the social2.5  around
                                                                                                               distancing
the metropolitan
 level  was tightened areaand
                           on August
                                applied30    (Figure
                                          until   April2).19. COVID-19 cases significantly reduced during active
      Meanwhile,      Korea   has  already     experienced
 participation in social distancing measures. As the           MERS-CoV.
                                                                  number of   The  first confirmed
                                                                                newly    confirmed cases
                                                                                                     MERS-CoV       case
                                                                                                            and unclear
occurred
 infectionon    20 May
              routes  has2015,  resulting
                           decreased,    thein guidelines
                                                a total of 186 confirmed
                                                             have  shifted cases
                                                                            from and    38 distancing
                                                                                   social  deaths, withtoadistancing
                                                                                                           fatality ratein
ofdaily
   20.4%   (Figure
        life.        S1).  While  COVID-19       has  accounted   for  most  of the  community-acquired       infections,
MERS-CoVs infections occurred mostly in hospitals (172/186). Due to the lack of confirmed cases,
there was no need for social distancing, and the outbreak was officially declared to end in Korea on
24 December 2015.

3.2. Comparison of Air Pollutants

3.2.1. Concentrations of PM2.5 and PM10
     Figure 3 represents the change in the concentrations of atmospheric PM in COVID-19 and
MERS-CoV in the current year compared to the previous three years. Since March, when social
distancing due to COVID-19 began, PM2.5 and PM10 have seen significant declines in both Seoul and
Daegu compared to the previous three years (excluding June). The average concentration of PM10 in
Seoul in March was significantly reduced from 60.3 µg/m3 over the previous three years to 45.0 µg/m3
in 2020 (Figure 3a). In Daegu, it was significantly reduced from 48.3 µg/m3 to 38.4 µg/m3 (Figure 3b),
showing 25.4% and 21.4% rate reductions in Seoul and Daegu, respectively.
     Compared to the past three years, the mean PM2.5 concentrations in March 2020 decreased by
14.2 µg/m3 and 8.49 µg/m3 in Seoul and Daegu (Figure 3c,d), respectively. In both cities, the reduction
rates were 36% and 31%, respectively, more dramatic than the decrease in PM10 . In the springtime
(February 29 to April 19) when yellow dust is severe, the PM10 and PM2.5 concentrations in 2020 during
the social distancing period did not exceed the daily National Ambient Air Quality Standard (NAAQS)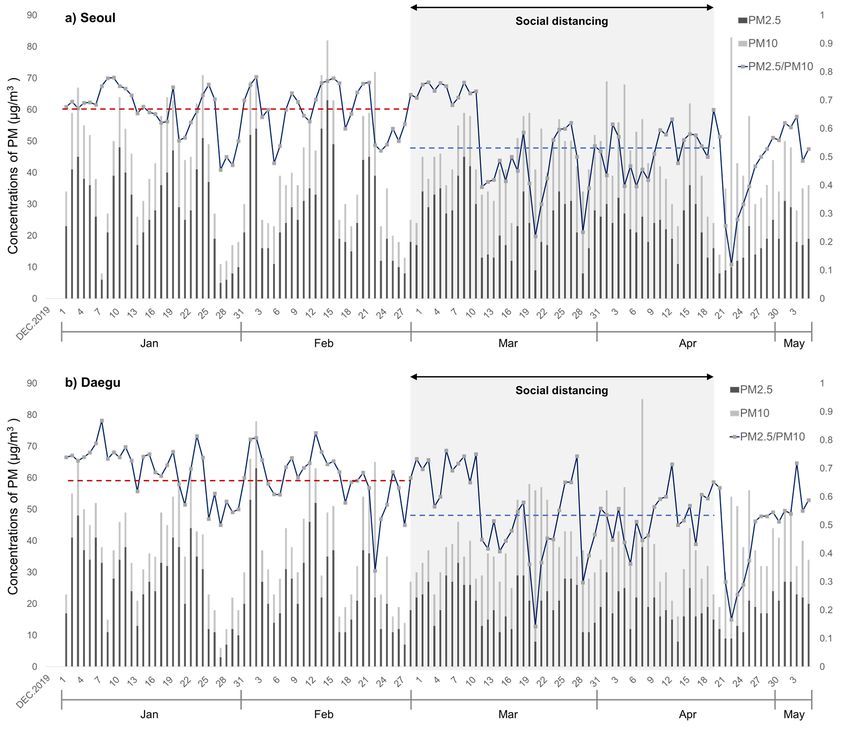
Atmosphere 2020, 11, x FOR PEER REVIEW                                                                       7 of 17

       During
Atmosphere       the1137
           2020, 11, lockdown    period, in eastern China, contiguous to Korea, a reduction in PM2.5 of648% of 15
  was also observed [27]. Therefore, the decrease in PM across China due to the COVID-19 lockdown
  has probably affected the air quality in South Korea since January and, along with a sharp decline in
(PM 10 , 100
  human      µg/m3 ; due
           activities PM2.5
                          to, social
                              35 µg/m   3 ), compared to 8 and 38 times when the PM and PM
                                      distancing  practices since March, has led to a dramatic
                                                                                       10        2.5 standards,
                                                                                               decrease  in PM
respectively,  were
  concentrations.     exceeded   in  the  past three years [20].

       Figure3.3.Comparison
                  Comparison ofof PM
                                  PM2.5 (μg/m3) 3and PM10 (μg/m3) before
                                                                    3     and after coronavirus outbreak. (a,c)
     Figure                           2.5 (µg/m ) and PM10 (µg/m ) before and after coronavirus outbreak.
       Changes   in concentrations of particulate matter before and after COVID-19
     (a,c) Changes in concentrations of particulate matter before and after COVID-19 in Seoul. (b,d)
                                                                                        in Seoul.    Changes
                                                                                                  (b,d)       in
                                                                                                        Changes
       concentrations  of particulate matter before and after COVID-19   in Daegu. (e,g) Changes  in particulate
     in concentrations of particulate matter before and after COVID-19 in Daegu. (e,g) Changes in particulate
     matter before and after MERS-CoV in Seoul. (f,h) Changes in particulate matter before and after
     MERS-CoV in Daegu. (PM2.5 has been monitored since 2015.)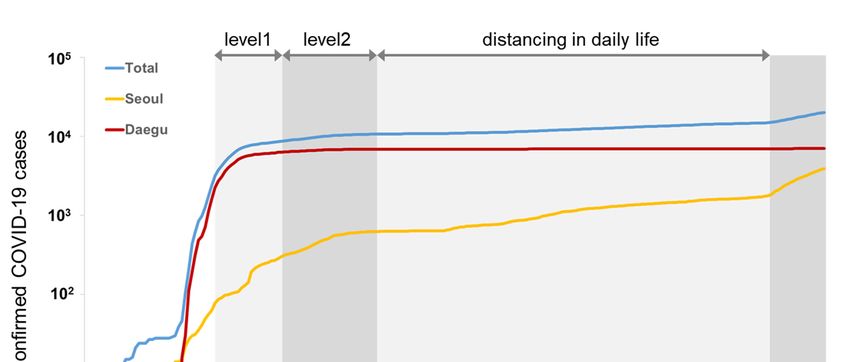
Atmosphere 2020, 11, 1137                                                                            7 of 15

      In contrast, the comparison of the PM concentrations before and after the occurrence of MERS-CoV
showed no significant results, although the concentrations slightly decreased in Seoul (Figure 3e).
Since the end of May, right after the outbreak of MERS-CoV, there has been a campaign to manage
the personal hygiene of citizens around metropolitan areas, but there have been no social distancing
policies, and only one confirmed case occurred in Daegu. At that time, there were no government
guidelines related to social distancing because most MERS-CoV confirmed cases occurred within
hospitals, and there were no identified cluster infections. Therefore, no changes in the PM10 and
PM2.5 concentrations were observed due to MERS-CoV. Moreover, there were 186 confirmed cases,
significantly less than with COVID-19, with a relatively weak impact than COVID-19 pandemic.
      Interestingly, South Korea had already experienced a decline in PM10 and PM2.5 since January,
before social distancing took place. The anthropogenic emissions from neighboring countries negatively
affect the Korean Peninsula, and about 67% of the PM10 is due to transboundary particles [25].
In particular, China’s impact on the PM in South Korea averages 30 to 50%, with its contribution rising
to 80% on the most polluted days according to a report by KMOE [26].
      In Wuhan, China, where the novel coronavirus was first reported, air quality improvements
including PM2.5 , PM10 , NO2 , SO2 , and CO have been reported from January 2020. In the case of PM2.5 ,
it decreased by 36.2% and 44.0% in January and February, respectively (compared to the average
concentrations of the previous three years) [6]. The reduction rate of PM2.5 was similar or slightly
higher than that observed in our study, confirming that the strict COVID-19 control had a significant
impact on air quality.
      During the lockdown period, in eastern China, contiguous to Korea, a reduction in PM2.5 of 48%
was also observed [27]. Therefore, the decrease in PM across China due to the COVID-19 lockdown
has probably affected the air quality in South Korea since January and, along with a sharp decline
in human activities due to social distancing practices since March, has led to a dramatic decrease in
PM concentrations.
      To further investigate these effects, we analyzed the PM2.5 /PM10 ratio before and after social
distancing, as shown in Figure 4. Because the emission source varies depending upon the size of
PM, the PM2.5 /PM10 ratio can be used to identify the source [28]. A higher ratio means that PM2.5
anthropogenic activities contributed more, and a lower ratio suggests the contribution of many coarse
particles from natural sources such as sand dust or wildfires [29].
      The PM2.5 /PM10 ratios decreased from 0.66 to 0.54 and from 0.68 to 0.54 in Seoul and Daegu
(Figure 4a,b), respectively, shortly after the implementation of social distancing. Even if the PM2.5 /PM10
ratio is affected by spatio-temporal variables, this significant reduction in the ratio can be explained
by a decrease in anthropogenic emissions after social distancing. After social distancing, the average
traffic volume decreased by more than 30% in the first week of March, mainly in the metropolitan
area. In particular, from the end of February when the number of confirmed cases exploded in Daegu,
the total traffic volume including public transportation decreased by up to 69% [30].
      What is important is that changes in the PM2.5 /PM10 ratio have been observed since around
March 11, 12 days after the implementation of social distancing (February 29). These sudden changes
are probably due to the influence of meteorological conditions including wind and temperature [10].
We observed that the temperature around March 11 was 2.7 ◦ C higher than the weekly average, and the
wind speed was 0.7 m/s stronger, accelerating the atmospheric dispersion. Similarly, the lowest levels
of PM2.5 around March 20, March 28, and April 23 were analyzed because of the higher temperature
and wind speed than the weekly average.
      In addition, we observed that the PM2.5 /PM10 ratio began to increase after social distancing was
relaxed. Therefore, we confirmed the delayed effects of human activity on the distribution of particulate
matter during the period when the atmosphere was stagnant [31].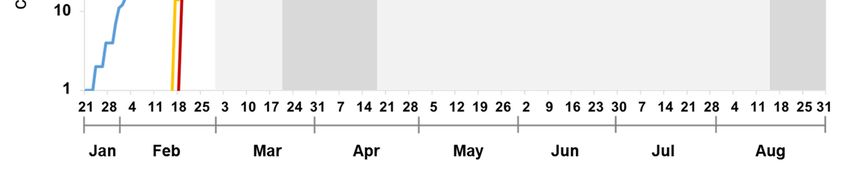
Atmosphere 2020, 11, 1137                                                                                    8 of 15

  Atmosphere 2020, 11, x FOR PEER REVIEW                                                                     9 of 17

      Figure 4. Changes of PM2.5 /PM10 ratio after social distancing (a: Seoul, b: Daegu). Highlighted shadow
        Figure 4. Changes of PM2.5/PM10 ratio after social distancing (a: Seoul, b: Daegu). Highlighted shadow
      represents the period of social distancing.
        represents the period of social distancing.
3.2.2. Concentrations of Gaseous Pollutants
  3.2.2. Concentrations of Gaseous Pollutants
      Changes in SO2 and CO concentrations before and after the coronavirus outbreak are shown
       Changes in SO2 and CO concentrations before and after the coronavirus outbreak are shown in
in Figure 5. A significant decrease in the concentration of SO2 since COVID-19 was observed for all
  Figure 5. A significant decrease in the concentration of SO2 since COVID-19 was observed for all
periods in Seoul (March to July), with slight differences in Daegu (Figure 5a,b). However, Seoul does
  periods in Seoul (March to July), with slight differences in Daegu (Figure 5a,b). However, Seoul does
not have significant emission sources such as from industrial activities [19,20], so there is little evidence
  not have significant emission sources such as from industrial activities [19,20], so there is little
that the change in SO2 concentration was caused by social distancing. South Korea strictly regulates
  evidence that the change in SO2 concentration was caused by social distancing. South Korea strictly
SO2 emissions under the Chemicals Control Act, which has led to a continuous slight decrease in the
  regulates SO2 emissions under the Chemicals Control Act, which has led to a continuous slight
concentration every year (Figure S2).
  decrease in the concentration every year (Figure S2).
      Previous studies observed a dramatic decrease in SO2 due to China’s COVID-19 lockdown [6]
       Previous studies observed a dramatic decrease in SO2 due to China's COVID-19 lockdown [6]
and an SO2 movement from China to Korea through the Yellow Sea based on backward trajectory
  and an SO2 movement from China to Korea through the Yellow Sea based on backward trajectory
analysis [32]. In addition, the concentration of SO2 in Korea is affected by about 20–40% of the SO2
  analysis [32]. In addition, the concentration of SO2 in Korea is affected by about 20–40% of the SO2
generated in China [27]. In Korea, social distancing, a weaker measure than lockdown, was adopted,
  generated in China [27]. In Korea, social distancing, a weaker measure than lockdown, was adopted,
and there were no restrictions on industrial activities significantly related to SO2 emission. For this
  and there were no restrictions on industrial activities significantly related to SO2 emission. For this
reason,  we estimated that reductions in trans-boundary SO and regulation of SOx emissions had a
  reason, we estimated that reductions in trans-boundary SO22 and regulation of SOx emissions had a
greater
  greatereffect ononthe
           effect     thechanges
                          changesininSO
                                      SO2 2than
                                            thansocial
                                                 socialdistancing,
                                                        distancing,consistent
                                                                       consistent with
                                                                                  with previous
                                                                                        previous findings
                                                                                                  findings [19,20].
                                                                                                            [19,20].
      The  concentration    of CO    was   reduced  in   Seoul   in  March  and   April
       The concentration of CO was reduced in Seoul in March and April and in Daegu in   and  in Daegu    in March
                                                                                                              March
(Figure
  (Figure5c,d).
           5c,d).AAprevious
                      previousstudy
                               studyalso
                                       alsoshowed
                                             showedresults
                                                       results consistent
                                                                consistent with
                                                                            with our
                                                                                  our study,
                                                                                       study, but
                                                                                              but the
                                                                                                   the observation
                                                                                                       observation
period   was  short,  from  February   to  March,  and   there  was   no year-by-year    analysis
  period was short, from February to March, and there was no year-by-year analysis [19]. We       [19].  We believe
                                                                                                             believe
that the  short-term    decline in  CO   level  was  due   to the   decrease  in traffic-related CO
  that the short-term decline in CO level was due to the decrease in traffic-related CO emissions in  emissions   in
Seoul
  Seouland
         andDaegu.
              Daegu. However,
                        However, this   change was
                                   this change    wasvery
                                                        veryshort-lived,
                                                              short-lived,andandthe
                                                                                  the  atmospheric
                                                                                    atmospheric    COCO    returned
                                                                                                        returned  to
  its annual average level due to the effect of traffic increases after mitigation by social distancing. After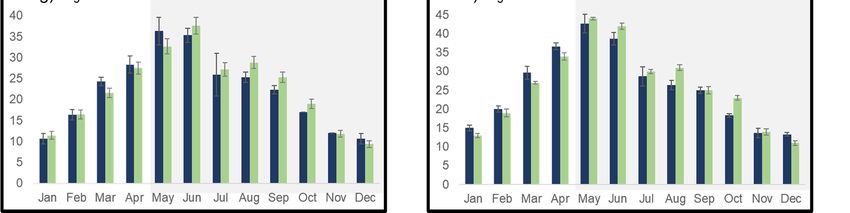
Atmosphere 2020, 11, 1137                                                                                            9 of 15

to its annual average level due to the effect of traffic increases after mitigation by social distancing.
After alleviating social distancing, the use of public transportation decreased due to concerns about
COVID-19 infection, but the total traffic volume recovered to 97.5% of the average level as the use of
  Atmosphere 2020, 11, x FOR PEER REVIEW                                                             11 of 17
private cars increased [33].

      Figure
         Figure5. Comparison
                   5. Comparison of SO
                                     of2 (ppb)  and CO
                                          SO2 (ppb)  and(ppm)
                                                           CO before
                                                                (ppm)and  afterand
                                                                       before   coronavirus  outbreaks. outbreaks.
                                                                                    after coronavirus   (a,c) Changes
                                                                                                                    (a,c)
      in Changes
         SO2 and CO       level before  and  after COVID-19    in Seoul. (b,d) Changes   in
                     in SO2 and CO level before and after COVID-19 in Seoul. (b,d) Changes  SO 2 andin SO2level
                                                                                                      CO   and before
                                                                                                                CO level
      and   after and
         before   COVID-19     in Daegu. in
                       after COVID-19      (e,g) Changes
                                             Daegu.  (e,g)inChanges
                                                             SO2 andinCO
                                                                       SOlevel
                                                                           2 andbefore andbefore
                                                                                 CO level   after MERS-CoV    in Seoul.
                                                                                                   and after MERS-CoV
      (f,h) Changes     in SO   and  CO   level before and  after MERS-CoV    in Daegu.
         in Seoul. (f,h) Changes in SO2 and CO level before and after MERS-CoV in Daegu.
                              2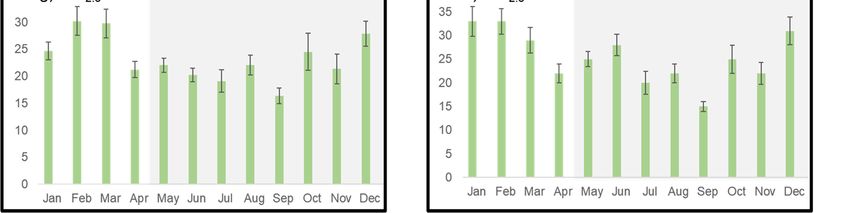
Atmosphere 2020, 11, 1137                                                                                10 of 15

     After social distancing, the year-by-year NO2 concentration decreased significantly from March
to May in Seoul and Daegu (Figure 6a,b). The largest decline occurred in Seoul (April), decreased by
9.3 ppb. As described earlier, the NO2 concentrations in June and July, when social distancing was eased
   Atmosphere 2020, 11, x FOR PEER REVIEW                                                            12 of 17
and traffic-related human activities were restored, were not different from the previous three years.

      Figure  6. Comparison
         Figure              of NO
                  6. Comparison   of2 (ppb) and O3and
                                      NO2 (ppb)    (ppb)
                                                      O3before
                                                         (ppb)and afterand
                                                               before  coronavirus outbreaks. (a,c)
                                                                           after coronavirus        Changes
                                                                                              outbreaks. (a,c)
      in NO2 and O3 level before and after COVID-19 in Seoul. (b,d) Changes in NO2 and O3 level before
         Changes in NO2 and O3 level before and after COVID-19 in Seoul. (b,d) Changes in NO2 and O3 level
      and after COVID-19 in Daegu. (e,g) Changes in NO2 and O3 level before and after MERS-CoV in Seoul.
         before and after COVID-19 in Daegu. (e,g) Changes in NO2 and O3 level before and after MERS-CoV
      (f,h) Changes in NO2 and O3 level before and after MERS-CoV in Daegu.
         in Seoul. (f,h) Changes in NO2 and O3 level before and after MERS-CoV in Daegu.

   3.3. Changes in Air Quality from Social Distancing
       The average monthly AQI in 2020 and over the three previous years was analyzed to assess the
   impact of COVID-19 events on changes in air quality (Figure 7). In general, South Korea experiences
Atmosphere 2020, 11, 1137 11 of 15
Many scholarly works have reported significant increases in O3 levels [34–37] since worldwide
restrictions such as social distancing and the COVID-lockdown were implemented. This is because
lower levels of NO2 inhibit the dissociation to NO and O (3 P), reducing the possibility of NO reacting
with O3 , resulting in an increase in O3 concentrations.
However, in this study, the trends of NO2 and O3 concentrations were changed reversely,
but significant year-by-year changes in O3 concentrations were not observed (Figure 6c,d), consistent
with a previous study in Korea [20]. In addition, the increase in O3 from spring to summer only reflects
the trends in annual atmospheric changes in Korea.
Meanwhile, no significant changes in the year-by-year concentrations of gaseous pollutants were
observed in the two cities (Figure 5e–h, Figure 6e–h) because there was no marked change in human
activity, including the operation of industrial facilities or traffic volume, since the MERS-CoV outbreak.
We observed a significant improvement in particulate matter and a partial reduction in gaseous
pollutants after social distancing. However, changes in the air quality of neighboring countries had
an effect on Korea even before social distancing, and this effect needs to be detailed through further
studies from a long-term perspective.
3.3. Changes in Air Quality from Social Distancing
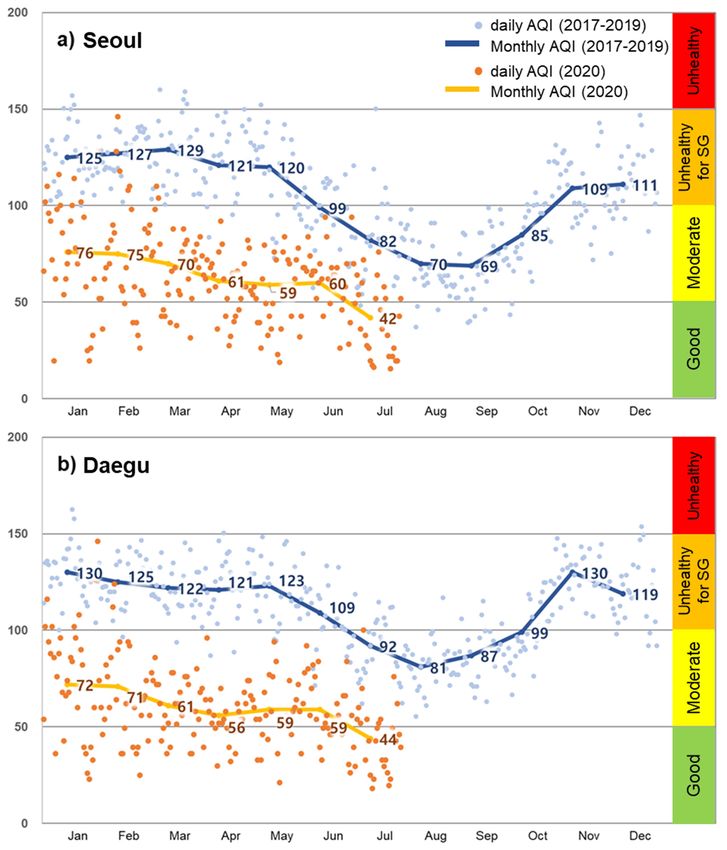
The average monthly AQI in 2020 and over the three previous years was analyzed to assess the
impact of COVID-19 events on changes in air quality (Figure 7). In general, South Korea experiences
aAtmosphere
severe deterioration in airREVIEW
2020, 11, x FOR PEER quality due to the influence of Asian dust in spring [38,39]. However, 13 of 17
from March to May the AQI fell considerably in 2020 in contrast to the higher level in the two cities
over the
over the past
past three
three years.
years. The
The largest
largest decline
decline in
in the
the AQI
AQI occurred
occurred inin April
April and
and May
May due
due to
to aa dramatic
dramatic
decrease in PM 2.5 immediately after social distancing. The decline was further observed in the trend
decrease in PM2.5 immediately after social distancing. The decline was further observed in the trend
in monthly
in monthly changes
changes in in the
the AQI,
AQI, which
which was
was similar
similar to
to that
that of
of previous
previous years.
years. However, after May
However, after May 5, 5,
relaxed social
relaxed social distancing
distancing probably
probably weakened
weakened the the effect
effect on
on improving
improving the
the air
air quality
quality due
due to
to increased
increased
human activities. However, the AQI remained lower than the average AQI of
human activities. However, the AQI remained lower than the average AQI of the past three years.the past three years.
Figure 7. Cont.Atmosphere 2020, 11, 1137 12 of 15
Figure 7. Comparison of daily and monthly air quality index (AQI) between 2020 and the previous
Figure 7. Comparison of daily and monthly air quality index (AQI) between 2020 and the previous
three years ((a) Seoul, (b) Daegu). Categories of the AQI are “good” (green, 0–50), “moderate” (yellow,
three years (a: Seoul, b: Daegu). Categories of the AQI are “good” (green, 0–50), “moderate” (yellow,
51–100), “unhealthy for sensitive groups (SG)” (orange, 101–150), and “unhealthy” (red, 151–200).
51–100), “unhealthy for sensitive groups (SG)” (orange, 101–150), and “unhealthy” (red, 151–200).
“Very unhealthy” (purple, 201-300) and “hazardous” (maroon, 301–500) were not observed in this study.
“Very unhealthy” (purple, 201-300) and “hazardous” (maroon, 301–500) were not observed in this
study.
We identified the major pollutants affecting the AQI. The distributions of the indicatory pollutants
according to each AQI class before and after social distancing are shown in Tables S2 and S3.
We identified
The reduction of thethe
AQImajor
score pollutants affecting
in April was the AQI.
remarkable, TheAQI
and the distributions
improvementsof the indicatory
of 44.8% and
pollutants according to each AQI class before and after social distancing are shown in Table
48.7%, respectively, in Seoul and Daegu was notable compared to 2017–2019. Interestingly, SO2 and S2 and
CO
were never responsible for the AQI score. In both cities, PM2.5 was responsible for more than 90% of
AQI score. Compared to February, the air quality in March improved considerably and never exceeded
100 (unhealthy for sensitive groups) in Daegu. The March AQI score in Seoul also exceeded 100 by only
6.5%, which was significantly lower than in January (19.4%) and February (22.6%). Since March, PM10
has been identified as the primary pollutant affecting the AQI, but it is negligible, and the contribution
of O3 was seen in July due to the increased temperature and facilitation of reactions producing O3 .
However, the AQI derived from O3 was equivalent to Class 1 (good). Similarly, in the previous year,
PM2.5 was responsible for more than 90% of the AQI score, followed by O3 and PM10 .
Although decreases in the PM2.5 /PM10 ratio after social distancing supported the decrease in
contributions from anthropogenic emissions, the AQI analysis results confirmed that PM2.5 was still a
key contributor to air quality in South Korea.
4. Conclusions
To assess the effects of social distancing on air quality due to COVID-19 in Seoul and Daegu, six
representative air pollutants were analyzed and the AQI distribution was observed. The comparison
between 2020 and the previous three years revealed a significant drop in PM compared to gaseous
pollutants. In both cities, the mean March PM2.5 concentration showed a dramatic decline of 31–36%.
After social distancing, the PM2.5 /PM10 ratio was reduced by about 19% from 0.68 to 0.54, confirming
that traffic-related PM2.5 emissions were decreased due to reductions in human activities. A partial
decrease in CO and NO2 was observed, which, as with PM2.5 , was related to the reduction in vehicle
emissions. It was not clear whether the reduction in SO2 concentrations was the result of social
distancing. However, reductions in the transboundary SO2 proved that COVID-19 control actionsAtmosphere 2020, 11, 1137 13 of 15
could affect the air quality across borders as well within a country. The change in O3 due to COVID-19
did not produce results consistent with prior studies and suggests that further research is needed to
reflect meteorological conditions.
During the observation period, PM2.5 was responsible for more than 90% of the AQI score regardless
of the COVID-19 pandemic occurrence. In Korea, the indicatory pollutant is PM2.5 , and we suggest
that the rapid decline in traffic volume (30-69%) in the early social distancing period led to significant
air quality improvement, as in the case of megacities around the world experiencing COVID-19.
Notably, after the implementation of ‘distancing in daily life’, a weakened social distancing,
traffic volume recovered to 97.5% compared to pre-COVID-19, similar to the pattern of changes in air
pollutants. Our findings support that air pollution is directly related to traffic.
Korea has experienced an improvement in air quality due to the reduction in transboundary
pollutants from neighboring countries since COVID-19 first occurred, and it has experienced a significant
decrease in the AQI in conjunction with the effect of social distancing. In particular, the improvement in
air quality in April is an exceptional example of COVID-19 control action having a positive effect on air
quality. Significant changes in air quality were observed in countries adopting strict COVID lockdown
policies. Even in Korea, which adopted weaker guidelines of social distancing, the overall air quality
was significantly improved. If the chemical composition analysis of PM2.5 was added, the impact of
neighboring countries and domestic sources could be analyzed in more detail.
Despite the significant air quality improvement found in Seoul and Daegu, there are some
differences in the spread of COVID-19. In Daegu, the number of confirmed cases exploded in the early
stages of the COVID-19 outbreak, while Seoul showed a steady increase. Meanwhile, the outbreak in
Seoul in August led to the second pandemic of COVID-19 in Korea. Therefore, we suggest that further
studies are needed to approach air quality according to the extent of COVID-19.
Our findings indicate that the national decisions to limit human activities led to changes in regional
and temporal air pollution levels and support the need for cross-border cooperation to improve air
quality in the East Asia region. The on-going COVID-19 pandemic has caused global economic
stagnation, increased disease burden, and even mental health effects, but some positive effects on
the global environment, including improvements in air quality, suggest a direction for a sustainable
environment in the post-COVID-19 era.
Supplementary Materials: The following are available online at http://www.mdpi.com/2073-4433/11/10/1137/s1,
Table S1. Comparison of meteorological conditions (the same dates in 2020 and the previous 3 years), Table S2.
Distribution of contributary pollutants of monthly AQI in Seoul, Table S3. Distribution of contributary pollutants
of monthly AQI in Daegu. Figure S1, the number of daily confirmed cases and deaths for MERS-CoV in Korea
(2015), Figure S2. The annual estimated emissions of SOx in Korea.
Author Contributions: Conceptualization, J.H.S. and J.-R.S.; methodology, J.H.S.; validation, J.H.S. and H.W.J.;
formal analysis, J.H.S. and U.J.S.; investigation, J.H.S. and U.J.S.; data curation, J.H.S and H.W.J.; writing—original
draft preparation, J.H.S. and H.W.J.; writing—review and editing, J.H.S. and J.-R.S. All authors have read and
agreed to the published version of the manuscript.
Funding: This research received no external funding.
Acknowledgments: The authors thank the Korea Environment Corporation for providing the air quality data.
Conflicts of Interest: The authors declare no conflict of interest.
References
1. Cucinotta, D.; Vanelli, M. WHO declares COVID-19 a pandemic. Acta Bio Med. Atenei Parm. 2020, 91, 157–160.
2. Nakada, L.Y.K.; Urban, R.C. COVID-19 pandemic: Impacts on the air quality during the partial lockdown in
São Paulo state, Brazil. Sci. Total Environ. 2020, 730, 139087. [CrossRef] [PubMed]
3. Sharma, S.; Zhang, M.; Gao, J.; Zhang, H.; Kota, S.H. Effect of restricted emissions during COVID-19 on air
quality in India. Sci. Total Environ. 2020, 728, 138878. [CrossRef]
4. Huang, X.; Ding, A.; Gao, J.; Zheng, B.; Zhou, D.; Qi, X.; Tang, R.; Wang, J.; Ren, C.; Nie, W.; et al.
Enhanced secondary pollution offset reduction of primary emissions during COVID-19 lockdown in China.
Natl. Sci. Rev. 2020. [CrossRef]Atmosphere 2020, 11, 1137 14 of 15
5. Wang, P.; Chen, K.; Zhu, S.; Wang, P.; Zhang, H. Severe air pollution events not avoided by reduced
anthropogenic activities during COVID-19 outbreak. Resour. Conserv. Recycl. 2020, 158, 104814. [CrossRef]
[PubMed]
6. Xu, K.; Cui, K.; Young, L.-H.; Wang, Y.-F.; Hsieh, Y.-K.; Wan, S.; Zhang, J. Air Quality Index, Indicatory Air
Pollutants and Impact of COVID-19 Event on the Air Quality near Central China. Aerosol Air Qual. Res. 2020,
20, 1204–1221. [CrossRef]
7. Berman, J.D.; Ebisu, K. Changes in US air pollution during the COVID-19 pandemic. Sci. Total Environ. 2020,
739, 139864. [CrossRef] [PubMed]
8. Zangari, S.; Hill, D.T.; Charette, A.T.; Mirowsky, J.E. Air quality changes in New York City during the
COVID-19 pandemic. Sci. Total Environ. 2020, 742, 140496. [CrossRef]
9. Lovarelli, D.; Conti, C.; Finzi, A.; Bacenetti, J.; Guarino, M. Describing the trend of ammonia, particulate
matter and nitrogen oxides: The role of livestock activities in Northern Italy during Covid-19 quarantine.
Environ. Res. 2020, 191, 110048. [CrossRef]
10. Collivignarelli, M.C.; Abbà, A.; Bertanza, G.; Pedrazzani, R.; Ricciardi, P.; Miino, M.C. Lockdown for
CoViD-2019 in Milan: What are the effects on air quality? Sci. Total Environ. 2020, 732, 139280. [CrossRef]
11. Kumari, P.; Toshniwal, D. Impact of lockdown measures during COVID-19 on air quality–A case study of
India. Int. J. Environ. Health Res. 2020, 1–8. [CrossRef]
12. Singh, R.P.; Chauhan, A. Impact of lockdown on air quality in India during COVID-19 pandemic. Air Qual.
Atmos. Health 2020, 13, 921–928. [CrossRef] [PubMed]
13. Dantas, G.; Siciliano, B.; França, B.B.; da Silva, C.M.; Arbilla, G. The impact of COVID-19 partial lockdown on
the air quality of the city of Rio de Janeiro, Brazil. Sci. Total Environ. 2020, 729, 139085. [CrossRef] [PubMed]
14. Debone, D.; da Costa, M.V.; Miraglia, S.G. 90 days of COVID-19 social distancing and its impacts on air
quality and health in Sao Paulo, Brazil. Sustainability 2020, 12, 7440. [CrossRef]
15. Collaborators, G.R.F. Global, regional, and national comparative risk assessment of 84 behavioural,
environmental and occupational, and metabolic risks or clusters of risks for 195 countries and territories,
1990–2017: A systematic analysis for the Global Burden of Disease Study 2017. Lancet (England) 2018, 392, 1923.
16. Ferro, A.R.; Kopperud, R.J.; Hildemann, L.M. Source strengths for indoor human activities that resuspend
particulate matter. Environ. Sci. Technol. 2004, 38, 1759–1764. [CrossRef] [PubMed]
17. Goolsbee, A.; Syverson, C. Fear, lockdown, and Diversion: Comparing Drivers of Pandemic Economic Decline 2020;
National Bureau of Economic Research: Cambridge, MA, USA, 2020.
18. Kroll, J.H.; Heald, C.L.; Cappa, C.D.; Farmer, D.K.; Fry, J.L.; Murphy, J.G.; Steiner, A.L. The complex chemical
effects of COVID-19 shutdowns on air quality. Nat. Chem. 2020, 12, 777–779. [CrossRef]
19. Han, B.-S.; Park, K.; Kwak, K.-H.; Park, S.-B.; Jin, H.-G.; Moon, S.; Kim, J.-W.; Baik, J.-J. Air Quality Change in
Seoul, South Korea under COVID-19 Social Distancing: Focusing on PM2.5 . Int. J. Environ. Res. Public Health
2020, 17, 6208. [CrossRef]
20. Ju, M.J.; Oh, J.; Choi, Y.-H. Changes in air pollution levels after COVID-19 outbreak in Korea. Sci. Total Environ.
2020, 750, 141521. [CrossRef]
21. Choi, J.H.-J. The city is connections: Seoul as an urban network. Multimed. Syst. 2010, 16, 75–84. [CrossRef]
22. The Ministry of Health and Welfare of South Korea (MOHW). COVID-19. Available online: http://ncov.
mohw.go.kr/bdBoardList_Real.do (accessed on 22 August 2020).
23. Bishoi, B.; Prakash, A.; Jain, V. A comparative study of air quality index based on factor analysis and US-EPA
methods for an urban environment. Aerosol Air Qual. Res. 2009, 9, 1–17. [CrossRef]
24. Faridi, S.; Niazi, S.; Sadeghi, K.; Naddafi, K.; Yavarian, J.; Shamsipour, M.; Jandaghi, N.Z.S.; Sadeghniiat, K.;
Nabizadeh, R.; Yunesian, M. A field indoor air measurement of SARS-CoV-2 in the patient rooms of the
largest hospital in Iran. Sci. Total Environ. 2020, 725, 138401. [CrossRef] [PubMed]
25. Lee, H.-J.; Jo, H.-Y.; Kim, S.-W.; Park, M.-S.; Kim, C.-H. Impacts of atmospheric vertical structures on
transboundary aerosol transport from China to South Korea. Sci. Rep. 2019, 9, 1–9. [CrossRef]
26. Joint Research Project for Long-Range Transboundary Air Pollutans in Northeast Asia (LTP); Korean Ministry of
Environment (KMOE): Sejong, Korea, 2019.
27. Marlier, M.E.; Xing, J.; Zhu, Y.; Wang, S. Impacts of COVID-19 response actions on air quality in China.
Environ. Res. Commun. 2020, 2, 075003. [CrossRef]
28. Xu, G.; Jiao, L.; Zhang, B.; Zhao, S.; Yuan, M.; Gu, Y.; Liu, J.; Tang, X. Spatial and temporal variability of the
PM2. 5/PM10 ratio in Wuhan, Central China. Aerosol Air Qual. Res. 2016, 17, 741–751. [CrossRef]Atmosphere 2020, 11, 1137 15 of 15
29. Zhao, D.; Chen, H.; Yu, E.; Luo, T. PM2.5 /PM10 Ratios in Eight Economic Regions and Their Relationship
with Meteorology in China. Adv. Meteorol. 2019, 2019, 5295726. [CrossRef]
30. The Korea Transport Institute (KOTI). Impact Analysis and Response of COVID-19 on Transportation Sector.
Available online: https://www.koti.re.kr/main/covid19 (accessed on 22 August 2020).
31. Seasonal Particulate Matter (PM) Management; Korean Ministry of Environment (KMOE): Sejong, Korea, 2020.
32. Bhardwaj, P.; Ki, S.J.; Kim, Y.H.; Woo, J.H.; Song, C.K.; Park, S.Y.; Song, C.H. Recent changes of trans-boundary
air pollution over the Yellow Sea: Implications for future air quality in South Korea. Environ. Pollut. 2019,
247, 401–409. [CrossRef]
33. Transport Operation & Information Service (TOPIS). Traffic Status. Available online: https://topis.seoul.go.kr
(accessed on 22 August 2020).
34. Zhang, J.; Cui, K.; Wang, Y.-F.; Wu, J.-L.; Huang, W.-S.; Wan, S.; Xu, K. Temporal variations in the air quality
index and the impact of the COVID-19 event on air quality in western China. Aerosol Air Qual. Res. 2020, 20,
1552–1568. [CrossRef]
35. Hashim, B.M.; Al-Naseri, S.K.; Al-Maliki, A.; Al-Ansari, N. Impact of COVID-19 lockdown on NO2, O3,
PM2. 5 and PM10 concentrations and assessing air quality changes in Baghdad, Iraq. Sci. Total Environ. 2020,
754, 141978. [CrossRef]
36. Zoran, M.A.; Savastru, R.S.; Savastru, D.M.; Tautan, M.N. Assessing the relationship between ground levels
of ozone (O3 ) and nitrogen dioxide (NO2 ) with coronavirus (COVID-19) in Milan, Italy. Sci. Total Environ.
2020, 740, 140005. [CrossRef]
37. Zambrano-Monserrate, M.A.; Ruano, M.A. Has air quality improved in Ecuador during the COVID-19
pandemic? A parametric analysis. Air Qual. Atmos. Health 2020, 13, 929–938. [CrossRef] [PubMed]
38. Nakao, M.; Ishihara, Y.; Kim, C.-H.; Hyun, I.-G. The impact of air pollution, including Asian sand dust, on
respiratory symptoms and health-related quality of life in outpatients with chronic respiratory disease in
Korea: A panel study. J. Prev. Med. Public Health 2018, 51, 130. [CrossRef] [PubMed]
39. Sharma, A.P.; Kim, K.H.; Ahn, J.W.; Shon, Z.H.; Sohn, J.R.; Lee, J.H.; Ma, C.J.; Brown, R.J. Ambient particulate
matter (PM10) concentrations in major urban areas of Korea during 1996–2010. Atmos. Pollut. Res. 2014, 5,
161–169. [CrossRef]
Publisher’s Note: MDPI stays neutral with regard to jurisdictional claims in published maps and institutional
affiliations.
© 2020 by the authors. Licensee MDPI, Basel, Switzerland. This article is an open access
article distributed under the terms and conditions of the Creative Commons Attribution
(CC BY) license (http://creativecommons.org/licenses/by/4.0/).You can also read