Reef Water Quality Protection Plan - Investment Strategy 2013 2018
←
→
Page content transcription
If your browser does not render page correctly, please read the page content below
Reef Water Quality
Protection Plan
Investment Strategy 2013 – 2018
Contents

                                                            Introduction                                                                                                                      3

                                                            Scope                                                                                                                             3

                                                            Achieving Reef Plan targets                                                                                                       4

                                                            Relevant Reef Plan 2013 actions                                                                                                   5

                                                            Governments’ commitment to Reef Plan                                                                                              5

                                                            Principles for investment                                                                                                         6

                                                            Investment across key work areas                                                                                                  7

                                                            1. Prioritising investment and knowledge                                                                                          8

                                                                   Past investment                                                                                                            8

                                                 		Future investment                                                                                                                          8

                                                            2. Responding to the challenge                                                                                                    9

                                                 		Incentives and grants                                                                                                                      9

                                                 		                Best Management Practice programs                                                                                          9

                                                 		                Extension and education                                                                                                    9

                                                 		Regulations                                                                                                                           10

                                                 		Oversight                                                                                                                             10

                                                            3. Evaluating performance                                                                                                    11

                                                            Other sources of funding                                                                                                     11

                                                            -      Reef Trust                                                                                                            11

                                                            -      Non-government organisation investment                                                                                11

                                                            -      Industry and landholder contributions                                                                                 11

                                                            Prioritisation of investment                                                                                                 12

                                                            -      Risk assessment                                                                                                       12

                                                            -      Multi-criteria analysis                                                                                               18

                                                            -      Prioritisation of coastal repair works                                                                                18

                                                            Investment risks                                                                                                             19

© The State of Queensland (Department of the Premier and Cabinet) 2014. Published by the Reef Water Quality Protection Plan Secretariat, October 2014, 100 George Street, Brisbane
Qld 4000. The Queensland Government supports and encourages the dissemination and exchange of information. However, copyright protects this document. The State of Queensland
has no objection to this material being reproduced, made available online or electronically but only if it is recognised as the owner of the copyright and this material remains unaltered.
Copyright enquiries about this publication should be directed to the Department of the Premier and Cabinet, by email to copyright@premiers.qld.gov.au or in writing to PO Box 15185,
City East Qld 4002. Copies of this publication can be obtained by contacting (07) 3003 9381 or at www.reefplan.qld.gov.au.
Image credits: Great Barrier Reef Marine Park Authority and Tourism and Events Queensland.

                         Investment Strategy 2013–2018 | Reef Water Quality Protection Plan | www.reefplan.qld.gov.au                                                                             2
Introduction

It is now more than 10 years since the Reef              One of the key deliverables of Reef Plan 2013
Water Quality Protection Plan (Reef Plan) was            is agreement on a coordinated Investment
launched in 2003 as a joint Australian and               Strategy for implementing Reef Plan actions.
Queensland government commitment to halt and
                                                         This Investment Strategy broadly describes
reverse the decline in water quality entering the
                                                         the Queensland and Australian governments’
Great Barrier Reef lagoon.
                                                         investment in activities that contribute to Reef
Reef Plan was updated to re-focus actions on             Plan. It builds upon the previous Investment
improving water quality in 2009. The updated             Strategy 2009 to 2013.
Reef Plan was more strategic and outcome
                                                         This Investment Strategy also showcases
focused, with improved accountability for actions
                                                         investments from non-government partners
and better monitoring to measure success.
                                                         and non-government organisations. It is hoped
An updated Reef Plan was released in 2013 and            that the strategy may provide useful guidance
sets the direction from 2013 to 2018, building           to non-government investors with a desire to
strongly upon past activities and maintaining a          invest in Great Barrier Reef related water quality
focus on partnerships.                                   activities (e.g. non-profit organisations and
                                                         industry etc).

Scope

This strategy provides details on the level of           is the joint responsibility of the Great Barrier
investment committed to Reef Plan activities and         Reef Marine Park Authority and the Queensland
how this investment contributes to Reef Plan’s           Government.
key work areas.
                                                         This strategy does not attempt to detail
This strategy is primarily restricted to those           expenditure on every individual program that
activities that are within the scope of Reef Plan,       contributes to Reef Plan, rather it provides a
namely activities related to broadscale land             general overview of major investments across
use. However, it also includes investments that          program areas. Figures are indicative investments
are designed to reduce urban runoff, improve             for 2013 to 2018, based primarily on actual
the condition and extent of native habitats and          investments in 2013 – 2014. It is acknowledged
some land use planning activities that affect            that investments may vary over time as priorities
water quality. It does not include the day-to-day        are revised based on new information and
management of the Great Barrier Reef which               new initiatives.

              Investment Strategy 2013–2018 | Reef Water Quality Protection Plan | www.reefplan.qld.gov.au    3
Achieving Reef Plan targets

Reef Plan provides the coordination and
oversight to ensure investments result in the
best possible outcomes for the Great Barrier
Reef. The Australian Government, Queensland
Government and Reef Plan partners all invest
in actions that directly contribute to achieving
Reef Plan’s targets and goal.

There is no single action or entity that will
achieve the targets alone. Rather, the targets
will be achieved through the coordinated and
collaborative delivery of a suite of actions
including those related to incentives, Best
Management Practice (BMP) programs,
regulations, planning, research and education.
This coordinated and collaborative approach
is fundamental to Reef Plan.

Industry and private organisations are strongly
encouraged to maximise the chances of
achieving the goal and targets through their own
complementary investments.

                Government investment

                   Reef Plan actions

           Expected outcomes from actions

                   Reef Plan targets

                    Reef Plan goal

              Investment Strategy 2013–2018 | Reef Water Quality Protection Plan | www.reefplan.qld.gov.au   4
Relevant Reef Plan 2013 actions

Action three of Reef Plan 2013 aims to:

     Prioritise and align investments based on risk
     assessments of key pollutants, source areas and the risk
     they pose to Great Barrier Reef ecosystems, as well as
     information on priority areas for rehabilitation.

This action includes two investment related
deliverables:
•   Investment through Reef Plan is informed
    by an investment prioritisation process
    that identifies priority pollutants, industries
    and areas (see section on multi-criteria
    analysis).
•   Agree on a coordinated Reef Plan
    Investment Strategy for implementing
    Reef Plan (this strategy).

Governments’ commitment to Reef Plan

Both the Queensland and Australian                        supported through the Australian Government
governments have invested significant funding             Reef Programme. Building on this will be a suite
and resources in initiatives to improve Reef water        of investments in the new $40 million Reef Trust.
quality. As part of the release of Reef Plan 2013,
                                                          The Queensland Government will maintain
the Australian and Queensland governments
                                                          its annual investment of $35 million a year
collectively committed $375 million from 2013
                                                          ($175 million over five years), which supports
to 2018 to help achieve the Reef Plan 2013 goal
                                                          the roll out of Best Management Practice
and targets.
                                                          (BMP) programs and broader Reef water
The Australian Government continues to                    quality initiatives.
support a number of initiatives to improve the
                                                          The Reef 2050 Long-Term Sustainability Plan
quality of water entering the Reef. Funding of
                                                          is an overarching framework for protecting and
approximately $160 million has been committed
                                                          managing the Great Barrier Reef from 2015 to
for a suite of activities, the majority of which are
                                                          2050. Measures implemented through Reef Plan
                                                          are key components which will help meet the
                                                          water quality outcome identified in the Reef 2050
                                                          Long-Term Sustainability Plan.

               Investment Strategy 2013–2018 | Reef Water Quality Protection Plan | www.reefplan.qld.gov.au   5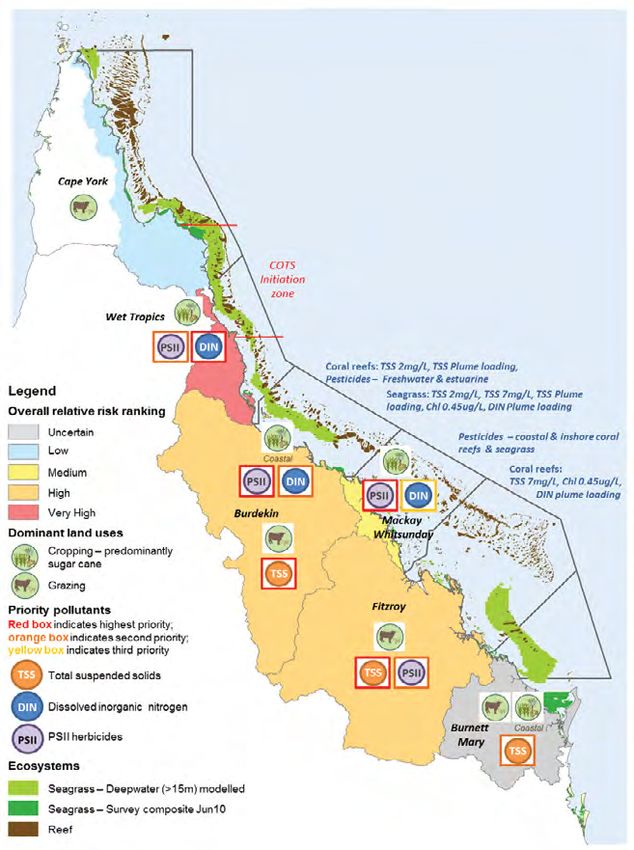
Principles for investment

A number of investment principles guide this
Investment Strategy (see Figure 1).
Figure 1: Reef Plan principles for investment

       Investment principles

       Investment should be targeted at the most cost-effective
        practices that deliver the greatest water quality benefit.

    Investment should be targeted to maximise reef water quality
   outcomes, particularly by focusing on the highest risk pollutants
                      in the highest risk areas.

 Investment should be coordinated and integrated wherever possible
  across programs to avoid duplication and help leverage resources.

             Prioritisation of investment should be based
            on the best and most up-to-date information.

 Investments should be flexible and regularly reviewed to encourage
   adaptive management based on the latest emerging information.

     Opportunities to pool resources and invest more strategically
       should be explored and adopted where advantageous.

              Investment Strategy 2013–2018 | Reef Water Quality Protection Plan | www.reefplan.qld.gov.au   6
Investment across key work areas
Three priority work areas have been established Figure 2: Broad government funding breakdown for Reef Plan 2013 (indicative
to improve water quality outcomes: based on 2013 – 2014 and 2014 – 2015 anticipated expenditure)
1. Prioritising investment and
knowledge — Prioritise, coordinate and
integrate programs to maximise Reef water
quality outcomes.
2. Responding to the
challenge — Landholders adopt 10% 16% 74%
management systems that maximise Reef
water quality improvements while maintaining
and enhancing resilience, business
performance and environmental outcomes.
Government policies and programs that
support Reef Plan’s goal and targets are
maintained.
3. Evaluating performance — The efficiency
Responding to the challenge
and effectiveness of Reef Plan is measured
through monitoring, evaluation and reporting.
Evaluating performance
Figure 2 shows the breakdown of government
investment across these three key work areas.
Prioritising investment and knowledge
Investment Strategy 2013–2018 | Reef Water Quality Protection Plan | www.reefplan.qld.gov.au 71. Prioritising investment and knowledge
Past investment The organisation also seeks to identify gaps in
research investment to avoid duplication with
There was a significant investment in water
other research programs. Funding will be used
quality research, development and innovation
for a four-year devolved grants program to
over the five years to 2013. This included
support research projects that will:
more than $8 million through the Queensland
Government’s Reef Water Quality Research and • better define the attributes of a Great
Development Program (with finalisation and Barrier Reef ecosystem that is resilient to
dissemination of outputs ongoing to the end of climate change
2014) and $10 million through the Australian • test the feasibility of minimising the impacts
Government Reef Rescue Research and of climate change on the ecosystem
Development program, as well as up to $7 million
• increase the adaptive capacity of the
a year through the National Environment
ecosystem to climate change.
Research Program (NERP) Tropical Ecosystems
Hub (which continues to the end of 2014). The Queensland Government through the
The Australian Government also allocated Department of Agriculture, Fisheries and Forestry
more than $500,000 to extend six Reef Rescue has committed $16 million over four years to
research and development projects for a further Sugar Research Australia to address industry
year due to climate difficulties. research priorities, some of which will have
benefits for Reef water quality. The Queensland
The results from research and development
Government Reef Water Quality Program is also
projects were presented at five Reef Rescue
reviewing ongoing investment in research and
regional science forums from September to
development from 2014 until 2019.
October 2013 to inform the prioritisation of
on-ground investments over the next three to To address key knowledge gaps and inform Reef
five years. This information was also considered Programme and Reef Trust investment priorities,
in updating the research and development the Australian Government funded research and
priorities for Reef Plan 2013, outlined in the development supporting science synthesis and
Reef Plan Research, Development and Innovation integration activities in 2013 – 2014.
Strategy 2013 – 2018. Projects include investigating bioavailability
of particulate nitrogen, rangelands grazing
Future investment operations and herd management practices,
The Australian Government has committed and the economic costs and benefits of the
$1 million to fund research on new crown- adoption of innovative land management
of-thorns starfish control methods, total practices. This research will improve the
abundance estimates and population genetics. understanding of agricultural impacts on the
The Australian Government has also committed Reef. Future Australian Government Reef
$12.5 million over four years (2013 – 2014 to related research and development needs will
2016 – 2017) to the Great Barrier Reef Foundation be addressed primarily through the National
to implement its research vision of ‘Resilient Environmental Science Programme.
Coral Reefs Successfully Adapting to Climate
Further information on research priorities can be
Change’. The Great Barrier Reef Foundation
found in the Reef Plan Research, Development
is an Australian not-for-profit organisation that
and Innovation Strategy 2013 – 2018.
supports research to protect, enhance and
preserve coral reefs through its strategic links to
private sector and philanthropic organisations.
Investment Strategy 2013–2018 | Reef Water Quality Protection Plan | www.reefplan.qld.gov.au 82. Responding to the challenge
The major focus of investment to date has The Australian Government is providing
been addressing poor water quality by working $41 million from 2013 – 2014 to 2017 – 2018
with industry and regional Natural Resource to regional Natural Resource Management
Management organisations to improve land organisations in the Reef catchments to address
management through a combination of sustainable environment and sustainable
mechanisms including grants, industry led Best agriculture priorities. These include improving
Management Practice programs, extension the management of agriculture and the natural
and education, and regulations. A summary of resource base, promoting innovation in Australian
investment in these areas is provided below. agriculture, maintaining ecosystem services and
protecting the conservation estate, which will
Incentives and grants subsequently lead to improving the health and
resilience of the Great Barrier Reef.
The Australian Government has committed to
the following investments over the next three to The Queensland Government invests in
five years: on-ground grants through the Queensland
Natural Resource Management Investment
• $61 million for Water Quality Grants
Program which will provide $30 million over
(2013 – 2014 to 2015 – 2016)—including
five years for natural resource management
support for farm planning, training, extension
in the catchments adjacent to the Reef.
and water quality grants
Queensland’s Everyone’s Environment grants
• $3 million for Water Quality Partnerships
program also provides around $0.5 million a year
(2013 – 2014 to 2017 – 2018)—including
to community groups to improve water quality in
support for industry management
the catchments adjacent to the Reef.
practice benchmarking, coordination and
communication activities
Best Management Practice
• $23.5 million for Systems Repair and Urban
Water Quality on-ground grants (2013 – 2014
programs
to 2017 – 2018) The Queensland Government has invested
$5.4 million to support the establishment
• $2.75 million for Systems Repair and Urban
of industry-led Best Management Practice
Water Quality planning grants (2013 – 2014)
programs for the cane and grazing industries
• $5.1 million for crown-of-thorns starfish to mid-2014. An extension of Queensland
(COTS) control, which aims to decrease Government support to cane and grazing Best
the impact of COTS by supporting tourism Management Practice programs for a further
operators to continue removing COTS from three years is being negotiated.
reefs in high value tourism sites (2013 – 2014).
The Australian Government has also
committed a further $2 million for COTS
Extension and education
The Queensland Government through the
control through the Reef Trust initiative
Department of Agriculture, Fisheries and Forestry
(2014-2015 to 2015-2016).
invests around $2 million a year in additional
Funding of $10 million has also been committed extension services to assist the cane and
to Land and Sea Country Partnerships to grazing industries in priority areas where land
continue to strengthen communications between management practice improvements are most
local communities, Reef managers and Reef needed to improve Reef water quality.
stakeholders and build a better understanding of
Traditional Owner use of the Great Barrier Reef
Marine Park.
Investment Strategy 2013–2018 | Reef Water Quality Protection Plan | www.reefplan.qld.gov.au 9The Australian Government as part of its grants Regulations
and partnerships funding (outlined earlier) is
The Queensland Government continues to
supporting an integrated programme of farm
maintain a number of core pieces of legislation
planning, training, extension and education,
(including vegetation management, water
run by regional Natural Resource Management
resource and land use planning) that provide a
organisations and industry organisations.
strong foundation for continued improvement in
Industry organisations also invest in extension water quality.
services, with the Australian Government
Reef protection regulations under the
matching industry levies paid through rural
Environment Protection Act 1994 are being
research and development organisations such
maintained until voluntary, industry-led Best
as Sugar Research Australia and Meat and
Management Practice programs for the sugar
Livestock Australia. There is significant scope
cane and grazing industries are shown to be
to better coordinate and integrate extension
effective in increasing the adoption of improved
services across providers and tap into other
land management practices.
advisors (e.g. the fertiliser industry). This will
be the focus of the Reef Plan Extension and Total Queensland Government investment in all
Education Strategy 2013 – 2018. relevant regulatory and policy development is
approximately $13 million a year. This includes
The Australian Government is providing critical
funding towards:
operational support to the Great Barrier Reef
Marine Park Authority to maintain its role as the • development of Best Management Practice
cornerstone institution for community, business, programs for the cane and grazing industries
monitoring and government management of the • coastal planning
Great Barrier Reef. • statutory planning (e.g. regional planning,
This operational support will allow the Great state planning policies etc.)
Barrier Reef Marine Park Authority to enhance • Queensland Wetland Program
the conservation of the Reef, maintain and • Great Barrier Reef strategic assessment
develop Reef resilience and continue the Reef
• vegetation management
Guardians programs. Reef Guardians recognises
the good environmental work undertaken by • water resource planning
communities and industries to protect the Great • catchment planning
Barrier Reef and involves a significant education • Reef 2050 Long-Term Sustainability Plan.
component which aims to create awareness,
understanding and appreciation for the Reef and
Oversight
its connected ecosystems.
The Queensland Government provides support
and oversight for Reef Plan (around $1 million a
year). The Australian Government through the
Department of the Environment, Department of
Agriculture and the Great Barrier Reef Marine
Park Authority also provides support and
oversight for Reef Plan.
Investment Strategy 2013–2018 | Reef Water Quality Protection Plan | www.reefplan.qld.gov.au 103. Evaluating performance
Monitoring and evaluation remains a key focus of The Queensland Government is also funding
investment to ensure that governments and the the establishment of the Gladstone Healthy
public can assess the effectiveness of collective Harbour Partnership, which has a strong water
efforts to improve water quality. quality management and reporting focus.
The Queensland Government has committed
The Paddock to Reef Integrated Monitoring,
$4 million over two years and the Australian
Modelling and Reporting Program continues
Government has committed $1 million over
to be the main vehicle for joint monitoring
two years to the Gladstone Healthy Harbour
and evaluation with contributions from both
Partnership.
governments totalling approximately $8 million
a year. Further information can be found The Queensland Government is a major
in the Reef Plan Monitoring and Evaluation contributor of data, information and tools which
Strategy 2013 – 2018. help to prioritise investment and knowledge
through research, monitoring and modelling
programs.
Other sources of funding
A range of parties invest in Reef management ensure that there is strong coordination of coastal
and water quality improvement including the and water quality management.
agricultural, pesticide, fertiliser and tourism
industries, not-for-profit organisations and other Non-government organisation
private sector investors.
investment
Increasingly in recent years, non-government
Reef Trust organisations have invested directly in water
The Australian Government has committed quality initiatives. This includes funding to support
$40 million to establish a Reef Trust. The Reef Project Catalyst, a joint initiative of the World
Trust commenced operation in 2014 – 2015 and Wildlife Fund and Coca Cola Corporation. The
will combine both Commonwealth and private Australian Government has previously provided
funds to focus on improving coastal habitat $2 million funding through the Reef Water Quality
and water quality along the Great Barrier Reef. Grants programme for growers who are involved
The Trust will be jointly coordinated with the in Project Catalyst. These grants fund projects
Queensland Government. and supply technical support.
After the initial injection from the Commonwealth,
funding will also be derived from the pooling Industry and landholder
of offset funds for significant projects under contributions
the Environment Protection and Biodiversity As a condition of receiving Australian
Conservation Act 1999 and potentially Government Reef water quality grants,
Queensland legislation. The aim is to provide a landholders make a co‑contribution of cash and/
strategic and transparent approach to addressing or in-kind investment, dependent on the relative
the multiple threats to the Reef. The Trust will public-private benefit of the funding outcomes.
Investment Strategy 2013–2018 | Reef Water Quality Protection Plan | www.reefplan.qld.gov.au 11The $96 million invested in Australian The Great Barrier Reef Marine Park Authority’s
Government Reef Rescue grants from 2008 until Reef Guardian Farmers and Graziers program
2013 was matched by $157 million of industry results in farmers and graziers promoting
investment ($108 million in cash and $49 million sustainable farming practices that make
in-kind). Industry has therefore co-invested over economic sense and are also good for
$1.60 (in kind and in cash) for every $1 of grant the environment. The program provides a
money received. Total on-ground project costs mechanism to recognise and support the efforts
(i.e. grants and landholder cash co-contribution, of participants who are sustainably managing
in-kind and labour) amount to nearly $250 million, natural resources. It also provides an opportunity
$204 million of which are direct cash injections for participants to network and share information
in local economies. It is anticipated that similar and ideas with other producers across the Great
ratios of co-contribution will occur through Barrier Reef catchments.
the current Australian Government funding
committed for water quality improvements.
Prioritisation of investment
Risk assessment The risk assessment results were a key
consideration in the Reef Rescue Water Quality
The 2013 Scientific Consensus Statement
Grants and Partnerships: Priorities for Further
provides the most up-to-date information on
Action 2013 –14 to 2015 –16 Summary of the
the sources of pollutants and their relative risks
Outcomes and Great Barrier Reef toolbox
which are critical in prioritising investment.
documents, which were prepared to assist
The statement combined qualitative and
with the development of water quality grant
semi-quantitative assessments to estimate
applications. The priorities identified as key
the relative risk of water quality constituents
investment areas and room for improvement
to Great Barrier Reef ecosystem health from
were used when developing, assessing and
major sources in the catchments, focusing on
approving grant applications. This has resulted
agricultural land uses. The relevant conclusions
in a targeted approach where Australian
from the consensus statement follow. A summary
Government investments reflect the need for
of the relative risks and pollutant loads from
action to address the highest risk pollutants in
different regions is provided in Table 1 (page 16)
the highest risk areas.
and Figure 3 (page 17).
Investment Strategy 2013–2018 | Reef Water Quality Protection Plan | www.reefplan.qld.gov.au 12Relative risks between pollutants Seagrass loss severely impacts green turtle
and regions: and dugong populations. On a regional basis,
• Overall, nitrogen poses the greatest risk of the Burdekin and Fitzroy regions present
pollution to coral reefs from catchments the greatest risk to the Great Barrier Reef
between the Daintree and Burdekin Rivers. in terms of sediment loads.
Runoff from these rivers during extreme and • At smaller scales, particularly in coastal
early wet seasons is associated with outbreak seagrass habitats and freshwater and
cycles of the coral-eating crown-of-thorns estuarine wetlands, pesticides can pose
starfish on the northern Great Barrier a high risk. Concentrations of a range of
Reef shelf (15 to 17 degrees south) that pesticides exceed water quality guidelines
subsequently generate secondary outbreaks in many fresh and estuarine water bodies
throughout the central Great Barrier Reef. downstream of cropping lands. Based on a
Great Barrier Reef-wide loss of coral cover risk assessment of the six commonly used
due to crown-of-thorns starfish is estimated photosystem II inhibiting herbicides, the
to be 1.4 per cent per year over the past Mackay Whitsunday and Burdekin regions
25 years and a new outbreak is underway. It are considered to be at highest risk, followed
is estimated that crown-of-thorns starfish have by the Wet Tropics, Fitzroy and Burnett Mary
affected more than 1000 of the approximately regions. However, the risk of only a fraction
3000 reefs within the Great Barrier Reef over of pesticides has been assessed, with only
the past 60 years. six of the 34 pesticides currently detected
• Of equal importance is the risk to included in the assessment, and therefore the
seagrass from suspended sediments effect of pesticides is most likely to have been
discharged from rivers in excess of natural underestimated.
erosion rates, especially the fine fractions • The ranking of the relative risk of degraded
(clays). Whether carried in flood plumes, water quality between the regions in the
or re-suspended by waves, suspended Great Barrier Reef is (from highest risk
solids create a turbid water column that to lowest): 1. Wet Tropics 2. Fitzroy
reduces the light available to seagrass and 3. Burdekin 4. Mackay Whitsunday
corals. High turbidity affects approximately 5. Burnett Mary 6. Cape York.
200 inshore reefs and most seagrass areas.
Investment Strategy 2013–2018 | Reef Water Quality Protection Plan | www.reefplan.qld.gov.au 13Priority areas for managing • Importantly in the Mackay Whitsunday
degraded water quality in the region, 40 per cent of the seagrass area is
Great Barrier Reef are Wet Tropics in the highest relative risk class compared
for nitrogen management, Mackay to less than 10 per cent for all other regions.
Whitsunday and the lower Burdekin The highly valuable seagrass meadows
for photosystem II inhibiting in Hervey Bay, and the importance to
herbicide management, and associated dugong and turtle populations
Burdekin and Fitzroy for suspended in the Burnett Mary region, were not
sediment management. included in the ranking analysis, as they are
• From a combined assessment of relative outside the Great Barrier Reef Marine Park
risk of water quality variables in the Great boundaries.
Barrier Reef (using the total area of habitat • Both dissolved (inorganic and organic) and
affected in the areas identified to be of particulate forms of nutrients discharged into
highest relative risk) and end-of-catchment the Great Barrier Reef are important in driving
anthropogenic loads of nutrients, sediments ecological effects. Overall, increased nitrogen
and photosystem II inhibiting herbicides, the inputs are more important than phosphorus
regional ranking of water quality risk to coral inputs. Dissolved inorganic forms of nitrogen
reefs is (from highest risk to lowest): and phosphorus are considered to be of
1. Wet Tropics 2. Fitzroy 3. Mackay greater concern than dissolved organic and
Whitsunday 4. Burdekin 5. Cape York particulate forms as they are immediately
6. Burnett Mary. bioavailable for supporting algal growth.
• The regional ranking of water quality risk Particulate forms of nitrogen and phosphorus
to seagrass is (from highest risk to lowest): mostly become bioavailable, but over
1. Burdekin 2. Wet Tropics 3. Fitzroy longer time frames. Most dissolved organic
4. Mackay Whitsunday 5. Burnett Mary nitrogen typically has limited and delayed
6. Cape York. bioavailability.
Investment Strategy 2013–2018 | Reef Water Quality Protection Plan | www.reefplan.qld.gov.au 14Sources of pollutants • Most particulate nitrogen and phosphorus
• The Fitzroy and Burdekin regions contribute is lost or mineralised from fine sediment
at least 70 per cent to the modelled total following delivery to the Great Barrier Reef
suspended solids load to the Great Barrier lagoon and could be readily available for
Reef lagoon from human activity. Grazing uptake in marine ecosystems.
lands contribute over three quarters of this • The Wet Tropics, Burdekin and Mackay
load. The dominant sediment supply to Whitsunday regions contribute over
many rivers is from a combination of gully 85 per cent of the modelled total
and streambank erosion, and subsoil erosion photosystem II inhibiting herbicides load to
from hillslope rilling, rather than broadscale the Great Barrier Reef lagoon from human
hillslope sheetwash erosion. Fine sediment activity. Sugarcane contributes 94 per cent of
(less than 16 micrometres) material is the this load. Groundwater potentially may be an
fraction most likely to reach the Great important source of photosystem II inhibiting
Barrier Reef lagoon, and is present at high herbicides (as well as dissolved nutrients) to
proportions in monitored total suspended critical near-shore ecosystems of the Great
solids in the Burdekin, Fitzroy, Plane, Burnett, Barrier Reef lagoon; however, insufficient
and Normanby catchments. information is available to evaluate the risks.
• The Fitzroy, Burdekin and Wet Tropics regions • Compared to diffuse sources, most
contribute over 75 per cent to the modelled contributions to suspended sediment,
total nitrogen load to the Great Barrier Reef nutrient and pesticide loads from point
lagoon from human activity. Particulate sources such as intensive animal production,
nitrogen comprises by far the largest manufacturing and industrial processing,
proportion, followed by dissolved inorganic mining, rural and urban residences, waste
and dissolved organic nitrogen respectively. treatment and disposal, ports and shipping
Sediment erosion processes, particularly are relatively small but could be locally, and
in grazing lands, are sources of particulate over short-time periods, highly significant.
nitrogen; sugarcane, other cropping and Point sources are the major sources
grazing are sources of dissolved inorganic of pollutants such as metals, industrial
nitrogen; and land use changes in filter and chemicals and pharmaceuticals. Whilst point
buffer capacity are the main sources of sources are generally regulated activities,
dissolved organic nitrogen. monitoring may not include this broad range
• The Fitzroy and Burdekin regions contribute of chemicals, and monitoring and permit
approximately 55 per cent to the modelled information is not always available. In contrast
total phosphorus load to the Great Barrier to nutrients, sediments and pesticides, there
Reef lagoon from human activity. Particulate is a lack of knowledge of the risks posed
phosphorus comprises by far the largest by these chemicals to Great Barrier Reef
proportion, followed by dissolved inorganic ecosystems.
and dissolved organic phosphorus
respectively. Sediment erosion processes,
particularly in grazing lands, are sources of
particulate phosphorus; sources of dissolved
inorganic phosphorus and dissolved organic
phosphorus are unclear.
Investment Strategy 2013–2018 | Reef Water Quality Protection Plan | www.reefplan.qld.gov.au 15Table 1: Summary of the outcomes of the overall assessment of the relative risk of water quality in the Great Barrier Reef. Note that the Burnett Mary region is shaded
in grey to represent the fact that most reefs and seagrass in this region were not included formally in the analysis and thus the validity of the result has high uncertainty.
Source: Brodie et al., (2013a).
Regional
anthropogenic load
Dominant variables in Marine
as a proportion Relative Overall
marine assessment risk index Loads Management Associated
of the total Great Additional factors risk ranking of
Region
Variables where max Barrier Reef load index issues land uses
index relative risk
area is in region
Coral Sea
TSS DIN PSII
reef grass
Influence from
The data in this region are
Crown-of-thorns starfish catchment runoff is
Cape York 12 4 3Figure 3: Overall relative risk ranking
The relative risk of degraded water quality to the Great Barrier Reef among
the NRM regions, June 2013. The marine water quality variables are listed
adjacent to the region where they received the primary ranking.
Data sources—layers derived from:
Relative Risk Index: Brodie et al., 2013a
Reefs: GBRMPA, 2013. GBR Features shapefile.
Seagrass: Survey composite June 2010. Qld DAFF, Feb 2013.
Seagrass – Deepwater modelled, 50% probability. Qld DAFF, Feb 2013.
Investment Strategy 2013–2018 | Reef Water Quality Protection Plan | www.reefplan.qld.gov.au 17Multi-criteria analysis A regional MCAS-S spreadsheet was provided
to regional Natural Resource Management
Information from investments made by the
organisations to improve access to data
Australian Government from 2008 until 2013 and
generated through the Reef Plan Paddock
Reef Plan water quality monitoring, modelling
to Reef Integrated Monitoring, Modelling and
and research provide an opportunity to sharpen
Reporting Program and, in addition to other
the focus of future investment in practice change
information, this will assist their prioritisation
by estimating the:
processes. This sets the scene for more detailed
• relative contribution of each of the 35 major assessments by regional Natural Resource
sub-catchments to pollutant loads Management organisations at a sub-catchment
flowing to the Reef lagoon level, where local data is available.
• relative contribution of agricultural industries
in each sub-catchment to pollutant Prioritisation of coastal
loads generated repair works
• room for improvement in agricultural Between 2010 and 2013, the Australian
industries’ nutrient, pesticide and sediment and Queensland governments developed a
management practices methodology to understand the pressures on
• management practices expected to deliver and changes to coastal ecosystems and their
the biggest load reductions for sub- role in improving the water quality and ecosystem
catchments. health of the Great Barrier Reef.
The Multi-Criteria Analysis Shell for Spatial This project provided a framework to assess
Decision Support (MCAS-S) approach the status of coastal ecosystems and risks
(see www.daff.gov.au/abares/data/mcass) has from future development pressures or changes
been used to draw together the lines of evidence in land use (http://elibrary.gbrmpa.gov.au/
from water quality monitoring, modelling, jspui/handle/11017/828), as well as tools
research and management practice change in a to prioritise the protection, rehabilitation or
way that enables input from Reef stakeholders function restoration of Great Barrier Reef coastal
and exploration of data inputs and potential ecosystems. One of the actions under Reef
solutions. Plan 2013 specifically focuses on using this
methodology and working with key stakeholders
The results of this analysis have helped to identify
to prioritise investment in repairing these coastal
the sub-catchments, industries and practices
ecosystems and their functions.
where investments are likely to deliver the biggest
improvements in water quality. A MCAS-S tool,
maps, data pack and report will help to focus
investment opportunities at the sub-catchment
level and deliver the greatest Great Barrier Reef
water quality improvements for the resources
available.
Investment Strategy 2013–2018 | Reef Water Quality Protection Plan | www.reefplan.qld.gov.au 18Investment risks
While co-investment across multiple partners
is critical to deal with such a complex issue in
a dynamic system, it also presents challenges
and risks. This includes the risk of duplication
and inefficiency as well as uncertainty about
long-term investment from multiple partners.
Reef Plan has strong governance arrangements
designed to help manage these risks, improve
coordination and identify opportunities to better
target investment to deliver the best possible
outcomes, while minimising administrative
burden. Continued emphasis in these areas
will be important. The Management Practices
Advisory Group has a key role in improving
the coordination and collaboration of Best
Management Practice programs and extension
at state, regional and catchment levels.
Investment Strategy 2013–2018 | Reef Water Quality Protection Plan | www.reefplan.qld.gov.au 19DPC3978
You can also read