SCIENCE ADVICE ON THE POTENTIAL OF INTRODUCING LIVE ORGANISMS BY THE AQUARIUM, WATER GARDEN, AND LIVE FOOD TRADES IN CANADA
←
→
Page content transcription
If your browser does not render page correctly, please read the page content below
Canadian Science Advisory Secretariat
National Capital Region                                        Science Advisory Report 2021/032

   SCIENCE ADVICE ON THE POTENTIAL OF INTRODUCING
   LIVE ORGANISMS BY THE AQUARIUM, WATER GARDEN,
           AND LIVE FOOD TRADES IN CANADA

Figure 1. Hot spots of households releasing aquarium organisms in Canada generated for different
sensitivity analysis scenarios.

  Context:
  This science advice was requested by provincial and territorial governments and Fisheries and Oceans
  Canada’s Aquatic Ecosystems sector through the Canadian Council of Fisheries and Aquaculture
  Minsters’ National Aquatic Invasive Species Committee. Previous Canadian Science Advisory
  Secretariat processes have evaluated the screening-level risk posed by species imported into Canada
  through live trades based on species import volume and estimates of species survival and
  establishment (Gantz et al. 2014, Mandrak et al. 2014, Schroeder et al. 2014). However, significant
  uncertainties remain about species pathways (i.e., supply chains) in Canada, including key entry points,

August 2021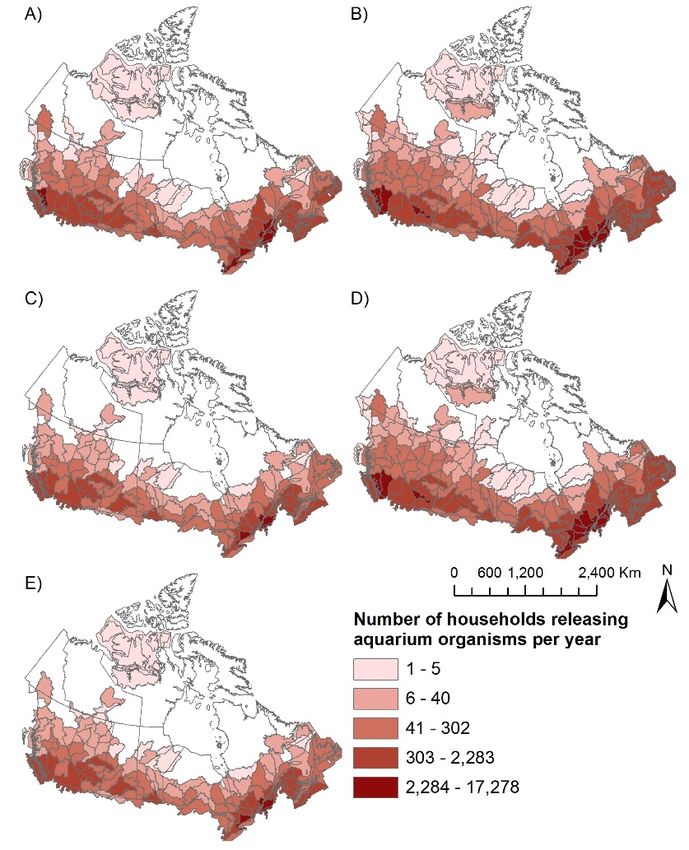
Science Advice on the Potential of Introducing Live
                                                  Organisms by the Aquarium, Water Garden, and
    National Capital Region                                          Live Food Trades in Canada
     distribution hubs, retailers, and consumers, as well as the movement and release behaviour of
     consumers (i.e., end-users) and the composition of imported species. Addressing these uncertainties
     would allow spatially-derived statistical estimates of species introduction effort (propagule pressure) to
     be developed for each pathway, which would help refine estimates of invasion risk. Information gained
     from this process will support management and policy at regional and national levels by: (i) developing
     a better understanding of key control points, (ii) informing future research priorities, (iii) informing
     monitoring programs, and (iv) guiding communication strategies for high-risk components.
     This Science Advisory Report is from the June 1-3, 2020 National Peer Review for Science Advice on
     the Potential risk of Introducing Live Organisms by the Aquarium, Water Garden, and Live Food Trades
     in Canada. Additional publications from this meeting will be posted on the Fisheries and Oceans
     Canada (DFO) Science Advisory Schedule as they become available.

SUMMARY
•     An analysis was conducted to determine the movement of live aquatic organisms
      (freshwater, marine, and estuarine fishes, invertebrates, and plants) into and within Canada
      through the aquarium, water garden, and live food trades, which involved identifying the
      number and spatial distribution of ports of entry, distributors, retailers, and end users.
•     Based on a four-month period in 2018, the greatest number of live organisms were imported
      via the live food trade (82 million), followed by the aquarium (4 million) and water garden (3
      million) trades. The movement of live organisms within Canada is documented from ports of
      entry to distributors, but not from distributors to retailers and end users.
•     Imported aquarium species included 585 fishes, 100 invertebrates, and 56 plants. A subset
      of these species (145 fishes, 3 invertebrates, and 52 plants) were assumed to be imported
      for water gardens. Thirty-two fish species and 54 invertebrate species were imported via the
      live food trade.
•     For the aquarium and water garden trades, the top three ports of entry were Windsor, ON;
      Mirabel, QC; and Calgary, AB. Organisms were distributed via major distribution hubs in
      Innisfil, ON; LaSalle, QC; and Calgary, AB. Despite differences between the pathways
      regarding estimated rural-versus-urban ownership, propagule pressure was highest around
      major urban centers as a function of human population density.
•     Major ports of entry for live food included Ottawa, ON; Richmond, BC; St-Stephen, NB; and
      Toronto, ON. Major distribution hubs were Montebello, QC; Chilliwack, BC; and Cap-Pelé,
      NB. Similar to the other two pathways, live food retailers and end users clustered around
      major cities.
•     Based on the estimated proportion of the Canadian population involved in each pathway,
      estimated release rates, and the estimated average number of organisms released per
      event, a baseline scenario predicted that ~347,650 (95% confidence interval (CI): 346,555–
      348,776), ~305,367 (95% CI: 304,307—306,479), and ~288,502 (95% CI: 287,457—
      289,563) organisms were released into the wild over a one-year period via the aquarium,
      water garden, and live food trade pathways, respectively. These predictions represent
      approximately 2.7%, 2.7%, and 0.1% chance of organisms imported through the aquarium,
      water garden, and live food trade pathways being released, respectively. Sensitivity
      analyses suggest these estimates vary with model parameters.
•     Depending on management objectives, major nodes in the distribution network may serve
      as critical control points. For example, high-traffic ports of entry along the international

                                                        2
Science Advice on the Potential of Introducing Live
                                               Organisms by the Aquarium, Water Garden, and
    National Capital Region                                       Live Food Trades in Canada

      border may provide the greatest opportunity for managing the highest number of organisms
      and species arriving to Canada.
•     Projected releases of organisms into the wild were not uniform across Canada. Statistically-
      significant hot spots of release activity were identified around major cities. Actions targeting
      end users near these locations could influence release behaviour to reduce propagule
      pressure.
•     Online sales, domestic production, and cultural or other forms of release behaviour by end
      users (e.g., vandalistic) were not considered, but could be important sources of organism
      release into the wild.
•     Several prominent uncertainties were identified. The accuracy and availability of import
      records data limited the ability to track organism arrival to Canada, intended uses,
      destinations, and species identities. The inability to track species from distributors to
      retailers and end users limited species-specific projections. Limited data exists to describe
      the amount and distribution of end users and their release behaviours, which may differ
      across Canada.

INTRODUCTION
The aquarium, water garden, and live food trades are major pathways for the introduction of
aquatic organisms (freshwater, marine, and estuarine fishes, invertebrates, and plants) into
Canada. While most organisms in trade remain in captivity or are consumed, there is increasing
evidence that imported species that are released may become invasive, incurring negative
consequences for Canada’s biodiversity, economy, and society. There are opportunities at each
point in the organism-in-trade supply chain (i.e., distributors, retailers, and end users) for
organisms to escape captivity to the environment via accidental or intentional introductions.
Through the federal-provincial-territorial Canadian Council of Fisheries and Aquaculture
Ministers’ National Aquatic Invasive Species Committee (NAISC), the provincial and territorial
governments and Fisheries and Oceans Canada’s Aquatic Ecosystems sector requested
scientific advice about the risk of introducing live organisms through the aquarium, water
garden, and live seafood pathways in Canada. Previous Canadian Science Advisory Secretariat
(CSAS) processes have evaluated the screening-level risk posed by species imported to
Canada through live trades based on species import volume and estimates of species survival
and establishment (Gantz et al. 2014, Mandrak et al. 2014, Schroeder et al. 2014). However,
significant uncertainties remain about: 1) the scope and scale of these pathways (i.e., species
supply chains) in Canada, including key ports of entry, distribution hubs, retailers, and end
users; 2) the movement and release behaviour of end users; and 3) the composition of species
associated with each pathway. Addressing these uncertainties would allow spatially-explicit
estimates of species introduction effort (propagule pressure) to be developed for each pathway,
which would help to refine current estimates of invasion risk. Characterizing these components
will help to inform management and policy by developing a better understanding of key control
points, informing research priorities and monitoring programs, and guiding communication
strategies for high-risk components (e.g., education and outreach campaigns).
The overarching objective of this work was to assess the pathway-level risk of introducing live
organisms by the aquarium, water garden, and seafood pathways in Canada. Specific
objectives included:

                                                   3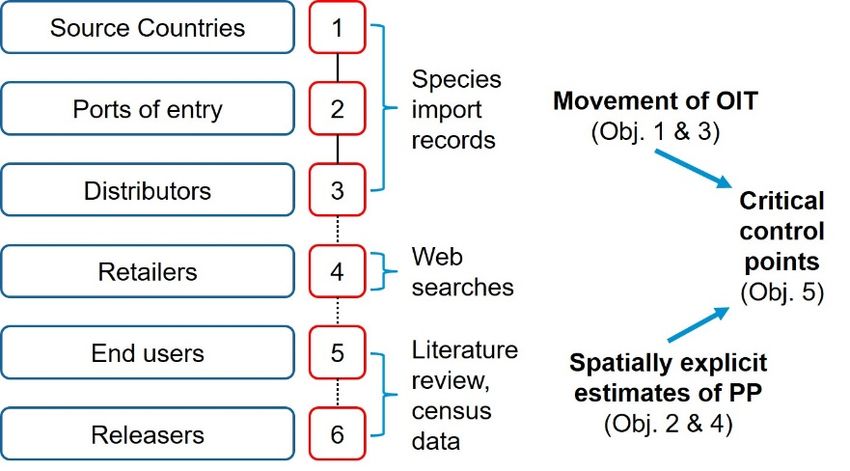
Science Advice on the Potential of Introducing Live
                                             Organisms by the Aquarium, Water Garden, and
 National Capital Region                                        Live Food Trades in Canada

1. Characterizing the movement of aquatic organisms in trade into and within Canada,
   including components such as the number and spatial distribution of species entry points,
   distributor hubs, retailers, and end users (i.e., pet and water garden owners; live seafood
   consumers);
2. Describing Canadian participation and release rates of end users per pathway;
3. Based on available data, identifying aquatic organisms documented in trade in Canada;
4. Developing spatially-explicit estimates of propagule pressure per pathway, including a
   description of key uncertainties; and
5. Identifying critical control points.

Scope
This work focused on the arrival stage of the invasion process stemming from the aquarium,
water garden, and live food pathways. Subsequent stages of the invasion process, such as
survival, establishment, or ecological consequences of imported species were not considered.
This work defined propagule pressure (PP) as the total number of individuals of all species
released via each of the aquarium, water garden, and live seafood pathways in Canada. Thus,
introduction potential was evaluated based on the total propagule pressure associated with
each pathway (i.e., the probability of introducing n organisms per pathway per year; see Drake
et al. 2015a). Although beyond the scope of this assessment, it is worth mentioning that the
individual fish, invertebrate, and plant species associated with the three pathways likely pose
different levels of risk spatially and temporally across Canada. Colonization pressure (i.e.,
diversity of imported species) was beyond the scope of this pathway-level analysis, as were
online sales (e-commerce) and species that are bred, cultivated, or farmed in Canada (i.e.,
domestic production and distribution). Organisms imported for public aquariums and zoos,
scientific research, and environmental testing were also excluded, given the low chance that
they would be released. The purchase and release of organisms in trade beyond their intended
use (e.g., illegal stocking, vandalistic intentions, cultural or mercy release) was not considered,
nor was the accidental release or escape of organisms (e.g., flooding events for water gardens).

                                                 4
Science Advice on the Potential of Introducing Live
Organisms by the Aquarium, Water Garden, and
National Capital Region Live Food Trades in Canada
ANALYSIS
Figure 2. Data analysis framework that follows a typical supply chain of organisms in trade to characterize
the movement of organisms in trade into and within Canada.
An analytical framework was developed and applied to each pathway to delineate the typical
supply chain of organisms in trade. First, species import records were used to track the
movement of imported live aquatic organisms from source countries to ports of entry and
distributors. Records were obtained from the Canada Border Services Agency (CBSA) and the
Canadian Food Inspection Agency (CFIA). The CFIA dataset had better temporal coverage
(recording an annual average of 13,318,572 (± 8,843,262 standard error) aquarium fish
imported into Canada between 2008 and 2018), but the CBSA Pathfinder dataset provided
greater detail. The higher resolution of the Pathfinder dataset was required to quantify the
number of organisms imported into Canada via each specific trade pathway and characterize
their subsequent movement within the country. Therefore, the analysis was conducted
principally using the CBSA dataset. Import records of aquarium fishes were ground-truthed
using the CFIA dataset after scaling the CBSA dataset to a 12-month period, confirming that the
CBSA dataset captured ~97% of annual aquarium fish imports.
In total, 9,432 import records over the four-month study period were relevant to the aquarium,
water garden, and live food trades. However, 1,223 records with missing import details were
excluded from further analysis. Only live aquatic organisms were considered in this study; as
such, only records in which the description of goods clearly indicated that the specimens were
alive or potentially alive at the time of import were included. Further, there were 599 inconsistent
import records, which were corrected and included in the analysis.
The remaining 8,192 records were separated by pathway based on information provided at time
of import. Country of origin, CBSA release office, and destination information were used to
identify the source countries, ports of entry, and distributors, respectively, associated with each
record. Import quantity information was used to estimate the number of aquatic organisms
associated with each pathway. Import quantities listed by weight were converted to number of
individuals using species-specific density or biomass estimates from peer-reviewed literature,
typical market weights advertised online by retail outlets, length-weight relationships available
from FishBase, or average density across species belonging to the same taxonomic group.
Retailer information was collected by conducting web searches. There were at least 1,163 and
1,284 retailers selling live fishes, invertebrates, and plants for aquaria and water gardens,
respectively, and 2,341 retailers selling live freshwater, marine, or estuarine food in Canada.
5Science Advice on the Potential of Introducing Live
Organisms by the Aquarium, Water Garden, and
National Capital Region Live Food Trades in Canada
Finally, a literature review was conducted to quantify the proportion of Canadians owning
aquaria or water gardens or purchasing live food (i.e., participation rate), and the proportion of
aquarium or garden owners or live food consumers who released organisms into the
environment (i.e., release rate). The participation and release rates were then applied to census
data to estimate the number and spatial distribution of end users and releasers.
Using this information, a model was developed to quantify spatially-explicit estimates of the
number of organisms introduced (i.e., propagule pressure) for the three trade pathways. The
model was parameterized using literature values, including estimates of the proportion of
owners in urban versus rural (U:R) areas. It was assumed that U:R ratios were constant across
Canada in the absence of evidence to suggest otherwise. The number and spatial distribution of
aquarium or water garden owners, live food purchasers, and organism releasers were estimated
and combined with the potential number of propagules released per event to estimate the total
number of organisms released per year per pathway.
To map the spatial distribution of households for the aquarium and water garden trades or
individuals for the live food trade releasing organisms, the expected number of households or
individuals in each 50 km x 50 km grid was multiplied by the estimated proportion of releasers.
The number of households or individuals releasing organisms was also summarized at the
watershed level, which assumed that releasers do not travel beyond the watershed in which
they reside to release organisms into the wild. Statistically significant hot spots where releasers
aggregate were identified.
To obtain a coarse estimate of the proportion of organisms imported into Canada that can be
expected to be released annually into the environment via each pathway, the baseline mean
number of organisms released per year per pathway was compared with the reported total
number of organisms imported into Canada per pathway scaled to a 12-month period.
Aquarium Trade
A total of 4,296,188 aquarium organisms, representing 844 taxa, were imported into Canada
from 40 source countries during a four-month period in 2018.
Figure 3. Source countries from which aquarium organisms were imported into Canada between June 15,
2018 and October 15, 2018.
6Science Advice on the Potential of Introducing Live
Organisms by the Aquarium, Water Garden, and
National Capital Region Live Food Trades in Canada
The American Pet Products Association (APPA) reported that 10.6% of households in the
United States owned aquaria in a 1994 national survey (cited by Chapman et al. 1997 and
Gertzen et al. 2008). More recent surveys by APPA suggested that the proportion is relatively
constant over time, though the absolute number of aquaria owners has increased due to
population increases (Insurance Information Institute 2020). The behaviour of U.S. and
Canadian aquarists were similar in terms of imports per capita and the identity of most
frequently traded species (Bradie et al. 2013), supporting the use of U.S. data for this analysis.
Therefore, 10.6% was adopted as the baseline participation rate because similar data does not
exist for Canada.
Data collected via Fisheries and Oceans Canada’s “Great Canadian Aquarium Survey” provided
the only estimate of the U:R distribution of aquarium ownership in Canada, although three-
quarters of the responses were from Ontario (Marson et al. 2009a). It was determined that
85.9% of surveyed aquarium owners resided in urban areas, whereas 14.1% lived rurally.
Because these proportions were similar to overall population density in urban and rural areas,
no urban-to-rural adjustment was made when applying the 10.6% ownership value across
Canada.
An interview survey conducted for aquarium owners in Montréal, Quebec revealed that 6.9% of
respondents had released at least one aquarium fish (Gertzen et al. 2008). In contrast, only
0.8% and 1.1% of aquarium owners indicated releasing plants and animals, respectively, in
Fisheries and Oceans Canada’s “Great Canadian Aquarium Survey” (Marson et al. 2009a). As
such, the median of the reported proportion of aquarium owners that were releasers (3.9%) was
selected as the baseline release rate.
Gertzen et al. (2008) reported that aquarium owners on average owned five fish and that
releasers on average released 5.1% of aquarium fish owned, suggesting that the typical
propagule size per release event is small. Therefore, it was assumed that the probability
distribution of propagule size follows a right-skewed, zero-truncated Poisson distribution (λ = 6).
Based on these parameters, an estimated 1,491,256 households own aquaria in Canada. A
baseline scenario assuming a 10.6% participation rate and a 3.9% release rate estimated that
57,799 households across Canada release 347,650 aquarium organisms (95% CI: 346,555–
348,776) into the wild per year.
7Science Advice on the Potential of Introducing Live
Organisms by the Aquarium, Water Garden, and
National Capital Region Live Food Trades in Canada
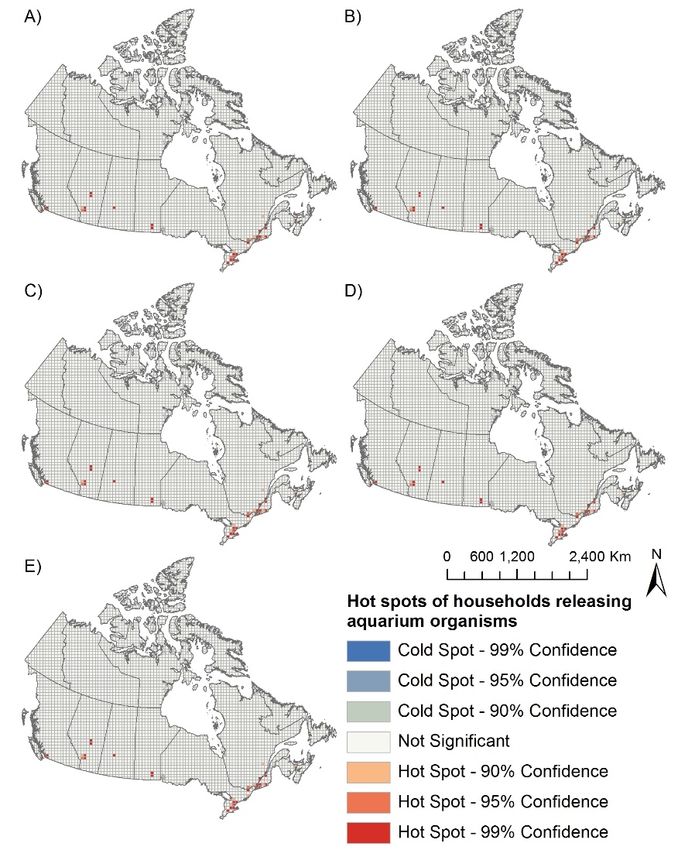
Figure 4. The expected numbers and spatial distributions of households releasing aquarium organisms
per year in Canada at the watershed level generated through sensitivity analysis.
Water Garden Trade
During the same four-month timeframe, 3,758,224 water garden organisms, representing 199
taxa, were imported into Canada from 19 source countries. All but two freshwater and/or
terrestrial plants were assigned to both the aquarium and water garden pathways (i.e., double
counted) because of the difficulty of identifying species endpoints.
The expected number of water garden owners in Canada was determined from a National
Gardening Association survey, which found that the proportion of households owning water
gardens in the U.S. increased from 3.9% in 1998 to 14.4% in 2003 (Gordon et al. 2012 citing
Crosson 2003). Given statistics were not available for Canada, the median of the 1998 and
2003 values (9.2%) was adopted as the baseline participation rate because water garden
ownership is likely lower in Canada owing to colder climates.
Recognizing that water gardening is mostly an outdoor activity and is constrained by climate,
the potential geographic extent of water garden ownership was limited to Agriculture and Agri-
Food Canada’s Plant Hardiness Zones (PHZs, Government of Canada 2019) where common
water garden plants were reported to survive (Marson et al. 2009b).
Data collected via Fisheries and Oceans Canada’s “Great Canadian Water Garden Survey”
were used to estimate the U:R distribution of water garden ownership, although ~95% of
8Science Advice on the Potential of Introducing Live
Organisms by the Aquarium, Water Garden, and
National Capital Region Live Food Trades in Canada
responses were from Ontario (Marson et al. 2009b). It was determined that 74.4% and 25.6% of
surveyed water garden owners resided in urban and rural areas, respectively. This was slightly
biased towards rural areas relative to overall population density, likely due to more available
space for water gardening in rural areas. The “Great Canadian Water Garden Survey” also
reported that 1.3% and 2.8% of water garden owners indicated that they released plants and
animals, respectively. To account for underreporting by survey respondents, the proportion of
releasers from the aquarium pathway (3.9%) was used to estimate the proportion of water
garden releasers.
No information regarding the typical propagule size of water garden organisms per event was
available. As such, it was assumed that the average number of water garden organisms
released per event is small and comparable with the aquarium pathway. Therefore, a right-
skewed, zero-truncated Poison distribution was used (λ = 6).
Based on these parameters, an estimated 1,301,154 households own water gardens in Canada.
An estimated 50,769 households release 305,367 (95% CI: 304,307—306,479) water garden
organisms per year, based on an assumed 9.3% participation rate and 3.9% release rate.
Live Food Trade
In total, 82,434,924 live marine, freshwater, and estuarine food organisms, representing 84
taxa, were imported into Canada from 20 source countries during the four-month study period.
A national survey conducted by Abacus Data revealed that 88.0% of Canadian respondents
consumed seafood over a three-month period (Coletto et al. 2011), and live food comprised
4.0% of products carried by identified retailers. These percentages were multiplied to estimate
the baseline participation rate (3.5%).
No information was available regarding the U:R distribution of live food purchasers. Instead, U:R
was determined based on the location of retailers that sell live food, assuming there is an
intrinsic spatial relationship between supply and demand. The estimated proportion of retailers
selling live food in urban and rural areas was 85.5% and 14.4%, respectively. Further, no
information was available regarding the proportion of the population purchasing live food who
release organisms. In the absence of pathway-specific data, values from the aquarium and
water garden pathways were used (3.9%). Finally, while studies examining the propagule size
of live food organisms released per event were not available, the findings of Gertzen et al.
(2008) for the release of aquarium organisms are likely applicable to live food releases. A right-
skewed, zero-truncated Poison distribution was used (λ = 6).
Based on these parameters, an estimated 1,237,160 individuals purchase live food organisms
in Canada each year. An estimated 47,964 purchasers release 288,502 (95% CI: 287,457—
289,563) live seafood organisms per year, based on an assumed 3.5% participation rate and
3.9% release rate.
Critical Control Points
Critical control points (i.e., nodes along the supply chain) that could allow the greatest number
of organisms to be encountered for management were identified by examining the assembled
trade distribution network with the estimated number and spatial distribution of end users and
releasers. For all three pathways, these included major ports of entry, key distribution hubs, and
urban centers where aggregations of retailers, end users, and releasers occur. Important control
points may differ depending on specific management objectives (e.g., optimizing surveillance
versus preventing releases).
9Science Advice on the Potential of Introducing Live
Organisms by the Aquarium, Water Garden, and
National Capital Region Live Food Trades in Canada
Sources of Uncertainty
Data
The trade distribution networks were constructed using four months of import records with some
inherent data quality issues. No attempt was made to evaluate the accuracy of import records in
terms of species identity or to confirm that organisms were alive at time of import. Further, end-
to-end traceability of organisms was not possible as transactions between distributors and
retailers and those between retailers and end users were not available. Finally, the compiled list
of retailers may not be complete; however, it includes major retailers across Canada and should
be representative of spatial patterns associated with the aquarium, water garden, and live food
trades in Canada.
Model
The model to generate spatially-explicit estimates of propagule pressure for each pathway was
parameterized using values derived from peer-reviewed publications and government reports.
While based on the best available information, values were not specific to Canada or may not
be up to date. Future studies to characterize spatially-explicit regional information on ownership
and release behaviour would determine the suitability of assumed values. As such, a sensitivity
analysis was conducted to account for uncertainty. For example, the baseline proportions of
Canadian households owning aquaria or water gardens or individuals purchasing live seafood
were increased and decreased by 50% in a one-parameter-at-a-time sensitivity analysis. This
provided a better understanding of how these values affected the number and distribution of
owners or purchasers across the country. The sensitivity of urban-versus-rural ratios were also
analyzed by altering their baselines by ±10%. Finally, the baseline average propagule size for
each pathway was increased and decreased by 50% to represent changes in the frequency
distribution of released propagules. Monte Carlo resampling processes were used to calculate
the number of organisms potentially released per year per pathway with a ±95% confidence
interval by drawing the estimated number of owners or purchasers releasing organisms from the
zero-truncated Poisson distribution for 1,000 iterations for each scenario.
Results of the sensitivity analysis suggested that all model parameters had an equal effect on
propagule pressure estimates for all pathways and did not affect the hot spot analysis, but that
they had a disproportionate effect on the end user and releaser spatial distribution across
Canada. For example, the presence of households owning aquaria in northern communities
may be an artefact of the way human population density was estimated. The human population
and dwelling data obtained from Statistics Canada (Statistics Canada 2019c) likely contained
errors (e.g., non-response and processing errors) and discrepancies between Statistics Canada
and Canada Post geographic boundaries may have affected the accuracy of population density
estimates. Also, it was assumed that individuals and households were evenly distributed within
an area when standardizing the spatial unit at the 50 km x 50 km grid size. This may not always
be the case, but the basis to estimate densities otherwise was not available.
CONCLUSIONS
Source Countries
The United States was the leading source country for organisms imported for the aquarium
trade, followed by Indonesia and Sri Lanka. Similarly, the U.S. was the leading source country
for aquatic organisms imported via the water garden trade, followed by Thailand and Germany.
Some interprovincial movement of aquarium and water garden organisms was documented.
10Science Advice on the Potential of Introducing Live
Organisms by the Aquarium, Water Garden, and
National Capital Region Live Food Trades in Canada
Lastly, the U.S. was the leading source country for aquatic organisms imported via the live
freshwater, marine, and estuarine food trade, followed by Ireland and New Zealand. Once
imported into Canada, live food organisms were often moved beyond the port of entry: six of the
20 ports of entry were involved in inter-provincial movement of live food organisms.
It is important to note that the source countries identified may not represent the actual
biogeographic origin or native range of the imported organisms.
Ports of Entry
The top three ports of entry for the aquarium and water garden trades by volume were Windsor,
ON; Mirabel, QC; and Calgary, AB. Calgary received imports from the greatest number of
source countries (26) for aquarium organisms. Meanwhile, Edmonton, AB processed water
garden organisms originating from the greatest number of source countries (11), despite not
being in the top three. Major ports of entry for live food organisms included Ottawa, ON;
Richmond, BC; St-Stephen, NB; and Toronto, ON. Toronto, ON received live freshwater,
marine, and estuarine food organisms from the greatest number of source countries (13).
Distribution Hubs
Innisfil, ON; LaSalle, QC; and Calgary, AB were the top three distribution hubs receiving the
greatest number of imported aquarium and water garden organisms. Montebello, QC;
Chilliwack, BC; and Cap-Pelé, NB were major distribution hubs for live food organisms. There
were more live food distribution hubs than aquarium and water garden hubs, and the greatest
density was located in the Maritimes.
Retailers
Aquarium and water garden retailers generally aggregated around major cities, such as
Richmond, BC; Calgary, AB; Edmonton, AB; Winnipeg, MB; Toronto, ON; Montréal, QC;
Moncton, NB; and Halifax, NS. Retailers of live food also aggregated around these locations, as
well as Saskatoon, SK; Regina, SK; London, ON; Hamilton, ON; and Ottawa, ON.
Release
Results of the hot spot analysis for the aquarium pathway indicated that major cities where
releasers aggregated included Victoria, BC; cities in the Greater Vancouver Area, BC; Calgary,
AB; Edmonton, AB; Saskatoon, SK; Winnipeg, MB; Windsor, ON; London, ON; Kitchener-
Waterloo-Cambridge, ON; Hamilton, ON; St. Catharines, ON; cities in the Greater Toronto Area,
ON; Barrie, ON; Kingston, ON; Ottawa-Gatineau, ON; cities in the Greater Montréal Area, QC;
Sherbrooke, QC; Trois-Rivières, QC; Québec City, QC; Saguenay, QC; Moncton, NB; and
Halifax, NS. The same hot spots were identified for the live food pathway, excluding Ottawa,
ON; Saguenay, QC; and Moncton, NB. Results of the hot spot analysis for the water garden
trade indicated that major cities where households releasing water garden organisms
aggregated included Victoria, BC; Vancouver, BC; Calgary, AB; Edmonton, AB; Winnipeg, MB;
London, ON; Kitchener-Waterloo-Cambridge, ON; Hamilton, ON; St. Catharines, ON; cities in
the Greater Toronto Area, ON; Ottawa, ON; cities in the Greater Montréal Area, QC;
Sherbrooke, QC; Québec City, QC; and Halifax, NS. Collectively, this suggests that the greatest
potential risk of introduction is associated with urban watersheds.
Based on the estimated number of organisms released per year, the aquarium pathway appears
to pose the greatest introduction potential, followed by the water garden and live food pathways.
11Science Advice on the Potential of Introducing Live
Organisms by the Aquarium, Water Garden, and
National Capital Region Live Food Trades in Canada
Overall, relatively small proportions of imported aquarium, water garden, and live food
organisms are expected to be released. Import records scaled to a 12-month period
(12,915,414 aquarium organisms and 11,301,522 water garden organisms) suggested that
2.7% of aquarium and water garden organisms imported into Canada are expected to be
released by end users annually. Meanwhile, live food import records scaled to a 12-month
period (247,304,772 organisms) suggested that 0.1% of imports were expected to be released
by purchasers. From a biological standpoint, the incorporation of additional stages of the
invasion process (e.g., survival, establishment, and spread) and the magnitude of ecological
impacts is needed to understand the overall invasion risk of each pathway.
OTHER ADVICE
Improving and maintaining detailed import records would reduce uncertainty and refine spatially-
explicit estimates of propagule pressure for all pathways. A significant proportion of import
transactions were paper-based, while many others were missing key details or mislabeled. The
proportion of transactions with missing import details was likely greater for invertebrates and
plants than for fishes. A more robust categorization system for imports with greater detail would
improve upon these shortcomings (e.g., Taxonomic Serial Number, destination, intended use,
distinguish between live and dead specimens).
It is crucial to gain a better understanding of end users’ motivations for release so that risk
reduction strategies can be developed. Engaging social scientists to characterize the social
dimensions of the aquarium, water garden, and live food trades, similar to work done for
recreational boating and fishing (Drake et al. 2015b, Hunt et al. 2017, 2019), would address
knowledge gaps. Areas to investigate include the rationale for releasing organisms (especially
for live food species), typical propagule size, distance travelled for release, frequency or
seasonality of release, and awareness of AIS issues at various spatial and temporal scales.
LIST OF MEETING PARTICIPANTS
Name Affiliation
Fisheries and Oceans Canada, Ontario and
Christine Boston
Prairie Region
Johanna Bradie University of Windsor
Fisheries and Oceans Canada, Ontario and
Tessa Brinklow
Prairie Region
Government of Ontario, Ministry of Natural
Jeff Brinsmead
Resources and Forestry
Fisheries and Oceans Canada, Ontario and
Oscar Casas-Monroy
Prairie Region
Fisheries and Oceans Canada, Ontario and
Farrah Chan
Prairie Region
Chantal Coomber Fisheries and Oceans Canada, Gulf Region
Fisheries and Oceans Canada, Maritimes
Claudio DiBacco
Region
Fisheries and Oceans Canada, Ontario and
Andrew Drake
Prairie Region
Fisheries and Oceans Canada, National
Sophie Foster
Capital Region
12Science Advice on the Potential of Introducing Live
Organisms by the Aquarium, Water Garden, and
National Capital Region Live Food Trades in Canada
Name Affiliation
Fisheries and Oceans Canada, Quebec
Jaclyn Hill
Region
Jeffery Eugene Hill University of Florida
Government of Ontario, Ministry of Natural
Len Hunt
Resources and Forestry
Government of Alberta, Ministry of
Nicole Kimmel
Environment and Parks
Fisheries and Oceans Canada, Ontario and
Marten Koops
Prairie Region
Fisheries and Oceans Canada, National
James Kristmanson
Capital Region
Mark Laflamme Fisheries and Oceans Canada, Gulf Region
Government of Nova Scotia, Department of
Jason LeBlanc
Fisheries and Aquaculture
Fisheries and Oceans Canada, National
Stephanie Sardelis
Capital Region
Fisheries and Oceans Canada,
Philip Sargent
Newfoundland and Labrador Region
Fisheries and Oceans Canada, Pacific
Thomas Therriault
Region
Fisheries and Oceans Canada, National
Guglielmo Tita
Capital Region
SOURCES OF INFORMATION
This Science Advisory Report is from the June 1-3, 2020 National Peer Review for Science
Advice on the Potential Risk of Introducing Live Organisms by the Aquarium, Water Garden,
and Live Food Trades in Canada. Additional publications from this meeting will be posted on the
Fisheries and Oceans Canada (DFO) Science Advisory Schedule as they become available.
Bradie, J., Chivers, C., and Leung, B. 2013. Importing risk: quantifying the propagule pressure-
establishment relationship at the pathway level. Divers. Distrib. 19(8): 1020–1030. doi:
10.1111/ddi.12081.
Chapman, F.A., Fitz-Coy, S.A., Thunberg, E.M., and Adams, C.M. 1997. United States of
America trade in ornamental fish. J. World Aquac. Soc. 28(1): 1–10. doi: 10.1111/j.1749-
7345.1997.tb00955.x.
Coletto, D., Di Francesco, L., and Morrison, J. 2011. Seafood Survey: Public Opinion on
Aquaculture and a National Aquaculture Act. Canadian Aquaculture Industry Alliance.
Abacus Data, Ottawa.
Drake, D.A.R., Mercader, R., Dobson, T., and Mandrak, N.E. 2015b. Can we predict risky
human behaviour involving invasive species? Biol. Invasions 17: 309–326. doi:
10.1007/s10530-014-0729-7.
Froese and Pauly 2020. FishBase. World Wide Web electronic publication.(12/2020)
13Science Advice on the Potential of Introducing Live
Organisms by the Aquarium, Water Garden, and
National Capital Region Live Food Trades in Canada
Gantz, C.A., Mandrak, N.E., and Keller, R.P. 2014. Application of an aquatic plant risk
assessment to non-indigenous freshwater plants in trade in Canada. DFO Can. Sci. Advis.
Sec. Res. Doc. 2013/096 v + 31 p.
Gertzen, E.L., Familiar, O., and Leung, B. 2008. Quantifying invasion pathways: fish
introductions from the aquarium trade. Can. J. Fish. Aquat. Sci. 65(7): 1265–1273. doi:
10.1139/F08-056.
Gordon, D.R., Gantz, C.A., Jerde, C.L., Chadderton, W.L., Keller, R.P., and Champion, P.D.
2012. Weed risk assessment for aquatic plants: modification of a New Zealand system for
the United States. PLoS One 7(7): e40031. doi: 10.1371/journal.pone.0040031.
Government of Canada. 2019. Plant Hardiness Zones [online]. [accessed 22 January 2020].
Hunt, L.M., Bannister, A.E., Drake, D.A.R., Fera, S.A., and Johnson, T.B. 2017. Do Fish Drive
Recreational Fishing License Sales? North Am. J. Fish. Manag. 37(1): 122–132. doi:
10.1080/02755947.2016.1245224.
Hunt, L.M., Morris, D.M., Drake, D.A.R., Buckley, J.D., and Johnson, T.B. 2019. Predicting
spatial patterns of recreational boating to understand potential impacts to fisheries and
aquatic ecosystems. Fish. Res. 211: 111–120. doi: 10.1016/j.fishres.2018.11.007.
Insurance Information Institute. 2020. Facts + Statistics: Pet statistics [online]. [accessed 11
July 2020].
Mandrak, N.E., Gantz, C.A., Jones, L.A., Marson, D., and Cudmore, B.C. 2014. Evaluation of
five freshwater fish screening-level risk assessment protocols and application to non-
indigenous organisms in trade in Canada. DFO Can. Sci. Advis. Sec. Res. Doc. 2013/122. v
+ 125 p.
Marson, D., Cudmore, B.C., Drake, D.A.R., and Mandrak, N.E. 2009a. Summary of a survey of
aquarium owners in Canada. Can. Manuscr. Rep. Fish. Aquat. Sci. 2905: iv + 20 p.
Marson, D., Cudmore, B.C., Drake, D.A.R., and Mandrak, N.E. 2009b. Summary of a survey of
water garden owners in Canada. Can. Manuscr. Rep. Fish. Aquat. Sci. 2906: v + 23 p.
Schroeder, B., Mandrak, N.E., and Cudmore, B.C. 2014. Application of a freshwater mollusc risk
assessment to non-indigenous organisms in trade in Canada. DFO Can. Sci. Advis. Sec.
Res. Doc. 2013/060. v + 26 p.
Statistics Canada. 2019c. Guide to the Census of Population, 2016. Chapter 10 – Data quality
assessment [online]. [accessed 01 February 2020].
14Science Advice on the Potential of Introducing Live
Organisms by the Aquarium, Water Garden, and
National Capital Region Live Food Trades in Canada
THIS REPORT IS AVAILABLE FROM THE:
Center for Science Advice (CSA)
National Capital Region
Fisheries and Oceans Canada
200 Kent Street
Ottawa, Ontario, K1A 0E6
Telephone: 613-990-0293
E-Mail: csas-sccs@dfo-mpo.gc.ca
Internet address: www.dfo-mpo.gc.ca/csas-sccs/
ISSN 1919-5087
ISBN 978-0-660-39786-3 Cat. No. Fs70-6/2021-032E-PDF
© Her Majesty the Queen in Right of Canada, 2021
Correct Citation for this Publication:
DFO. 2021. Science Advice on the Potential of Introducing Live Organisms by the Aquarium,
Water Garden, and Live Food Trades in Canada. DFO Can. Sci. Advis. Sec. Sci. Advis.
Rep. 2021/032.
Aussi disponible en français :
MPO. 2021. Avis scientifique sur le risque potentiel d’introduction d’organismes vivants lié au
commerce d’espèces destinées aux aquariums, aux jardins d’eau et au commerce
d’organismes vivants destinés à l'alimentation au canada. Secr. can. de consult. sci. du
MPO. Avis sci. 2021/032.
15You can also read