Temporal Overlap Among Feral Horses, Cattle, and Native Ungulates at Water Sources
←
→
Page content transcription
If your browser does not render page correctly, please read the page content below
The Journal of Wildlife Management 85(6):1084–1090; 2021; DOI: 10.1002/jwmg.21959

Special Section on Management of Feral Equids

Temporal Overlap Among Feral Horses,
Cattle, and Native Ungulates at Water
Sources
         JACOB D. HENNIG        ,1 University of Wyoming, 1000 E. University Avenue, Laramie, WY 82071, USA
         JEFFREY L. BECK      , University of Wyoming, 1000 E. University Avenue, Laramie, WY 82071, USA
         CALEB J. GRAY, University of Wyoming, 1000 E. University Avenue, Laramie, WY 82071, USA
         J. DEREK SCASTA, University of Wyoming, 1000 E. University Avenue, Laramie, WY 82071, USA

            ABSTRACT Feral horse (Equus ferus caballus) populations on public rangelands in the western United
            States threaten forage production for livestock and wildlife habitat. Interference competition between feral
            horses and heterospecifics at watering sources can have negative effects on livestock and wildlife.
            Researchers have documented altered timing and behavior of wild ungulates at water sources when horses
            were present. The few studies examining these interactions have infrequently occurred within areas
            specifically managed for feral equids and have not occurred in sites with cattle. We used motion‐sensitive
            cameras at 8 watering sources to document watering activity patterns and construct indices of temporal
            overlap among feral horses, cattle, elk (Cervus canadensis), mule deer (Odocoileus hemionus), and pronghorn
            (Antilocapra americana) within the Adobe Town Herd Management Area in southern Wyoming, USA,
            between June and September 2018 and 2019. Feral horses, cattle, and pronghorn exhibited a high degree of
            temporal overlap (>79%) in water use, with feral horses and pronghorn exhibiting the highest estimated
            percent overlap (88.1%, 95% CI = 86.5–89.6%). Mule deer and elk watering activity also overlapped with
            horses and cattle but to a lesser degree (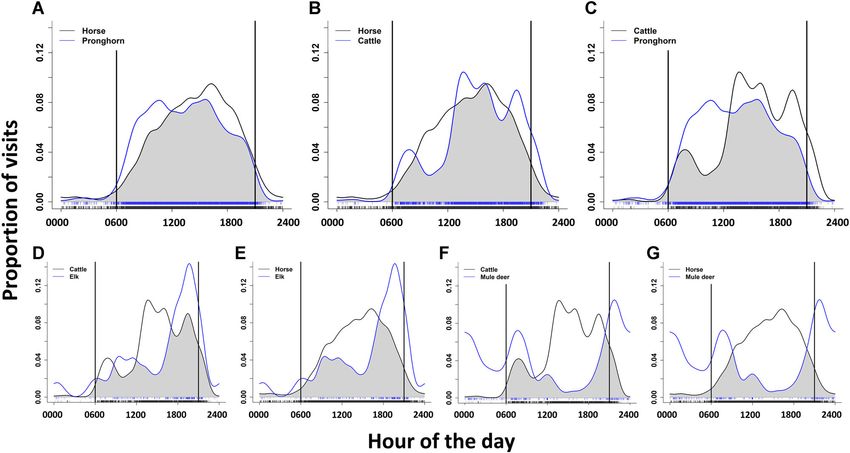
interference competition between feral horses and hetero-          duration of pronghorn and feral horses; and examine if
specifics (Perry et al. 2015, Hall et al. 2016, Gooch               pronghorn, feral horses, and cattle exhibited altered peak
et al. 2017). Competition between horses and heterospecifics        visitation times between sites with high versus low hetero-
is a management concern (M. D. Astle, BLM, personal                specific use. If interference competition at water sources was
communication), especially considering that horses may             present, we predicted longer visit duration times with in-
spend up to 75% of each day at water sources during periods        creased heterospecific group sizes, and significantly different
of increased water stress (Perry et al. 2015, Hall et al. 2016).   peak arrival times at water sources between sites with high
Researchers have documented agonistic behaviors of horses          versus low heterospecific use.
towards elk (Cervus canadensis; Perry et al. 2015), and in-
creased pronghorn vigilance (Antilocapra americana) when           STUDY AREA
horses are present at watering holes (Gooch et al. 2017).          We conducted our study within the Adobe Town Herd
Interference competition from horses has been correlated           Management Area (ATHMA) located in southern Wyoming
with shifts in temporal or spatial watering activity patterns of   (Fig. 1). The ATHMA encompasses 3,413 km2 and is clas-
smaller, sympatric species such as pronghorn, mule deer            sified as cold‐arid‐steppe (Kottek et al. 2006). Across the study
(Odocoileus hemionus), and bighorn sheep (Ovis canadensis;         area, 30‐year normal (1981–2010) mean summer (Jun–Sep)
Ostermann‐Kelm et al. 2008, Hall et al. 2018). Such com-           precipitation was 95.6 mm (range = 80.6–121.6 mm) and
petition can potentially lead to fitness consequences for less      mean temperature was 16.8°C (range = 15.7–17.3°C; PRISM
aggressive ungulate species, especially as horse populations       Climate Group 2004). Summer precipitation was below
continue to increase (Gooch et al. 2017).                          normal during the years of the study, with mean values of
  Despite the influence that feral horses may have on native        35.6 mm and 66.3 mm in 2018 and 2019, respectively
wildlife at watering sites, the number of studies assessing        (PRISM Climate Group 2004). Conversely, mean summer
their effects remains low. To date, no study has documented         temperatures were higher than normal, with mean values of
temporal watering patterns of ungulates within an area ex-         18.7°C and 17.5°C in 2018 and 2019, respectively (PRISM
plicitly managed for feral horses and cattle. Cattle grazing is    Climate Group 2004). Mean elevation was 2,080 m and
a common land use of many BLM Herd Management                      ranged from 1,883–2,506 m (USGS 2016). Dominant shrub
Areas (HMA), and thus investigation of water use in these          species included big sagebrush (Artemisia tridentata), grease-
areas is important. The addition of cattle to the landscape        wood (Sarcobatus vermiculatus), rubber (Ericameria nauseosa)
potentially modifies the degree of interspecific competition         and yellow (Chrysothamnus viscidiflorus) rabbitbrush, and salt-
because cattle also influence behavior and spatial dis-             bush species (Atriplex spp.). Perennial grass species included
tributions of smaller species (de Leeuw et al. 2001, Stewart       cool‐season bunchgrasses such as bottlebrush squirreltail
et al. 2002). Conversely, areas supporting cattle grazing may      (Elymus elymoides), prairie Junegrass (Koeleria macrantha), and
have better water distribution than comparative sites, which       Sandberg bluegrass (Poa secunda), along with warm‐season
could decrease the degree of interspecific competition that         grasses such as inland saltgrass (Distichlis spicata) and sandhill
native wildlife face.                                              muhly (Muhlenbergia pungens). The BLM set an Appropriate
  To our knowledge, no study has examined factors influ-            Management Level (AML) for the ATHMA ranging from
encing duration of water visits for co‐occurring introduced        610–800 horses; estimated herd size was within AML in 2018
and native species in the United States, but this information      but was 24% above AML in 2019 (BLM 2020). Our study
could be important in certain rangeland management sce-            area included 4 cattle grazing allotments, 2 of which allowed
narios. For example, in areas with high potential of inter-        grazing from May through November, 1 from March through
ference competition, limiting time spent at water by horses        June, and the other from April through June. Maximum al-
may benefit heterospecifics. On the other hand, if interfer-         lotted animal unit months (AUM) totaled 5,639 AUM. Our
ence competition is already occurring and causing native           study area also provided priority habitats for game species
ungulates to spend more time being vigilant at water sources       including elk, mule deer, pronghorn, and greater sage‐grouse
(Gooch et al. 2017), this may lead to longer visits at water       (Centrocercus urophasianus). Oil and natural gas extraction was
sources and consequently less time devoted to other activ-         a predominant use of portions of the ATHMA landscape.
ities such as foraging, leading to decreased fitness (Lima and
Dill 1990).                                                        METHODS
  To understand water activity patterns of ungulates and           We deployed motion‐sensitive cameras at watering sources
factors influencing visit duration in an area managed for           within the ATHMA to record images between June and
feral horses and cattle, we employed motion‐sensitive              September 2018 and 2019. We used camera (Stealth Cam
cameras at water sources within the BLM Adobe Town                 IR STC‐G30; Stealth Cam, Grand Prairie, TX, USA) units
Herd Management Area in south‐central Wyoming, USA.                that included a 24‐m flash range and 30 infrared emitters set
Our objectives were to describe daily activity water use           to collect single 4‐megapixel images with a 5‐second delay.
patterns of all ungulates present in summer within the             We placed cameras at randomly selected water sources
system, including feral horses, cattle, elk, mule deer, and        identified from a list provided by the Rawlins, Wyoming,
pronghorn; estimate percent temporal overlap between in-           BLM Field Office. This list provided a data set including
troduced and native species in daily water use patterns; as-       known and possible sources of water in the study site. We
sess biotic and temporal factors influencing watering visit         randomly selected sites from the list to place cameras. If a

Hennig et al. • Temporal Overlap at Water                                                                                       1085
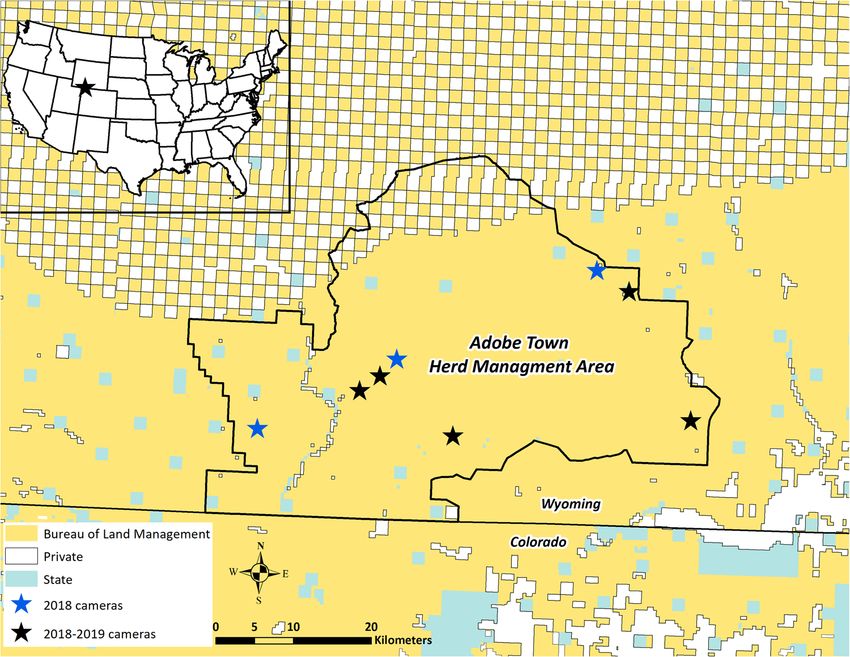
Figure 1. Location and land tenure of the Adobe Town Herd Management Area (ATHMA) in south‐central Wyoming, USA, and location of motion‐
sensitive cameras that recorded images from June through September 2018 and 2019.
selected site did not hold water upon our inspection, we Statistical Analysis
randomly selected another site to place the camera. We set To examine water visit duration, we calculated the
out 11 cameras in 2018, but only 8 provided sufficient data estimated time of each independent visit by subtracting the
(Fig. 1) and only 5 remained functional after the season timestamp of the first photo from the last photo during each
because of physical camera damage. In 2019, we randomly visit. We defined independent watering visits for each
selected a subset of camera locations from the 2018 sites to
place the remaining 5 working cameras. Water sources in-
cluded 4 reservoirs holding precipitation and run‐off,
2 reservoirs replenished by intermittent streams, and 2
spring‐fed reservoirs. Surface area of water sources ranged
from 0.03–3.4 ha. We mounted each camera to a steel fence
post and positioned them 3–12 m from the water edge and
40–80 cm above ground level. We oriented cameras to
capture the near entirety of the water source at small loca-
tions (1,650 m2; n = 4; Fig. 2B). We used
animal track density and observation of animal watering
behavior as indicators of water access points. Because data
collection did not involve handling or invasive observation
of animals, our research protocols described in this paper
were exempt from review by the University of Wyoming
Institutional Animal Care and Use Committee. We pro-
grammed cameras to trigger on both motion and heat,
following which they recorded images at 1‐minute intervals.
We chose 1‐minute intervals to maximize battery life and
camera storage capacity. We manually processed all images
to extract date and time stamps, temperature recordings,
and the number of individuals per species present in each
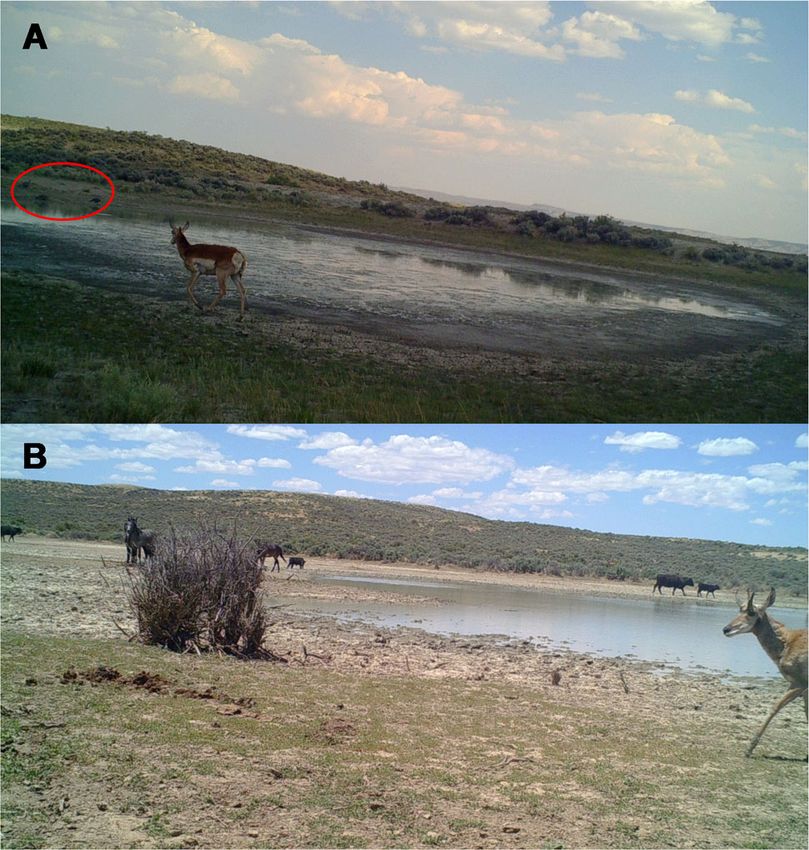
Figure 2. A) Pronghorn and greater sage‐grouse (located within red circle)
image. We included all images in our analyses unless the at a small‐classified water source and B) feral horses, cattle, and pronghorn
camera view was moved so that the water source was no at a large‐classified water source within the Adobe Town Herd
longer visible or when all water had evaporated from a site. Management Area, Wyoming, USA, June 2018.
1086 The Journal of Wildlife Management • 85(6)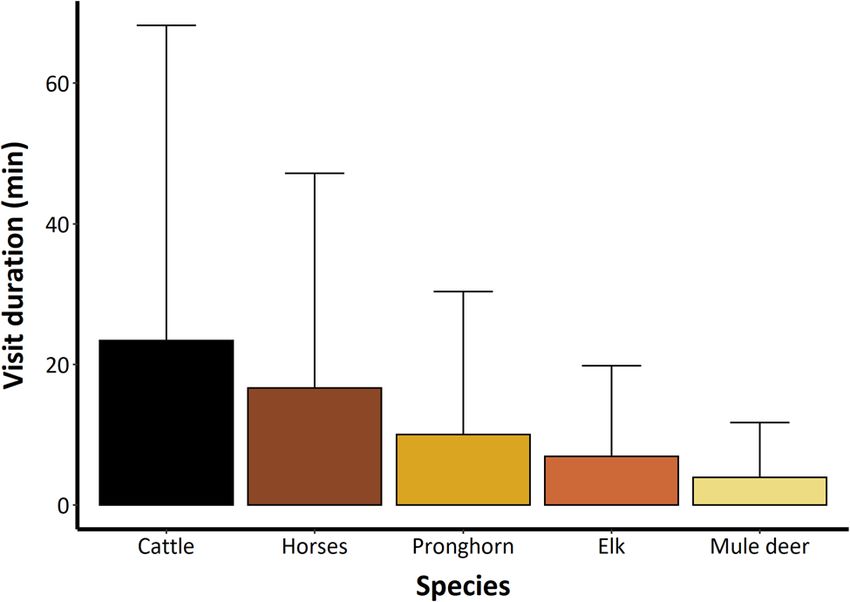
species as image sequences separated by ≥30 minutes              rank sum test to examine if the hour of peak water visitation
(Atwood et al. 2011; Hall et al. 2016, 2018). If only 1 photo    for a focal ungulate species differed between sites with rel-
was triggered during a visit, we estimated the visit to be       ative high horse (>3 visits/day; n = 5) versus low (40°C), and a general linear           temporal watering activity (88.1%, 95% CI = 86.5–89.6%;
model regressing temperature against the quadratic term          Fig. 4A), followed by horses and cattle (83.6%, 95%
of hour of the day was significant (P < 0.001). Biotic            CI = 81.7–85.5%; Fig. 4B), cattle and pronghorn (78.2%,
variables included the maximum number of pronghorn               95% CI = 76.0–80.4%; Fig. 4C), cattle and elk (68.4%, 95%
present during a visit, the maximum number of horses             CI = 63.1–73.5%; Fig. 4D), horses and elk (67.1%, 95%
present, and the maximum number of cattle present. We            CI = 61.8–72.2%; Fig. 4E), cattle and mule deer (43.2%,
included a random effect of camera location in each
model and no variables were strongly correlated
(i.e., r > 0.5). To compare relative importance of each
variable, we first centered and standardized each variable
(Schielzeth 2010), and then compared all possible vari-
able combinations with a maximum of 3 variables per
model. With only 8 water sources, we limited the number
of variables per model to avoid overparameterization
(Burnham and Anderson 2002). We ranked each model
using Akaike's Information Criterion corrected for small
sample sizes (AICc; Burnham and Anderson 2002) and
model‐averaged over the cumulative sum of 0.99 AICc
weight (wi) to report beta estimates and 85% confidence
intervals of informative variables (Arnold 2010).
  We calculated peak arrival time per species per watering
location by binning the 24‐hour day into 100 equal units
and counting the number of independent watering events
per unit. We classified the bin with the highest count as
                                                                 Figure 3. Mean time spent at a watering source (n = 8) per watering visit
peak arrival time. To examine evidence of a temporal shift       (with SD) per ungulate species within the Adobe Town Herd Management
in peak arrival time at watering sites, we used a Wilcoxon       Area, Wyoming, USA, June through September 2018 and 2019.

Hennig et al. • Temporal Overlap at Water                                                                                            1087
Figure 4. Overlap (shaded region) in temporal distribution of water use by A) feral horses and pronghorn, B) feral horses and cattle, C) cattle and
pronghorn, D) cattle and elk, E) horses and elk, F) cattle and mule deer, and G) horses and mule deer in the Adobe Town Herd Management Area,
Wyoming, USA, from June through September 2018 and 2019. Rug marks represent the number of independent watering visits per interval and the time
between the vertical lines indicates daylight hours. The top 3 frames (A–C) represent the pairwise comparisons with the greatest overlap.
95% CI = 39.0–47.6%; Fig. 4F), and horses and mule deer 85% CI = 0.052–0.173), and maximum cattle group size
(37.8%, 95% CI = 33.7–42.0%; Fig. 4G). (β = 0.091, 85% CI = 0.045–0.136). Pronghorn visit time
Of 1,494 independent pronghorn watering visits, 122 was predicted to be 8.7 minutes with 1 cow present and
(8.2%) included horses and 19 (1.3%) included cattle. Mean 10.0 minutes with 5 cattle present. Pronghorn visit time was
pronghorn group size during visits was 1.5 ± 1.2 (max. = predicted to be 9.1 minutes with 1 horse present and
15). When present during pronghorn visits, mean feral 12.9 minutes with 5 horses present.
horse group size was 3.6 ± 2.9 (max. = 17) and mean cattle Of 1,843 feral horse watering visits, 71 (3.9%) included
group size was 3.2 ± 3.5 (max. = 13). Five models ex- pronghorn, and 42 (2.3%) included cattle. Mean horse
plaining pronghorn water visit duration received >0 model group size during visits was 2.9 ± 2.6 (max. = 23). When
weight (Table 1). The strongest predictor of pronghorn visit present during feral horse visits, mean cattle group size was
duration was the number of conspecifics present (β = 0.696, 2.9 ± 2.3 (max. = 11) and mean pronghorn group size when
85% CI = 0.637–0.756). Other informative variables in- horses were present was 1.6 ± 1.1 (max. = 7). Five models
cluded a significant quadratic effect of hour of the day, with explaining feral horse water visit duration received >0
duration peaking at 1200, maximum horse group size model weight (Table 2). The amount of conspecifics present
(β = 0.112, 85% CI = 0.066–0.159), day of year (β = 0.112, was the strongest predictor of feral horse visit duration
Table 1. Top models explaining pronghorn water visit duration as a Table 2. Top models explaining feral horse water visit duration as a
function of temporal variables and maximum group size of ungulate species function of temporal variables and maximum group size of ungulate species
present within the Adobe Town Herd Management Area, Wyoming, present within the Adobe Town Herd Management Area, Wyoming,
USA, June through September 2018 and 2019. Columns represent the USA, from June through September 2018 and 2019. Columns represent
number of parameters (K ), Akaike's Information Criterion adjusted for the number of parameters (K ), Akaike's Information Criterion adjusted for
small samples sizes (AICc), difference between a given model and the small samples sizes (AICc), difference between a given model and the
top‐ranked model (ΔAICc), and model weight (wi). Only models with top‐ranked model (ΔAICc), and model weight (wi). Only models with
>0 model weight and the null model are shown. >0 model weight and the null model are shown.
Model K AICc ΔAICc wi Model K AICc ΔAICc wi
Pronghorn + horse + hour + hour 2
7 9,154.6 0.00 0.65 Horse + pronghorn + hour + hour 2
7 12,891.2 0.00 0.57
Pronghorn + cattle + hour + hour2 7 9,156.4 1.75 0.27 Horse + pronghorn + cattle 6 12,893.4 2.22 0.19
Pronghorn + horse + cattle 6 9,160.0 5.38 0.05 Horse + pronghorn 5 12,894.0 2.86 0.14
Pronghorn + day + hour + hour2 7 9,161.9 7.29 0.02 Horse + pronghorn + year 6 12,895.8 4.69 0.05
Pronghorn + horse + day 6 9,164.1 9.44 0.01 Horse + pronghorn + day 6 12,896.0 4.87 0.05
Null 3 9,579.3 424.72 0.00 Null 3 13,580.4 689.23 0.00
1088 The Journal of Wildlife Management • 85(6)(β = 0.733, 85% CI = 0.685–0.782), followed by the feral horses and cattle at water; however, the relatively short
maximum pronghorn group size (β = 0.167, 85% mean durations of horse and cattle water visits may render
CI = 0.127–0.206), a significant quadratic effect of hour of any competition insignificant.
the day, with duration peaking at 1200, and maximum cattle Though broad‐scale temporal overlap in watering activity
group size (β = 0.040, 85% CI = 0.003–0.077). Horse visit was high among pronghorn, cattle, and feral horses, we in-
duration was predicted to be 12.4 minutes with 1 pronghorn frequently observed these species together during the same
present and 24.2 minutes with 5 pronghorn present. Horse visit. Our low sample size and incomplete knowledge of
visit duration was predicted to be 10.6 minutes with 1 cow water sources within the study area limits our ability to dis-
present, and 11.0 minutes with 5 cattle present. cuss temporal partitioning of water visits, though this should
Results of Wilcoxon rank sum tests revealed no significant be investigated in future work. At the coarse scale of our
difference between peak arrival times for pronghorn at sites investigation, we did not find evidence of different peak
with high versus low horse use (W = 10.0, P = 0.686) or visitation time among areas with high and low introduced
cattle use (W = 8.0, P = 0.999). Similarly, horses exhibited ungulate use; however, temporal partitioning may be occur-
no difference in peak arrival time between sites with and ring at finer scales, with submissive species waiting until
without cattle use (W = 6.0, P = 0.786), and cattle exhibited dominant species have left a source. When species were
no difference in peak arrival time between sites with high together during a visit, the group size of heterospecifics was
versus low horse use (W = 4.0, P = 0.767). correlated with increased visit duration, though not in a
1‐sided manner that we predicted (i.e., with greater duration
DISCUSSION of pronghorn visits, but no effect on equid visits). This may
Horses spent less time at water sources within the ATHMA mean that all species face some level of interference
compared to other study areas in the western United States. competition when the total number of ungulates increases,
Perry et al. (2015) reported horses spent an average of regardless of species. Our results do not provide any evidence
13.6% of the day at their study seep with a maximum of of competition, but we stress that our small sample size may
75.5%. Hall et al. (2016) reported horses spending up to have limited our ability to detect competition.
73.0% of the day at water sources, rendering limited time In our study, sampled water sources were larger than the
for other species. The average and maximum observed majority of those from previous studies. Water sources in
percentages in our study are less than these values. This previous work included springs, seeps, guzzlers, troughs, or
suggests that although the ATHMA was classified as arid, overflow ponds (Perry et al. 2015; Hall et al. 2016, 2018;
water may have been less limiting compared to settings of Gooch et al. 2017). More specifically, Hall et al. (2016)
previous research. The BLM is mandated to manage for reported a mean area of 2.6 m2 at 23 water sources classified as
feral horses within the ATHMA and water installations are small, and 1,620 m2 at 2 larger overflow ponds. Perry et al.
one of the few management tools available to the agency. In (2015) reported a diameter of 15 cm at their study seep during
the ATHMA, excavated reservoirs holding precipitation dry spells. The median size of water sources in our study was
and run‐off were constructed to spread out distribution of 1,300 m2, and all our larger‐classified sites (>1,650 m2; n = 4)
feral horses, whereas groundwater, stream, or spring‐fed were greater than the mean of the overflow ponds in Hall et al.
reservoirs were installed for improving water availability for (2016). Smaller surface area water sources ostensibly provide
livestock and native wildlife (M. D. Astle, personal com- limited areas of water access compared to larger sites, thus
munication). These water developments augmented the few potentially leading to closer distances between individuals and
springs and intermittent streams naturally found in the elevated competition for drinking space (Hall et al. 2016).
study area and likely increased water availability compared Indeed, distance from horses is an important variable
to settings of previous research. influencing pronghorn behavior (Gooch et al. 2017). With
All ungulates inhabiting this system exhibited some degree comparatively larger water body sizes, perhaps it is not
of temporal overlap in daily watering patterns. Percent surprising that we did not find evidence of interference
overlap was greatest between feral horses, cattle, and competition in our study.
pronghorn, an expected result given the natural history of Given the limitations of this study (e.g., limited sample
each species and findings of previous research (Hall size, incomplete knowledge of water sources, and the de-
et al. 2018). These 3 species visited water sources predom- creased ability of cameras to capture nocturnal animal visits),
inantly during diurnal hours compared to mule deer and elk, our results may not fully represent ungulate watering activity
which visited water more frequently during crepuscular and within the entirety of the study area. Nevertheless, the ob-
nocturnal periods. Motion‐sensitive cameras may have re- served temporal overlap in watering activity, especially among
duced the capability of capturing animals at night, limiting feral horses, cattle, and pronghorn indicate that interference
our inference regarding heterospecific overlap at night. competition is a potential issue in the ATHMA. As feral
Further, we had a low sample effort and incomplete horse populations continue to increase (Scasta et al. 2018)
knowledge of all water locations, so estimated overlap and as future water availability in the western United States is
among all species may not be indicative of the entire study projected to decrease because of climate and anthropogenic
area. From the observed degree of overlap, we conclude that changes (Barnett et al. 2008, Cook et al. 2015), an under-
pronghorn may be the most susceptible of native ungulates standing of the fitness consequences from interference com-
within this system to interference competition from both petition at water sources will be important. Further, cattle
Hennig et al. • Temporal Overlap at Water 1089grazing is a common land use practice on BLM and USFS Cook, B. I., T. R. Ault, and J. E. Smerdon. 2015. Unprecedented 21st
lands, and we need more insight into how horses, cattle, and century drought risk in the American Southwest and Central Plains.
Science Advances 1:e1400082.
native wildlife interact at these essential but limited resources. Davies, K. W., G. Collins, and C. S. Boyd. 2014. Effects of feral free‐
We encourage further research focused on the behavior of roaming horses on semi‐arid rangeland ecosystems: an example from the
ungulates at water sources to determine if interference sagebrush steppe. Ecosphere 5(10):article 127.
competition is present (i.e., displacement or increased vigi- de Leeuw, J., M. N. Waweru, O. O. Okello, M. Maloba, P. Nguru, M. Y.
Said, H. M. Aligula, I. M. A. Heitkönig, and R. S. Reid. 2001.
lance of submissive species) and the assessment of fitness Distribution and diversity of wildlife in northern Kenya in relation to
consequences resulting from competition. livestock and permanent water points. Biological Conservation
100:297–306.
MANAGEMENT IMPLICATIONS Gooch, A. M. J., S. L. Petersen, G. H. Collins, T. S. Smith, B. R.
McMillan, and D. L. Eggett. 2017. The impact of feral horses on
Our results on temporal overlap suggest there is potential pronghorn behavior at water sources. Journal of Arid Environments
for interference competition between co‐occurring feral 138:38–43.
horses, cattle, and pronghorn at watering sites on western Hall, L. K., R. T. Larsen, R. N. Knight, and B. R. McMillan. 2018. Feral
rangelands. To better comprehend the significance of in- horses influence both spatial and temporal patterns of water use by native
ungulates in a semi‐arid environment. Ecosphere 9(1):e02096.
terference competition, future studies should examine be- Hall, L. K., R. T. Larsen, M. D. Westover, C. C. Day, R. N. Knight, and
havioral changes and ideally fitness consequences incurred B. R. McMillan. 2016. Influence of exotic horses on the use of water by
by all species across sites with varying water distribution and communities of native wildlife in a semi‐arid environment. Journal of
Arid Environments 127:100–105.
population levels of introduced ungulates. This information
Kottek, M., J. Greiser, C. Beck, B. Rudolf, and F. Rubel. 2006.
will aid in identifying specific management actions to lessen World map of the Koppen‐Geiger climate classification updated.
the potential deleterious effects of interference competition Meteorologische Zeitschrift 15:259–263.
from introduced ungulates on native wildlife. Lima, S. L., and L. M. Dill. 1990. Behavioral decisions made under the
risk of predation: a review and prospectus. Canadian Journal of Zoology
ACKNOWLEDGMENTS 68:619–640.
Ostermann‐Kelm, S., E. R. Atwill, E. S. Rubin, M. C. Jorgensen, and
We thank D. M. Morris for image processing and the W. M. Boyce. 2008. Interactions between feral horses and desert bighorn
Rawlins BLM Field Office for logistical input. Additional sheep at water. Journal of Mammalogy 89:459–466.
support for cameras, student support, and travel were pro- Penn, C. J., and R. B. Bryant. 2006. Application of phosphorus sorbing
materials to streamside cattle loafing areas. Journal of Soil and Water
vided by University of Wyoming (UW) Extension, UW Conservation 61:303–310.
College of Agriculture and Natural Resources and the Y Perry, N. D., P. Morey, and G. S. Miguel. 2015. Dominance of a natural
Cross Ranch Endowment, and a United States Department water source by feral horses. Southwestern Naturalist 60:390–393.
of Agriculture National Institute of Food and Agriculture PRISM Climate Group. 2020. PRISM climate data. http://prism.
oregonstate.edu. Accessed 1 May 2020.
McIntire Stennis Project (Animal–Plant Interaction Ridout, M., and M. Linkie. 2009. Estimating overlap of daily activity
Ecology on Wyoming Rangelands [2015–2020, Project patterns from camera trap data. Journal of Agricultural, Biological, and
WYO‐559‐15]). We declare no conflict of interest. Environmental Statistics 14:322–337.
Scasta, J. D., J. D. Hennig, and J. L. Beck. 2018. Framing contemporary
LITERATURE CITED U.S. wild horse and burro management processes in a dynamic eco-
logical, sociological, and political environment. Human‐Wildlife
Arnold, T. W. 2010. Uninformative parameters and model selection using Interactions 12:31–45.
Akaike's Information Criterion. Journal of Wildlife Management Schielzeth, H. 2010. Simple means to improve the interpretability of
74:1175–1178. regression coefficients. Methods in Ecology and Evolution 1:
Atwood, T. C., T. L. Fry, and B. R. Leland. 2011. Partitioning of an- 103–113.
thropogenic watering sites by desert carnivores. Journal of Wildlife Stewart, K. M., R. T. Bowyer, J. G. Kie, N. J. Cimon, and B. K. Johnson.
Management 75:1609–1615. 2002. Temporospatial distributions of elk, mule deer, and cattle: resource
Barnett, T. P., D. W. Pierce, H. G. Hidalgo, C. Bonfils, B. D. Santer, partitioning and competitive displacement. Journal of Mammalogy
T. Das, G. Bala, A. W. Wood, T. Nozawa, A. A. Mirin, et al. 2008. 83:229–244.
Human‐induced changes in the hydrology of the western United States.
U.S. Geological Survey [USGS]. 2016. 3DEP products and services: The
Science 319:1080–1083.
National Map, 3D Elevation Program Web page. http://nationalmap.
Bates, D., M. Maechler, B. Bolker, and S. Walker. 2015. Fitting linear
gov/3DEP/3dep_prodserv.html. Accessed 14 Mar 2017.
mixed‐effects models using lme4. Journal of Statistical Software 67:1–48.
Valeix, M., S. Chamaillé‐Jammes, and H. Fritz. 2007. Interference com-
Beever, E. A., and J. E. Herrick. 2006. Effects of feral horses in Great
petition and temporal niche shifts: elephants and herbivore communities
Basin landscapes on soils and ants: direct and indirect mechanisms.
at waterholes. Oecologia 153:739–748.
Journal of Arid Environments 66:96–112.
Weitzman, M. S. 1970. Measure of the overlap of income distribution
Boyd, C. S., K. W. Davies, and G. H. Collins. 2017. Impacts of feral horse
of white and negro families in the United States. Technical Report 22,
use on herbaceous riparian vegetation within a sagebrush steppe
U.S. Department of Commerce, Bureau of the Census, Washington,
ecosystem. Rangeland Ecology and Management 70:411–417.
D.C., USA.
Bureau of Land Management [BLM]. 2020. Wild horse and burro pro-
gram data. http://www.blm.gov/programs/wild-horse-and-burro/about-
the-program/program-data. Accessed 13 Jul 2020. Associate Editor: Sarah King.
1090 The Journal of Wildlife Management • 85(6)You can also read


