Assessment of Carbon Sequestration Potential of Tree Species in Amity University Campus Noida - MDPI
←
→
Page content transcription
If your browser does not render page correctly, please read the page content below
Proceeding Paper

Assessment of Carbon Sequestration Potential of Tree Species
in Amity University Campus Noida †
Richa Sharma 1,*, Lolita Pradhan 1, Maya Kumari 1 and Prodyut Bhattacharya 2

                                           1 Amity School of Natural Resources & Sustainable Development, Amity University, Sector 125, Noida,
                                             Uttar Pradesh 201301, India; pradhanlolita2013@gmail.com (L.P.); maya.84s@gmail.com (M.K.)
                                           2 School of Environmental Management, Block ‘A’, Guru Gobind Singh Indraprastha University,

                                             New Delhi 110078, India; prodyutbhattacharya@yahoo.com
                                           * Correspondence: richasharma1987@gmail.com; Tel.: +91-999-908-1539
                                           † Presented at the 1st International Electronic Conference on Forests—Forests for a Better Future: Sustainabil-
                                             ity, Innovation, Interdisciplinarity, 15–30 November 2020; Available online: https://iecf2020.sciforum.net.

                                           Abstract: Urban green spaces, particularly trees, have great potential to sequester carbon from the
                                           atmosphere and mitigate the impacts of climate change in cities. Large university campuses offer
                                           prominent space where such green spaces can be developed in order to offset the increasing green-
                                           house gas emissions, as well as other benefits. Amity University, Noida, is spread over 60 acres with
                                           dense tree plantations in and around the campus. The present study is a sustainability initiative to
                                           inventory the tree species on the campus and assess their total carbon sequestration potential (CSP).
                                           The above- and below-ground biomasses were estimated using the non-destructive sampling
                                           method. Individual trees on the campus were measured for their height and diameter at breast
                                           height (DBH), and estimates of carbon storage were performed using allometric equations. There is
                                           a total of 45 different tree species on the campus with the total CSP equivalent to approximately
                                           139.86 tons. The results also reveal that Ficus benjamina was the predominant species on the campus
Citation: Sharma, R.; Pradhan, L.;
                                           with CSP equivalent to 30.53 tons, followed by Alstonia scholaris with carbon storage of 16.38 tons.
Kumari, M.; Bhattacharya, P.
                                           The study reports that the ratio of native to exotic species is 22:23 or almost 1:1. The present work
Assessment of Carbon Sequestration
Potential of Tree Species in Amity
                                           highlights the role of urban forests or urban green spaces, not only as ornamental and aesthetic
University Campus Noida. Environ.          plantations but also in mitigating the impacts of climate change at a local level. Higher education
Sci. Proc. 2021, 3, 52. https://doi.org/   institutes have an important role in expanding their green cover so as to act as local carbon sinks.
10.3390/IECF2020-08075
                                           Keywords: above-ground biomass (AGB); below-ground biomass (BGB); carbon sequestration po-
Academic Editors: Angela Lo                tential (CSP); urban forests
Monaco, Cate Macinnis-Ng and
Om P. Rajora

Published: 13 November 2020                1. Introduction
                                                Cities are the hubs of economic growth and development. Urban areas contribute
Publisher’s Note: MDPI stays neu-
tral with regard to jurisdictional
                                           close to half of India’s gross domestic product today, but the rapid urbanization is a major
claims in published maps and institu-
                                           driver of global change, driving land use change, habitat loss, biodiversity decline, climate
tional affiliations.                       change, and pollution both within and outside the city [1]. A report published by Interna-
                                           tional Council of Local Environmental Initiatives (ICLEI), South Asia, has stated that av-
                                           erage per capita carbon emissions are higher in the metropolitan cities of India, being 1.19
                                           tons per capita, as compared to only 0.90 tons per capita in the non-metropolitan cities.
Copyright: © 2020 by the authors. Li-      Reduction in carbon dioxide concentrations in the atmosphere can be achieved either by
censee MDPI, Basel, Switzerland.           reducing the demand for energy, altering the usage of energy or increasing the rates of
This article is an open access article
                                           removal of CO2 through the trees through carbon sequestration, which can decrease the
distributed under the terms and con-
                                           atmospheric carbon dioxide naturally [2].
ditions of the Creative Commons At-
                                                The term urban forest and urban green space includes trees in gardens, parks, and
tribution (CC BY) license (http://crea-
                                           along the streets, roads, canal, etc., which contribute to verdancy in the city [3]. These
tivecommons.org/licenses/by/4.0/).
                                           spaces provide a variety of ecosystem services such as improving air quality [4], buffering

Environ. Sci. Proc. 2021, 3, 52. https://doi.org/10.3390/IECF2020-08075                                           www.mdpi.com/journal/environsciproc
Environ. Sci. Proc. 2021, 3, 52 2 of 9
of noise pollution, biodiversity conservation, mitigating Urban Heat Island effect, micro-
climate regulation, stabilization of soil, ground water recharge, prevention of soil erosion,
and carbon sequestration [5]. Studies conducted by several scientists have claimed that
urban green spaces can play a very important role in limiting the city’s carbon footprint
[6]. The vegetation and soil of a greenspace cannot only sequester carbon, directly contrib-
uting to a reduction in atmospheric CO2 concentration, but also affect the carbon balance
indirectly, through their effects on the urban energy balance and thus on CO2 emissions
related to energy use [7]. In addition, these upgrade the standards of urban living by fa-
cilitating the health and well-being of the people by alleviating stress and enabling relax-
ation. Such areas also deliver an array of cultural services such as spiritual and religious,
recreation, ecotourism and aesthetics [8]. The maximum benefit of these spaces largely
depends on judicious selection of an appropriate and diverse mix of tree species and their
proper management in the urban areas [9,10].
According to the Intergovernmental Panel on Climate Change (2006), the major five
carbon pools of a terrestrial ecosystem involving biomass are above-ground biomass, be-
low-ground biomass, dead wood, litter and soil organic matter [11]. Therefore, there are
three ways in which urban green spaces can repress atmospheric carbon. Firstly, auto-
trophs take up carbon dioxide from the atmosphere—a part of which is released back into
the atmosphere and the remainder is stored in the plant tissues above and below ground,
resulting in the plant growth in the form of biomass. Therefore, all autotrophs convert
atmospheric carbon dioxide into biomass, but trees, specifically, are considered to be the
major sinks or sponges of carbon. The carbon assimilated by trees is retained for longer
duration with little leakage into the atmosphere. Annual rates of carbon sequestration
largely depend on the tree size at maturity, life span and their growth rates [12]. After the
trees die, the biomass either enters the food chain or the soil as soil carbon [13]. Secondly,
the soils are also chief contributors to the carbon stocks. Litter and woody debris are not
a major carbon pool as they contribute only a small fraction to the total carbon stocks.
Thirdly, urban vegetation reduces the demand for cooling the building by providing
shade and evapotranspiration, and demand for heating living spaces by reducing wind
speed. This substantially reduces burden on fossil fuel burning for electricity generation,
thus offsetting carbon emissions [14].
Though the importance of forested areas in carbon sequestration has been well estab-
lished and documented, few attempts have been made to address the potential of trees in
carbon sequestration in urban cities. It is important to study the carbon sequestration po-
tential of urban centers so as to understand and highlight the role of urban green spaces
in offsetting carbon emissions at a local level. Large university campuses provide large
areas for urban tree plantations that can be a potential solution for climate change mitiga-
tion. Being aware of how much carbon an urban green space can sequester is helpful be-
cause it can help an institution or organization offset its emissions and value its green
spaces.
There are a number of studies wherein carbon stock estimation is performed for Uni-
versity campuses in India. Gavali and Shaikh (2016) estimated tree biomass and carbon
storage in the Solapur University of Maharastra and reported that urban green spaces are
likely to have a wider impact per area of tree canopy cover in comparison to other non-
urban forests due to faster growth rates and increased proportions of large trees [15].
Marak and Khare (2017) also estimated carbon sequestration potential of tree species in
the Sam Higginbottom University of Agriculture, Technology and Sciences (SHUATS)
campus, Allahabad, and identified the important species with maximum carbon seques-
tration potential [16]. Similar studies on carbon sequestration have been carried out in
Jnanabharathi campus, Bangalore University [17], Bharathiar University campus at Coim-
batore [18], Andhra University, Vishakhapatnam [19], North Maharashtra University
Campus, Jalgaon [13], Golapbag campus of Burdwan University [20,21], various educa-
tional institutes in Vijaypur, Jammu and Kashmir [22] and Vellore Institute of Technology
(VIT) campus [23]. However, a complete and recent analysis of CSP of Amity UniversityEnviron. Sci. Proc. 2021, 3, 52 3 of 9
Noida campus has not yet been performed. Therefore, the main objective of the present
work is to inventory the tree species present on the campus and calculate their total carbon
sequestration potential.
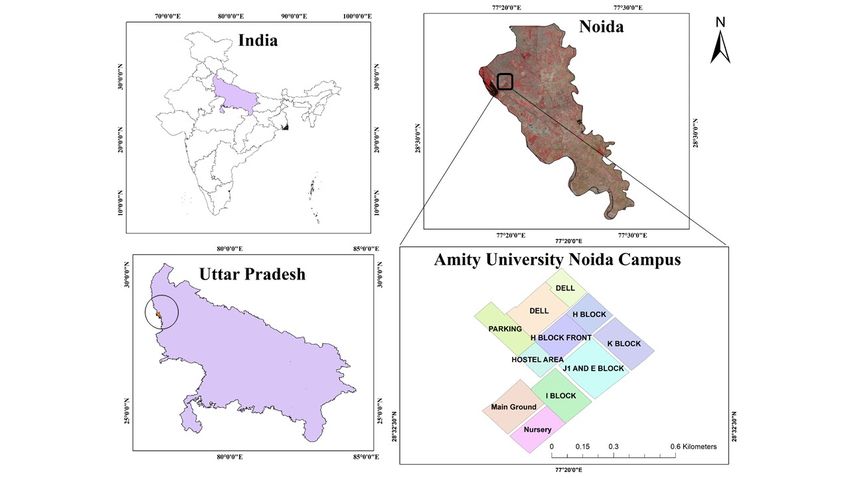
2. Study Area
The present work was carried out in Amity University campus, located in Noida,
Uttar Pradesh (Figure 1). The campus is spread over 60 acres with dense tree plantations
in and around it. The total geographic area of the campus is 24 hectares. It is well con-
nected to the national capital and is located on the Yamuna Expressway, connecting
Greater Noida. The campus is divided into academic and administrative blocks, inter-
spersed with plenty of green spaces.
The city experiences cold winters and warm summers, with a temperature ranging
from a maximum of 48 °C to a minimum of 28 °C. It receives very little rainfall throughout
the year with an average of around 728 mm per year. The city has witnessed extensive
urbanization throughout the years, with a number of high-rise buildings, corporations
and industries [24].
Figure 1. Study area.
3. Material and Methods
3.1. Tree Cover Mapping
Between March 2019 and March 2020, complete enumeration of the 1997 trees on the
campus was performed block-wise (Figure 2).
3.2. Tree Height and Girth at Breast Height (GBH)
A non-destructive method of biomass estimation was used to measure the tree height
and GBH of individual trees of the campus. Individual trees greater than or equal to 30
cm in girth at breast height (1.37 m) were enumerated. Tree height and girth were meas-
ured using clinometer/altimeter and measuring tape, respectively. Field data were rec-
orded in spreadsheets. Species level identification of trees was obtained through visualEnviron. Sci. Proc. 2021, 3, 52 4 of 9
observation, and the doubtful samples were collected and stored in herbarium for later
identification by taxonomists. Shrubs and herbs were not recorded.
3.3. Estimation of Above-Ground and Below-Ground Biomass (AGB and BGB)
Above-ground and below-ground biomasses were estimated on the basis of field
measurements of diameter at breast height (DBH) of the tree using allometric equations
[25]. The below given equation is applicable to dry climates with annual rainfall < 1500
mm; hence, it can be used for Noida where the average annual rainfall ranges between
700 and 800 mm.
AGB = 34.4703 − 8.0671D + 0.6589D2 (1)
where D is the DBH (cm).
BGB = AGB × (15/100) (2)
3.4. Estimation of Total Biomass (TB)
Total biomass of individual trees will be the sum of their above- and below-ground
biomasses, respectively, given by the following equation:
Total Biomass = AGB + BGB (3)
3.5. Estimation of Carbon Content
Generally, for any plant species, 50% of its biomass is its carbon content [11].
Carbon Content = 0.5 × Total Biomass (4)
CO2 equivalent is then calculated using the below given equation:
CO2 (eq.) = (Carbon content × 44)/12 (5)
Figure 2. Methodology flowchart.
4. Results and Discussion
A total of forty-five different species of trees were enumerated on the campus (Figure
3, Table 1). The most dominant species on the campus is Ficus benjamina, with a total of
436 trees. This species is commonly used in urban plantations as it is shade tolerant, can
survive drought conditions, requires very little maintenance and can thrive in a range of
soil types. Its ability to regenerate by aerial roots, cuttings and by seeds, as well as its
dense canopy cover that provides shade, makes it an ideal choice for avenue plantations.Environ. Sci. Proc. 2021, 3, 52 5 of 9
One of the disadvantages of this non-native tree species is that its vigorous and invasive
root system buckles up pavements and roads [26].
The second and the third most common tree species are Alstonia scholaris and Plumeria
obtusa, with their individual tree number equal to 308 and 222, respectively. Alstonia schol-
aris, also known as the Devil’s tree or the Blackboard tree, is prominently used in urban
plantations because of its ability to survive dry conditions, hardy nature, and tolerance
against air pollution [27]. It is the most common native tree species found on the campus.
Plumeria obtusa also has evolved to be one of the most preferred ornamental trees in urban
areas, as it requires little or no maintenance, can propagate easily and looks magnificent
with beautiful clusters of flowers all year round [28]. Delonix regia and Neolamarckia ca-
damba also have over a hundred tree plantations on the campus.
The ratio of native to non-native species on the campus is approximately 1:1. The
largest DBH is recorded for a Ficus religiosa tree measuring 298.7 cm, followed by Bombax
ceiba and Morus rubra trees measuring 265.1 and 213.3 cm, respectively. The above-ground
biomass (AGB) and below-ground biomass (BGB) of all the trees of the campus are equiv-
alent to 63,136.8 and 9470.5 kg, respectively. The total biomass accumulated is 72,607.3 kg
and the total carbon content of the campus trees is equal to 38,142.5 kg. The total carbon
sequestered by all the trees in a year is 139.9 tons. In other words, on average, carbon
sequestered by an individual tree on the campus is 70 kg or 0.07 tons. A similar study
performed in California State University, Northridge (CSUN), reveals that the total carbon
dioxide sequestered by campus trees was in the order of 154 tons per year [29].
Haghparast (2013) also reported a total of 1694.5 tons of sequestrated carbon for seventy-
six plots of Pune University campus [30]. Analysis of CSP of New Zealand University
gave the estimates that 4139 trees stored 5809 tons of CO2 [31].
Annual CO 2 sequestered by tree species
35.0
CO2 EQUIVALENT (TONS)
30.0
25.0
20.0
15.0
10.0
5.0
0.0
Figure 3. Annual CO2 sequestered by different tree species in the campus.Environ. Sci. Proc. 2021, 3, 52 6 of 9
Table 1. CO2 Eq. (tons) of tree species in Amity University Campus.
Species Name Native/ Total No. AGB BGB TB Carbon CO2 EQ CO2 EQ.
S.N.
Scientific Name Common Name Exotic Species of Trees (kg) (kg) (kg) (kg) (kg) (tons)
1 Ficus benjamina Weeping fig Exotic 436 14,481.29 2172.19 16,653.48 8326.74 30,531.39 30.53
2 Alstonia scholaris Scholar’s Tree Native 308 7769.11 1165.37 8934.48 4467.24 16,379.87 16.38
3 Plumeria obtusa White Frangipani Exotic 222 7420.95 1113.14 8534.09 4267.04 15,645.83 15.65
4 Delonix regia Flame Tree Exotic 211 6883.30 1032.50 7915.80 3957.90 14,512.30 14.51
5 Neolamarckia cadamba Kadam Native 100 3274.72 491.21 3765.92 1882.96 6904.19 6.90
6 Ficus microcarpa Laurel fig Native 82 2716.93 407.54 3124.47 1562.24 5728.20 5.73
7 Chukrasia tabularis Indian Mahogany Native 78 2578.00 386.70 2964.70 1482.35 5435.28 5.44
8 Phoenix dactylifera Date Palm Exotic 77 2451.74 367.76 2819.50 1409.75 5169.09 5.17
9 Gravillea robusta Silver Oak Exotic 74 2430.46 364.57 2795.03 1397.51 5124.21 5.12
10 Roystonea regia Royal Palm Exotic 46 1515.21 227.28 1742.50 871.25 3194.58 3.19
11 Callistemon viminalis Bottlebrush tree Exotic 39 1303.96 195.59 1499.55 749.78 2749.18 2.75
12 Eucalyptus sp. Eucalyptus Exotic 36 1155.93 173.39 1329.32 664.66 2437.09 2.44
13 Musa sp. Banana Exotic 25 835.56 125.33 960.90 480.45 1761.64 1.76
14 Mimusops elengi Spanish Cherry Native 24 791.78 118.77 910.55 455.27 1669.34 1.67
15 Azadirachta indica Neem Native 24 784.78 117.72 902.50 451.25 1654.58 1.65
16 Cassia fistula Indian Laburnum Native 20 670.61 100.59 771.21 385.60 1413.88 1.41
17 Phyllanthus emblica Indian Gooseberry Native 19 615.51 92.33 707.84 353.92 1297.70 1.30
18 Dalbergia sissoo Indian Rosewood Native 18 592.21 88.83 681.04 340.52 1248.58 1.25
19 Ficus virens White Fig Exotic 17 556.52 83.48 640.00 320.00 1173.32 1.17
20 Ficus religiosa Sacred Fig Native 15 466.34 69.95 536.30 268.15 983.21 0.98
21 Morus alba White Mulberry Exotic 14 456.49 68.47 524.97 262.48 962.44 0.96
22 Largestroemia speciosa Pride of India Native 12 398.66 59.80 458.46 229.23 840.52 0.84
23 Peltophorum pterocarpum Copper pod Exotic 12 241.93 36.29 278.22 1020.15 3740.56 3.74
24 Moringa oleifera Drumstick tree Native 10 326.28 48.94 375.22 187.61 687.90 0.69
25 Bauhinia acuminata Dwarf white orchid tree Exotic 10 331.99 49.80 381.79 190.90 699.95 0.70
26 Bambusa vulgaris Bamboo Exotic 10 254.95 38.24 293.19 146.59 537.51 0.54
27 Syzygium cumini Jamun Native 9 296.08 44.41 340.49 1128.00 4135.99 4.14
28 Jatropha Curcas Jatropha Exotic 7 232.40 34.86 267.26 133.63 489.97 0.49Environ. Sci. Proc. 2021, 3, 52 7 of 9
29 Morus rubra Red Mulberry Exotic 6 197.01 29.55 226.57 113.28 415.37 0.42
30 Acacia auriculiformis Earleaf Acacia Exotic 5 162.32 24.35 186.66 93.33 342.21 0.34
31 Saraca asoca Sorrowless tree Native 5 118.61 17.79 136.40 68.20 250.07 0.25
32 Pterospermum acerifolium Maple-leaved Bayur tree Native 4 129.22 19.38 148.60 74.30 272.44 0.27
33 Aegle marmelos Stone apple tree Native 3 98.48 14.77 113.26 56.63 207.64 0.21
34 Bombax ceiba Silk cotton tree Exotic 3 92.07 13.81 105.89 52.94 194.12 0.19
35 Senna siamea Siamese Senna Native 2 65.17 9.77 74.94 37.47 137.39 0.14
36 Holoptelea integrifolia Indian Elm Native 1 27.06 4.06 31.12 15.56 57.06 0.06
37 Terminalia arjuna Arjun Native 1 32.48 4.87 37.35 18.67 68.47 0.07
38 Spathodea campanulata African Tulip Tree Exotic 1 32.10 4.82 36.92 18.46 67.68 0.07
39 Psidium guajava Guava Exotic 1 27.06 4.06 31.12 15.56 57.06 0.06
40 Cordia myxa Indian Cherry Native 1 33.40 5.01 38.41 19.21 70.42 0.07
41 Pongamia pinnata Indian Beech Tree Exotic 1 31.73 4.76 36.49 18.25 66.90 0.07
42 Ficus elastica Rubber Tree Exotic 1 33.40 5.01 38.41 19.21 70.42 0.07
43 Ficus lyrata Fiddle-leaf Fig Exotic 1 33.62 5.04 38.66 19.33 70.87 0.07
44 Magnifera indica Mango Native 1 27.06 4.06 31.12 15.56 57.06 0.06
45 Tabebuia argentea Yellow Trumpet Tree Native 5 162.32 24.35 186.66 93.33 342.21 0.34
Total 1997 63,136.81 9470.52 72,607.33 38,142.46 139,855.69 139.86Environ. Sci. Proc. 2021, 3, 52 8 of 9
5. Conclusions
The present work is a sustainability initiative to inventory the trees of Amity Univer-
sity campus and compute their carbon storage capacity. AGB and BGB were also esti-
mated using the non-destructive method. A total of 1997 trees belonging to 45 different
species have been recorded on the campus, with the carbon sequestration potential of
139.9 tons. The ratio of native to non-native species on the campus is approximately 1:1.
The results of the study illuminate the value of urban trees, not only as ornamental and
aesthetic plantations but also in mitigating the impacts of climate change at a local level.
Higher education institutes have an important role in expanding their green cover so as
to act as local carbon sinks. It is also imperative that more native species should be planted
as compared to the exotic species. The results of the study can be used for future on-cam-
pus greening plans, and act as a baseline for future assessments of the campus carbon
sink. Such education institutes can model themselves as agents of change and influence
student behavior by undertaking such sustainable green practices on campus.
References
1. Satterthwaite, D.; McGranahan, G.; Tacoli, C. Urbanization and its implications for food and farming. Philos. Trans. R. Soc. B
Biol. Sci. 2010, 365, 2809–2820.
2. Indian Infrastructure Report. Infrastructure Development in Low Carbon Economy. 2010. Available online:
http://www.idfc.com/pdf/report/IIR_2010_Report_Full.pdf (accessed on 1 August 2020).
3. Ugle, P.; Rao, S.; Ramachandra, T.V. Carbon Sequestration Potential of Urban Trees. In Proceedings of the Lake 2010: Wetlands,
Biodiversity and Climate Change, 22–24 December 2010; pp. 1–12.
4. Singh, S.; Bhattacharya, P.; Gupta, N.C. Dust particles characterization and innate resistance for Thevetia peruviana in different
land-use pattern of urban area. Int. J. Environ. Sci. Technol. 2018, 15, 1061–1072.
5. Shah, D.R.; Gavali, D.J. Floral diversity in Vadodara gardens, Gujarat, India. Int. J. Conserv. Sci. 2017, 8, 113–120.
6. Strohbach, M.W.; Arnold, E.; Haase, D. The carbon footprint of urban green space—A life cycle approach. Landsc. Urban Plan.
2012, 104, 220–229.
7. Churkina, G. The role of urbanization in the global carbon cycle. Front. Ecol. Evol. 2016, 3, 144.
8. Chang, J.; Qu, Z.; Xu, R.; Pan, K.; Xu, B.; Min, Y.; Ren, Y.; Yang, G.; Ge, Y. Assessing the ecosystem services provided by urban
green spaces along urban center-edge gradients. Nat. Sci. Rep. 2017, 7, 11226.
9. Bhalla, P.; Bhattacharya, P. Urban Biodiversity and Green Spaces in Delhi: A Case Study of New Settlement and Lutyens’ Delhi.
J. Hum. Ecol. 2015, 51, 83–96.
10. Singh, S.; Gupta, N.C.; Bhattacharya, P. Assessment of air pollution responses through biochemical and physical traits observed
for four plant species in an urban area. In Climate Change, Resource conservation and Sustainability Strategies; DBH Publishers:
Delhi, India, 2017; pp. 32–40.
11. IPCC. 2006 IPCC Guidelines for National Greenhouse Gas Inventories; Eggleston, H.S., Buendia, L., Miwa, K., Ngara, T.; Tanabe, K.,
Eds.; Prepared by the National Greenhouse Gas Inventories Programme; IGES: Hayama, Japan, 2006.
12. Nowak, D.J.; Crane, D.E. Carbon storage and sequestration by urban trees in the USA. Environ. Pollut. 2002, 116, 381–389.
13. Suryavanshi, M.N.; Patel, A.R.; Kale, T.S.; Patil, P.R. Carbon Sequestration Potential of tree Species in the Environment of North
Maharashtra University Campus, Jalgaon (MS) India. Biosci. Discov. 2014, 5, 175–179.
14. Jo, H.K. Impacts of urban greenspace on offsetting carbon emissions for middle Korea. J. Environ. Manag. 2002, 64, 115–126.
15. Gavali, R.S.; Shaikh, H.M.Y. Estimation of Carbon storage in the tree growth of Solapur University Campus, Maharashtra, India.
Int. J. Sci. Res. 2016, 5, 2364–2367.
16. Marak, T.; Khare, N. Carbon sequestration potential of selected tree species in the campus of SHUATS. Int. J. Sci. Res. Dev. 2017,
5, 63–65.
17. Nandini, N.; Kumar, M.; Tandon, S. Assessment of Carbon Sequestration in Trees of Jnanabharathi Campus—Bangalore Uni-
versity. J. Ecol. Environ. Conserv. 2009, 15, 503–508.
18. Pragasan, L.A.; Karthick, A. Carbon stock sequestered by tree plantations in University campus at Coimbatore, India. Int. J.
Environ. Sci. 2013, 3, 1700–1710.
19. Ahmedin, A.M.; Bam, S.; Siraj, K.T.; Raju, A.S. Assessment of biomass and carbon sequestration potentials of standing Pongamia
pinnata in Andhra University, Visakhapatnam, India. Biosci. Discov. 2013, 4, 143–148.
20. Das, M.; Mukherjee, A. Carbon Sequestration Potential, its Correlation with height and girth of selected trees in the Golapbag
Campus, Burdwan, West Bengal (India). Indian J. Sci. Res. 2015, 10, 53–57.
21. Ganguly, S.; Das, M.; Mukherjee, M. Carbon Sequestration Potential of phanerophytes used for environmental optimization to
mitigate climate change. NeBIO 2017, 8, 197–200.
22. Kour, K.; Sharma, S. Carbon Sequestration Potential of Tree Species in the Premises of Various Educational Institutes, Vijaypur
(J&K), India. Int. J. Res. Environ. Sci. 2016, 2, 40–44.Environ. Sci. Proc. 2021, 3, 52 9 of 9
23. Saral, A.M.; SteffySelcia, S.; Devi, K. Carbon storage and sequestration by trees in VIT University campus. IOP Conf. Ser. Mater.
Sci. Eng. 2017, 263, 022008.
24. Sharma, R.; Pradhan, L.; Kumari, M.; Bhattacharya, P. Assessing urban heat islands and thermal comfort in Noida City using
geospatial technology. Urban Clim. 2021, 35, 100751.
25. MacDicken, K.G. A Guide to Monitoring Carbon Storage in Forestry and Agroforestry Projects; Winrock International Institute for
Agricultural Development: Washington, DC, USA, 1997.
26. Gilman, E.F.; Watson, D.G. Ficus Benjamina, Fact Sheet ENH 410; Environmental Horticulture Department, Institute of Food and
Agricultural Sciences (IFAS), University of Florida: Gainesville, FL, USA, 2007.
27. Gulshan, A. Why the Saptaparni is called the devil’s tree. The Hindu, 22 October 2019.
28. Reddy, N.C. Plumeria: world’s most beloved garden plant. The Hindu, 29 June 2012.
29. Cox, H.M. A sustainability initiative to quantify carbon sequestration by campus trees. J. Geogr. 2012, 111, 173–183.
30. Haghparast, H.; Delbari, A.; Kulkarni, D.K. Carbon sequestration in Pune university campus with special reference to Geo-
graphical Information System (GIS). Ann. Biol. Res. 2013, 4, 169–175.
31. De Villiers, C.; Chen, S.; Zhu, Y. Carbon sequestered in the trees on a university campus: A case study. Sustain. Account. Manag.
Policy J. 2014, 5, 149–171.You can also read