CARBON FOOTPRINT REPORT 2016 - RSPO
←
→
Page content transcription
If your browser does not render page correctly, please read the page content below
2016

CARBON
FOOTPRINT
REPORT
inside
   carbon
 footprint
    report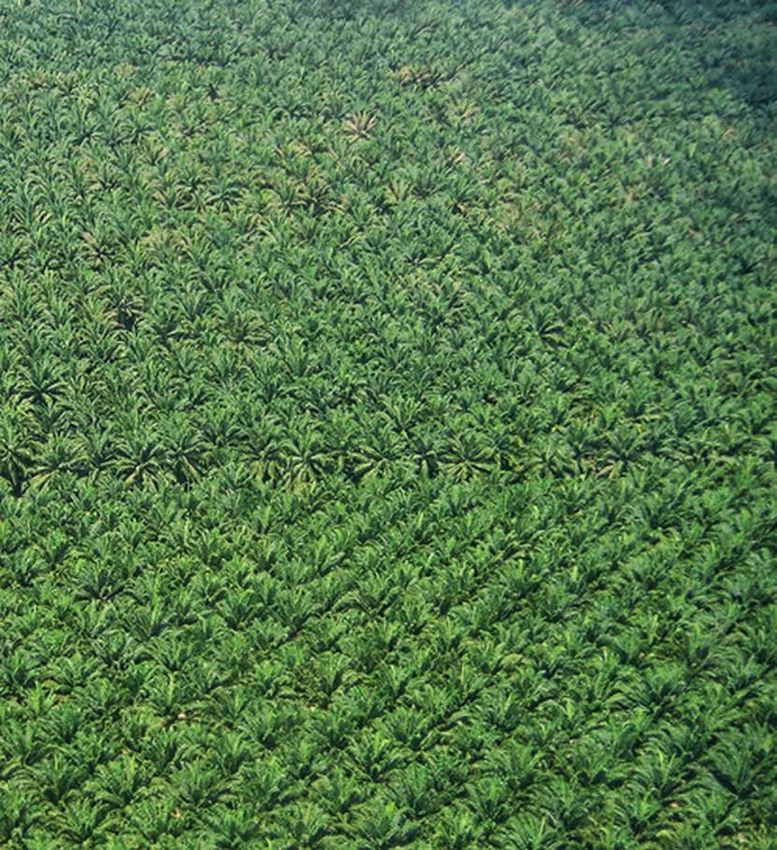
Highlights                About Kulim                   Overview
                                                        11	Emissions from oil palm

                          1 2 3
                                                            cultivation

                                                        15	Emissions from palm oil
                                                            production

  2                        4                              6

Mitigation                Methodology                   Base data
strategies
and reduction             20 PalmGHG                    22	Emissions data 2016
targets                                                     (PalmGHG Version 3)
                          21	Assumptions for carbon
                              reduction targets         23	Emissions data 2015
18	Methane capture and                                      (PalmGHG Version 3)
    biogas generation
                                                        24 Production data
19 Fertiliser reduction
                                                        24	Data collections and
19 Outgrower engagement                                     limitations
19	Updated emissions
    reduction targets

 18

Glossary
                     4 5 620

                          References
                                                          22

                                                        About
                                                        this
                                                        report

 26
                     7 8 928                              29

                                                       Carbon Footprint Report 2016
                                                                                      1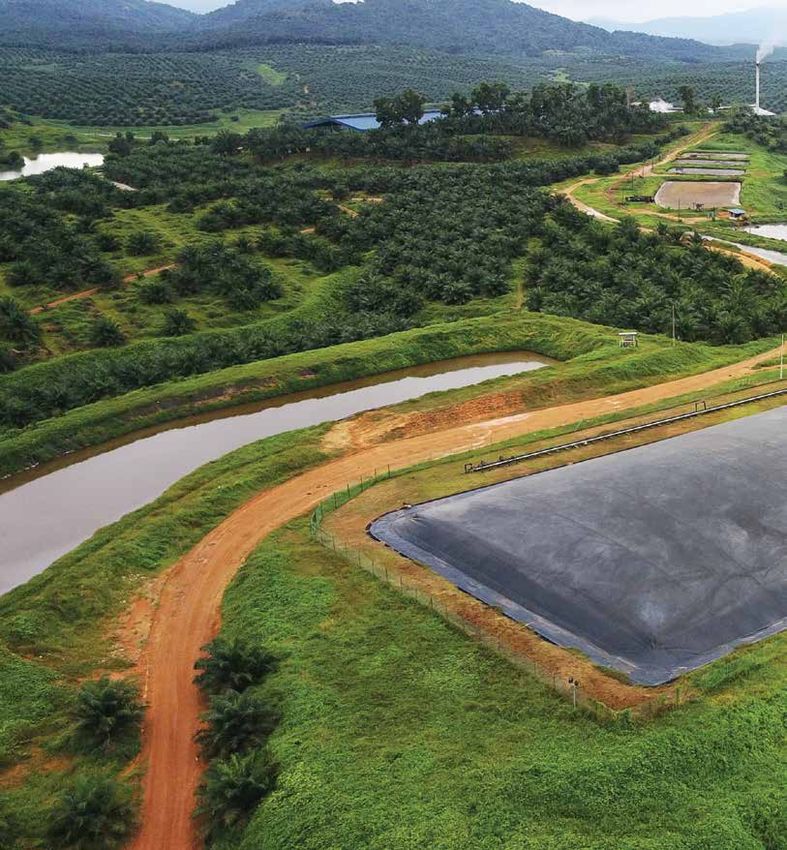
HIGHLIGHTS
                                         2015–2016

                                         15%
                         Our
                     achievement
                                                                           Land
                                         lower fertiliser                Clearing
                                           emissions

 100%   of our mills
                             Our goals
                              by 2025
        will include
      biogas capture                       This target was revised to
                                           reflect changes to the
                        At least           operating environment

                    50%
                                           and cost basis of biogas                 Nursery
                                           capture. See page 9 for
                                           further detail.
                     reduction in
                    emissions from
                        POME

  Our
ambition
             To achieve              Due to the significant changes in

          58%
                                     the PalmGHG methodology and
                                     changes to our biogas capture
                                     plans, we are currently reviewing
                                     this target and will update in
            lower carbon             future reports.
             footprint by
                 2020

        Kulim (Malaysia) Berhad
  2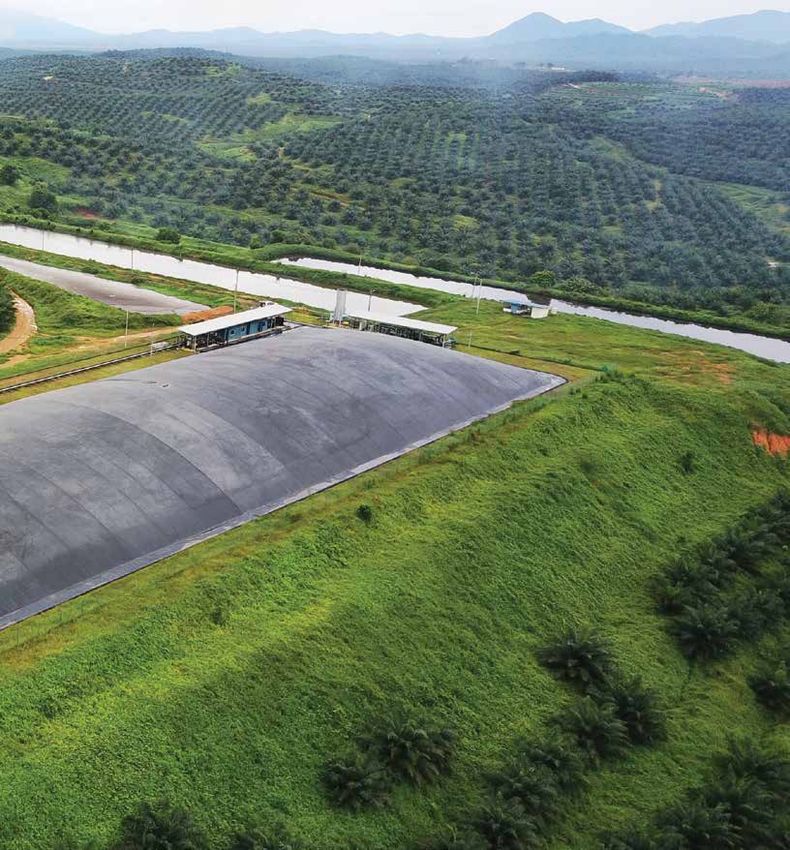
Harvesting

                                                     Biogas

                    Fresh Fruit
                          ”
                  Bunches ( FFB”)

                                      Palm
                                    Products

     Planting &
     Replanting

                                               Carbon Footprint Report 2016
                                                                              3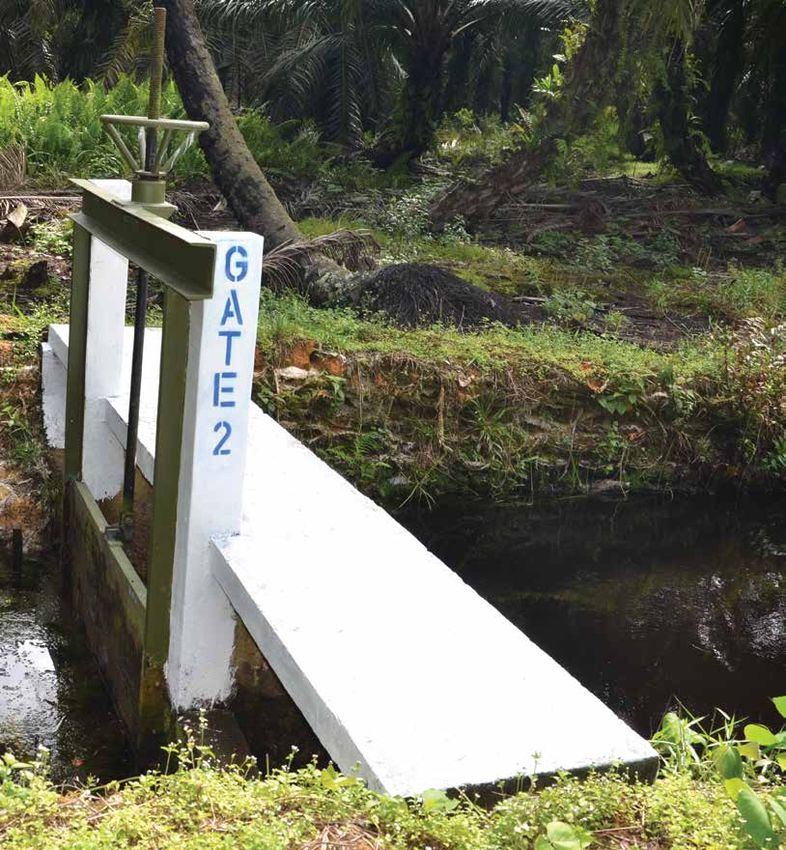
about                                                                                     21
                                                                                               18

kulim                                                                                     22
                                                                                               17

                                                                                               23
                                                                                                    16
        Kulim (Malaysia) Berhad (“Kulim”) is
        a wholly owned subsidiary of Johor
        Corporation with total landbank of 115,378
        hectares. At the end of 2016, we have total
        oil palm planted area of 55,680 hectares
        spread across Malaysia and Indonesia.
                       As we began plantings in our Indonesian operation in 2014, this
                       report covers only our operations in Malaysia. These operations
                       are located in the states of Johor and Pahang in the southern
                       part of Peninsular Malaysia.

                       As at 31 December 2016, our landbank in Malaysia was 51,033
                       hectares, of which over 47,028 hectares are planted with oil
                       palm. We produce Crude Palm Oil (“CPO”) and Palm Kernel
                       (“PK”). In 2016, our total production was 273,354 tonnes of
                       CPO and 70,030 tonnes of PK. We have four (4) RSPO-certified
                       mills that processed a total of 1,339,659 tonnes of Fresh Fruit
                       Bunches (“FFB”) in 2016. This included 364,778 tonnes (27.2%)
                       of FFB purchased from external smallholders and outgrowers.

                       Most of our plantations were established between 1970 and
                       1990. The majority of these areas were converted from other
                       agricultural crops, particularly rubber. Only 1,363 hectares of
                       our planted area is on peat. Our new Pasir Panjang Palm Oil Mill
                       was commissioned in March 2015 and is included in our carbon
                       calculations for the first time in this report.

    Kulim (Malaysia) Berhad
4
Location of estates and mills

                                                                         1.     Bukit Layang Estate
                                                                         2.     Basir Ismail Estate
                       15
         13                                                              3.      REM Estate
               14
                                                                         4.     Ulu Tiram Estate
    12
              10                                                         5.     Sedenak Estate and
                       11
                                                                                Sedenak Palm Oil Mill
         9
                                                                         6.     Kuala Kabung Estate

                       JOHOR
                                                                         7.     Rengam Estate
8
                                                                         8.     Sindora Estate and
                                                                                Sindora Palm Oil Mill
                                                                         9.     Tereh Selatan Estate
                   7                                                     10.    Enggang Estate
                                                                         11.    Mutiara Estate
                                5
                            6                                            12.    Tereh Utara Estate and
                                                             24                 Tereh Palm Oil Mill
                                                3                        13.    Sungai Tawing Estate
                                                                    20
                                            4                            14.    Selai Estate
                                                    2
                                                                         15.    Sungai Sembrong Estate
                                                         1               16.    Labis Bahru Estate
                                                               19        17.    Sepang Loi Estate
                                                                         18.    UMAC Estate
                                                                         19.    Sungai Papan Estate
                                                                         20.    Siang Estate

                       4
                                                                         21.    Palong Estate

                                rspo                                     22.    Kemedak Estate and
                                                                                Palong Cocoa Palm Oil Mill
                                Certified
                                Mills                                    23.    Mungka Estate
                                                                         24.    Pasir Panjang Estate and
                                                                                Pasir Panjang Palm Oil Mill

              Planted                                   Landbanks
    47,028     hectares
                                                        51,033
                                                        hectares
                                                                               Carbon Footprint Report 2016
                                                                                                              5
3
overview

overview

                              Kulim is a longstanding champion of sustainable
                              development. We recognise the need to work
                              towards the protection of our environment
                              while meeting the basic needs and securing the
                              development of current and future generations.
                              We also acknowledge climate change as one of
                              the greatest threats to our planet.

                              Climatic changes wreak havoc on agricultural conditions and severely
                              impact on the agricultural sector, on food security and most importantly
                              on communities in rural areas that are vulnerable to natural disasters.
                              Kulim therefore supports the Malaysian national target of achieving a 40%
                              reduction in carbon emissions by 2020, as we believe that every individual
                              and every business has a role to play in protecting our planet.

                              This is the third biennial Carbon Footprint Report for Kulim and part of
                              our ongoing efforts to ensure that we track our progress towards this
                              commitment. The report provides an overview of Kulim’s climate change
                              impacts, as well as a product carbon footprint of the Crude Palm Oil (“CPO”)
                              and Palm Kernel (“PK”) produced at our Malaysian mills.

    Kulim (Malaysia) Berhad
6
carbon emissions
                   reduction by
                   year 2020
                   National
                   Target        40%
                   Kulim
                                 58%
                    We believe in using the most advanced science and tools
                    available to measure our performance. Kulim was one of
                    the first companies to use the PalmGHG tool (V1) developed
                    by the RSPO Greenhouse Gas (GHG) Working Group. An
                    updated version of the tool (V2.1.1 referred to as “V2” in
                    this report) was released in early 2014, with significant
                    changes to the categorisation of previous land uses as
                    well as default values and a further update in 2016 brought
                    additional changes in default values. To benchmark against
                    peers using the latest version, we have used PalmGHG V3
                    in this report. However, continual methodological changes
                    (particularly between V1 and V3) make it impossible to
                    compare year-on-year results. Because the changes are
2016                relatively minor between V2 and V3, particularly on POME
                    emissions, we therefore make data comparisons on our
net planting        performance between 2014 and 2016 in this report.
emissions

67,000 MT CO e
                    Our net emissions have increased by 18.2% since 2014, from
                    just under 357,000 MT CO2e to around 422,000 MT CO2e. On
               2    a per-tonne basis, our carbon footprint is 1.23 MT CO2e, or
                    6.95% increase from 1.15 MT CO2e in 2014.

                                         Carbon Footprint Report 2016
                                                                           7
overview

By far the largest proportion of our emissions is associated with previous land use. As most of our landbank is oil palm
replant, or converted from other agricultural crops with a similar emissions profile i.e. rubber, the sequestration associated
with oil palm planting largely balances out these emissions. This resulted in net planting emissions of just over 67,000 MT
CO2e in 2016.

             GHG emissions (MT CO2e) for Kulim’s Malaysian operations including
                           smallholders for the years 2014 - 2016
      1,000,000

        800,000

        600,000

        400,000

        200,000

                  –

      (200,000)

      (400,000)

      (600,000)

      (800,000)

     (1,000,000)
                        Land         Crop                                                      Conservation                           Grid
                                                  Fertilisers   N2O      Field fuel   Peat                    POME      Mill fuel              Mill credit   Total net
                      clearing   sequestration                                                    credit                            emission
        2014 V2:1.1    858,308        (816,151)       27,753    49,514       15,431   73,403              –   183,280      2,516           –     (37,234)     356,820
        2015 V3        756,867       (656,079)        21,869    38,382      22,200    75,083        (3,247)   191,017      3,173         269     (28,406)      421,126
        2016 V3        734,449       (667,826)        22,205    44,907      19,608    74,292        (3,366)   227,198      3,030         320     (32,932)      421,884

     biogas facility

         Sedenak                         Pasir Panjang                           Sindora
        Palm Oil Mill                    Palm Oil Mill                         Palm Oil Mill
                                                                          2018 Completion

       Kulim (Malaysia) Berhad
 8
Methane (CH4) released by Palm Oil Mill Effluent (POME) Our 2016 emissions from peat remained high at around
accounted for our main increase in emissions in 2016, 74,000 MT CO2e, but with no significant change from 2014 and
totalling just over 227,000 MT CO2e. The increase is due to 2015. Combined emissions from fertiliser usage of nitrous
mill cleaning processes. However reducing these emissions oxide (N2O) and transport contributed 68,000 MT CO2e, also
continues to be our main focus and we are confident that in line with 2014 and while fuel consumption increased for
significant reductions can be achieved over the coming mills and field use, emissions from these activities remained
years. We have commissioned two (2) biogas facilities at relatively low at just over 23,000 MT CO2e.
our Sedenak Palm Oil Mill and Pasir Panjang Palm Oil Mill.
These facilities will use CH4 capture technologies to convert
POME emissions into electricity. A third facility at Sindora
Palm Oil Mill is scheduled for completion in 2018. Through
overall emissions
these investments we are targeting a 50% reduction in our
overall emissions from POME by the end of 2025. 50%
by Year 2025
Carbon Footprint Report 2016
9overview
EMISSIONS SOURCES AND EMISSIONS SINKS
Fertiliser transport Field fuel use due to Mill diesel usage - Palm Oil Mill
and use of fertilisers. harvesting and fuel combustion is a Effluent release
collection of FFB. source of CO2. methane, which is a
Diesel and gasoline powerful
combustion is a source greenhouse gas.
of CO2 emissions.
Land clearing release stored
carbon in the biomass. The level
of emissions depends on the type
of previous land use, with high
levels of forest cover, such as
primary forest releasing high
levels of CO2, whereas grassland
releasing only small amounts.
Peatland cultivation - these
represent a significant source of
GHG emissions. We have a small
portion of peat within the
cultivated area - 1,363 hectares
(slightly over 1% of our cultivated
land). This land was cultivated in
1999 - 2002 and the total area has
changed due to land acquisition
by Tenaga Nasional Berhad.
Biogass offset: Palm Kernel Shell
” Carbon sequestration Mill fuel offset - most
Methane from Palm ( PKS”) sales: PKS in the palm biomass. power generation in
Oil Mill Effluent is sold externally and Oil palm can act as a the mill is based on
captured and can be used as a ‘sink’ which fixes biomass (shell and
used for electricity or replacement for carbon and prevents fibre) with only a small
other energy usage, fossil fuels can be emissions into the volume of diesel used
avoiding emissions. offset as it reduces atmosphere. for back-up
emissions. generators. This leads
to avoid emissions and
can be offset.
Kulim (Malaysia) Berhad
10Emissions from oil palm
Gross Carbon Emissions by Source (MT CO2e) cultivation
Gross Carbon Emissions by Type (2016)
Land clearing and crop sequestration
Land clearing contributed 65.23% of Kulim’s
carbon emissions in 2016, constituting
0.27% 0.03%
a total of 734,449 MT CO2e, inclusive of
20.18% 734,449 Land clearing outgrower emissions. By far the biggest
22,205 Fertilisers share of these emissions derived from the
replanting of oil palm, with minor areas
44,907 N2O converted from rubber estates, sentang and
19,608 Field fuel arable crops. There has been no conversion
6.60%
2016 74,292 Peat
from non-agricultural land in our Malaysian
1.74% operations in 2015 and 2016.
3.99% 227,198 POME
The amount of carbon we emitted through
1.97% 3,030 Mill fuel
land clearing has been offset by the
65.23% 320 Grid emissions amount of carbon sequestered through the
planting of oil palms. Carbon sequestration
accounted for 667,826 MT CO2e in 2016,
resulting in net carbon emissions of 66,623
MT CO2e from land use. This 37% increase
from 2014 was partially due to replanting,
which reduce crop sequestration values
and partially due to increases in the default
values between PalmGHG V2 and V3.
Carbon footprint per tonne produced (MT CO2e per MT CPO/PK)
2014 2015 2016 Variation 2014-2016
KULIM 1.15 0.93 1.23 + 6.95%
Tereh Palm Oil Mill 0.71 0.90 1.37 +92.96%
Palong Palm Oil Mill 1.41 1.07 1.09 -22.70
Sedenak Palm Oil Mill 1.32 1.35 1.32 0
Sindora Palm Oil Mill 1.13 0.99 1.30 + 15.04%
Pasir Panjang Palm Oil Mill -- 1.22 0.82 -
Carbon Footprint Report 2016
11overview
Land use change default values
Previous Land Use PalmGHG Version 2 PalmGHG Version 3
Oil palm (mineral soil, estate) 199 234
Oil palm (peat soil, estate) 194 No distinction between mineral/peat
& estate/outgrower land
Oil palm (mineral soil, outgrower) 198
Oil palm (peat, outgrower) 188
Just over 27% of our crop was sourced from smallholders and outgrowers, accounting around 30% of our land clearing
emissions and 27% of our carbon sequestration total.
Field emissions (MT CO2e)
1,000,000
800,000
600,000
400,000
200,000
0.00
(200,000)
(400,000)
(600,000)
(800,000)
Land Crop Conservation
Fertilisers N20 Fuel Peat Total
clearing sequestration credit
Outgrowers (MT CO2e) 224,830.04 183,777.46 5,673.38 3,042.36 6,520.12 0.00 0.00 56,288.44
Own Crop + Group (MT CO2e) 509,618.56 484,048.25 16,531.95 41,864.82 13,087.39 74,292.04 (3,366.30) 167,980.21
Kulim (Malaysia) Berhad
12Fertiliser use and Nitrous Oxide (“N2O”) emissions
Fertiliser Emissions (MT CO2e)
GHG emissions resulting from fertiliser use in oil palm including Outgrowers
plantings contributed 67,112 MT CO2e or 5.96%, of our
total emissions in 2016. This represents 13.14% reduction 80
from 2014, where our fertiliser-related emissions totalled
77,267 MT CO2e. These emissions are generated through the 70
production, transportation and application of fertilisers in
60
the field in both our estates as well as those of outgrowers.
While we do have a long-term target to reduce fertiliser use
50
per hectare, the reduction seen since 2014 is primarily a
result of less fertilisers being used at the current stage in 40
the planting cycle.
30 49,514
38,382 44,907
20 27,753
21,869 22,205
10
2016 Emissions 0
2014 2015 2016
5.96%
from fertiliser use in
Fertiliser N2O
Oil Palm plantings
1.74%
from fossil fuel use
in field operations
Carbon Footprint Report 2016
13overview
The amount of CO2e emitted by each chemical component in a fertiliser
varies widely, from 44 kg to 2,380 kg CO2e per MT of fertiliser used (see the
table). N2O emissions derived from the nitrogen content are determined by
multiplying by a factor of 44/281.
Default values
Fertiliser Production Material kg C02e/MT
Ammonium Nitrate (AN) 2,380
Diammonium Phosphate (DAP) 460
Ground Magnesium Limestone (GML) 547
Ground Rock Phosphate (GRP) 44
Kieserite 200
Muriate of Potash (MOP) 200
Sulphate of Ammonia (SOA) 340
Triple Superphosphate (TSP) 170
Ammonium Chloride (AC) 1,040
Urea 1,340
Field fuel use
The use of fossil fuels i.e. diesel in our field operations contributed just 1.74%
of our total emissions in 2016. This includes fuel consumed by equipment,
vehicles and machinery in the transportation of materials and workers,
field maintenance, fertiliser application and FFB harvesting. The emissions
factor for diesel use is 3.12kg CO2e per litre (unchanged in V2 and V3).
Plantings on peatland
The cultivation of oil palm on peatland results in the microbial decomposition
of exposed organic carbon, thereby releasing GHGs including N2O into the
atmosphere. There is still significant uncertainty as to the factors that affect
the magnitude of these emissions, but they are likely to include drainage
depth, peat subsidence and the age of a plantation.
1
PalmGHG Version 1 guidelines: based on conversion of N2O (molecular wt.
44) to N2 (molecular wt. 28)
Kulim (Malaysia) Berhad
14Only 1.73% of the land cleared and cultivated in Kulim’s
estates and by our outgrowers is peatland. However, due
to the high emissions factor of peat, the contribution made
to our carbon footprint was significant, totalling 74,292 MT
CO2e or 6.6% of our total emissions including outgrowers in
2016.
To reduce peat emissions, Kulim has implemented best
management practices in compliance with the RSPO
Principles and Criteria. We actively monitor and control
water tables with a drainage depth of 60 cm to limit GHG
emissions from peatlands. In determining GHG emissions
from peatland, default emission values of 0.91 MT CO2e
per cm per year (or 54.6 MT CO2e per ha per year for 60 cm
drainage depth) and 16 kg N-N2O per ha per year are used, as
proposed by the PalmGHG calculator.
Carbon sequestration in conservation areas
Land that is conserved instead of being used for oil palm
cultivation can be included in carbon sequestration
calculations. We have established 1,042 hectares of set-
aside land, reducing our overall carbon footprint by 3,366
MT CO2e.
Emissions from palm oil production
Given that most of our field emissions are fixed, the vast
majority of our avoidable CO2e emissions derive from the
processing of FFB into CPO. There are two (2) emissions
factors at mill level: methane from POME and fuel for mill
use. The latter is insignificant for Kulim, as our operations
are largely powered by biomass, with only a small amount
of diesel which representing around 0.3% of our gross
emissions being used for machinery.
Carbon Footprint Report 2016
15overview
Palm Oil Mill Effluent (“POME”) methane emissions
POME emissions, which account for 99% of our total mill
emissions, increased 24% between 2014 and 2016. High
levels of methane emissions at our second largest mill at
Tereh Palm Oil Mill, which saw an overall emissions increase
of 59,893 MT over this period, contributed the majority
of this rise. The large increase was due to mill cleaning
processes that resulted in a higher volume of organic matter
being channeled into the effluent treatment area, as well as
a high COD value for raw effluent in PalmGHG V3.
Now equipped with a fully operational biogas facility,
our largest mill which is Sedenak Palm Oil Mill saw POME
emission reductions of more than 30,000 MT CO2e. However,
the reductions achieved were offset by cleaning processes
as in Tereh Palm Oil Mill and for the emissions increase at
Sindora Palm Oil Mill. Both Pasir Panjang Palm Oil Mill and
Palong Palm Oil Mill recorded reduced POME emissions.
In addition to the biogas facility at Sedenak Palm Oil Mill,
our new mill at Pasir Panjang has now commenced flaring
and we expect to commission our third biogas facility at
Sindora Palm Oil Mill in 2018. We anticipate reductions
of around 60% of total POME emissions once all three (3)
facilities are fully operated.
Sedenak palm oil mill biogas
Pome emissions
30,000 MT CO2e
total pome emissions
60% All three facilities
fully operational
Kulim (Malaysia) Berhad
16POME Emissions by Mills (MT CO2e)
100,000
82,319
81,509
80,000
52,301
47,368
48,980
43,523
60,000
35,793
36,798
33,010
31,977
33,115
30,743
22,426
40,000
21,634
20,000
0
Tereh Palong Sedenak Sindora Pasir Panjang
2014 2015 2016
Emissions credit from Palm Kernel Shell (“PKS”)
palm kernel shell used
PKS is a side product derived from the production of CPO for power generator
and PKO which currently used for power generation at our
own mills or for third party use. In 2016, we sold 14,603 MT of
PKS produced at our mills to external parties. PKS used as a
replacement for coal and other fossil fuels in the generation
32,127 MT CO2e
of power creates a carbon offset. Having monitored PKS Carbon Credit
usage since 2014, we have concluded that most of the
PKS we sell is used for this purpose and are thereby able
to incorporate a carbon credit of 32,127 MT CO2e for 2016,
which is greater than our total combined emissions from
fossil fuel use at mills and in the field that year.
Carbon Footprint Report 2016
174
Mitigation strategies
and reduction targets
Methane capture and biogas generation
At year end-2016, we had two (2) biogas plants installed and commenced operations at two of our palm oil
mills. We commissioned our first methane capture and power generation project in Sedenak Palm Oil Mill in
April 2014. This was a logical choice, as Sedenak Palm Oil Mill has the highest GHG emissions among all five (5)
mills owned and operated by Kulim. The Sedenak Palm Oil Mill facility is now fully operational and is capturing
around 30% of the methane generated. In 2016, it produced a total of 1,445,335 cubic metres of methane biogas
for power generation and flaring with the engine clocking 2,624 hours of operation.
A second plant was commissioned in Pasir
Panjang Palm Oil Mill in 2016, and flaring
Projected emissions reduction commenced in March 2017. This plant is able
from POME (MT CO2e) to utilise 100% of the POME generated and the
biogas will be channeled to the mill boiler once
the biogas production has stabilised.
(‘000) Under these projects, almost 90% of the
methane derived from POME degradation will
227,198
218,802
eventually be captured and channeled for
250
power generation in the mills and for flaring.
191,017
183,280
Overall, we expect these two (2) projects to
200 reduce our Malaysian emissions from POME by
151,148
around 50% over the coming five years.
143,623
132,901
115,689
Sedenak
150
99,700
Palm Oil Mill
30%
100
50 of methane generated
is captured
0 Year
‘12 ‘14 ‘15 ‘16 ‘17 ‘18 ‘19 ‘20 ‘21-25* Meanwhile, the proposed installation of biogas
plant at Tereh Palm Oil Mill and Palong Palm Oil
Mill – which was intended to facilitate exporting
of electricity to Tenaga Nasional Berhad’s grid -
was postponed until the Feed-in-Tariffs (FITs)
quota becomes available.
Kulim (Malaysia) Berhad
18The installation of biogas plants at the remaining palm
oil mills are now expected to complete by 2025 as per
requirement by the Department of Environment. This new
timeline will supersede our previous planning that the
installation was expected to be completed in 2017.
Fertiliser reduction
We are also addressing GHG emissions from the production,
transportation and use of chemical fertilisers as part of our
effort to reduce our environmental impact.
Excessive use of chemical fertilisers can lead to the
pollution of rivers and underground water sources. In order
to minimise this risk without affecting FFB yields, we have
embarked on a long-term organic fertiliser programme.
The collection of field data is already underway in order to
optimise our use of both organic and non-organic fertilisers. Updated emissions reduction targets
In addition, all Kulim mills have established composting
projects to recycle nutrients from Empty Fruit Bunches Kulim’s original target, published in our 2012 Carbon
(“EFB”) and POME back into the fields. Footprint Report, was to reduce our emissions overall
carbon emissions by 58% by 2020. This was primarily
Outgrower engagement based on the forecasted savings from our biogas initiatives.
However, this target was based on the assumption that our
In 2012, we began a long-term engagement process with all biogas programme would be fully operational by 2020 and
of our independent outgrowers, who we found to account on stable default values for land use change in the RSPO
for more than 30% of our total carbon footprint. This PalmGHG methodology. Since we have to postpone some
work has been continued and is now evolving into a full- of our biogas capture projects and due to the significant
scale programme to assist outgrowers in achieving RSPO changes in default values in the PalmGHG calculator, we
certification. So far, two (2) outgrower groups have achieved will be reviewing our overall targets during the course of
full certification and we continue to work with other groups 2017-2018 and will recalculate a target which reflects these
toward the same end. In addition, the certification of our changes.
smallholders under the Malaysian Government’s Malaysian
Sustainable Palm Oil (“MSPO”) Certification Scheme will be It is worth noting that we did in reduce emission significantly
underway by 2018. We believe that by driving the adoption through the PKS tracking initiative, the optimisation of
of good agricultural practices, including the efficient use fertiliser use and the re-categorisation of peat areas from
of fertilisers, these certification schemes will enable a 2012-2014. These are one-off savings that we expect to
continual reduction in GHG emissions among our third- sustain at the same level.
party FFB suppliers.
Carbon Footprint Report 2016
195
Methodology
PalmGHG
Unless otherwise noted, the calculations and definitions applied in this
report are based on the PalmGHG Calculator Beta Version 1a developed by
the RSPO Greenhouse Working Group 2. This version of the tool is in turn
based on the Global Warming Potential Assessment of Palm Oil Production
(“GWAPP”) model developed by Chase and Henson (2010).
The PalmGHG framework was developed to identify GHG emission
‘hotspots’ in the life cycle of palm oil, to enable internal monitoring of GHG
emissions and to assist palm oil producers in highlighting GHG emission
reduction opportunities and developing reduction plans.
Sources of emissions in the PalmGHG framework include:
• Land clearing.
• Production and transport of fertiliser.
• N2O and CO2 emissions from the application of fertilisers
in the field.
• Use of fossil fuels in plantations for planting work and
FFB harvesting, collection and transport to mills.
• Use of fossil fuels in mill operations.
• Emissions of CH4 from the anaerobic degradation of
POME from mills.
• CO2 and N2O emissions from cultivation on peat soil.
Kulim (Malaysia) Berhad
20GHG fixation and credits included in the PalmGHG Assumptions for carbon reduction
framework: targets
• CO2 fixation by the growth of palm trees. The projection assumes that only three (3) mills
• CO2 fixation by biomass in conservation areas. (Sedenak Palm Oil Mill, Sindora Palm Oil Mill and
• GHG emissions avoidance from the use of by- Pasir Panjang Palm Oil Mill) will have operational
products, such as palm kernel shells, as well as biogas plants within the next five (5) years. For
the use of electricity generated by biomass from Sedenak Palm Oil Mill, 50% of the total POME
the mills. produced by the mill will be used in biogas
production. As for Pasir Panjang Palm Oil Mill and
Exclusion of GHG emissions sources/sinks in the Sindora Palm Oil Mill, it is assumed that POME will
PalmGHG tool: be gradually diverted from conventional ponding
systems to biogas plants at the rate of 25% each year
• Nursery planting stage. until all (100%) POME is diverted to biogas plants.
• Pesticides manufacturing, transport and use.
• Fossil fuel use during land clearing activities. To ensure a conservative estimate it is assumed that
• Carbon footprint of infrastructure, plant and all biogas generated will be flared and will not be
equipment. used for electricity generation in mills (which would
• Carbon sequestration in palm end-products. generate a higher carbon offset). All other data,
• Work-related employee travels and commuting. including FFB throughput, land clearing and sources
of emissions and sequestration, are assumed to
Assumptions of the PalmGHG framework remain at 2014 conditions.
The PalmGHG tool provides a set of default values
that are used in areas where company specific
field data is unavailable. In this report, we use our
own field data wherever they are available and
can be verified from the records of our operations.
Elsewhere, default values are used, such as in the
case of determining GHG emissions from land use
change, peat emissions, as well as the production
and field application of fertiliser. Additionally, a
number of emission factors were also based on
the default values provided in the PalmGHG tool,
including for POME conversion to methane, fossil
fuel and grid electricity offset.
Carbon Footprint Report 2016
216
base data
Emissions data 2016 (PalmGHG Version 3)
DESCRIPTION UNIT PALONG SEDENAK SINDORA TEREH PASIR
COCOA PALM OIL PALM OIL PALM OIL PANJANG
PALM OIL MILL MILL MILL PALM OIL
MILL MILL
MT CO2e/ 1.23
Crude Palm Oil
MT CPO 1.09 1.32 1.30 1.37 0.82
MT CO2e/ 1.23
Palm Kernel
MT PK 1.09 1.32 1.30 1.37 0.82
Net Emission MT CO2e/yr 47,758 154,043 72,910 108,434 38,739
Land Clearing MT CO2e/yr 118,436 249,789 120,509 133,127 112,588
Crop Sequestration MT CO2e/yr - 111,680 - 229,031 - 97,282 - 123,115 - 106,718
Fertiliser Production & MT CO2e/yr 3,181 5,998 3,792 4,741 4,493
Transport
Fertiliser Application (N2O) MT CO2e/yr 7,101 18,953 5,527 8,375 4,952
Field Fuel Use MT CO2e/yr 2,175 7,192 3,205 3,383 3,653
Peat Land Emissions MT CO2e/yr - 74,292 - - -
Conservation Area Offset MT CO2e/yr - 241 - 322 - 14 - 352 - 2,437
Methane from POME MT CO2e/yr 30,743 48,980 43,523 82,319 21,634
Mill Fuel Use MT CO2e/yr 249 989 368 713 711
Mill Electricity Supply Offset MT CO2e/yr - 2,414 - 22,798 - 6,829 -756 -135
GHG Emission by FFB Source (exclude emission from mill activities)
Own Crops MT CO2e/yr 15,338 99,896 12,153 21,955 16,530
Group MT CO2e/yr - 2,019 - 90 -
Outgrowers MT CO2e/yr 3,634 24,957 23,584 4,114 -
Kulim (Malaysia) Berhad
22Emissions data 2015 (PalmGHG Version 3)
DESCRIPTION UNIT PALONG SEDENAK SINDORA TEREH PASIR
COCOA PALM OIL PALM OIL PALM OIL PANJANG
PALM OIL MILL MILL MILL PALM OIL
MILL MILL
MT CO2e/ 1.13
Crude Palm Oil
MT CPO 1.07 1.35 0.99 0.90 1.22
MT CO2e/ 1.13
Palm Kernel
MT PK 1.07 1.35 0.99 0.90 1.22
Net Emission MT CO2e/yr 50,479 170,068 63,194 75,035 62,351
Land Clearing MT CO2e/yr 124,121 250,435 125,083 134,697 122,531
Crop Sequestration MT CO2e/yr - 117,074 - 201,181 - 102,193 - 124,989 - 110,641
Fertiliser Production & MT CO2e/yr 3,645 4,237 2,330 3,554 8,104
Transport
Fertiliser Application (N2O) MT CO2e/yr 6,242 17,263 3,075 6,070 5,733
Field Fuel Use MT CO2e/yr 1,800 8,056 4,046 3,922 4,376
Peat Land Emissions MT CO2e/yr - 74,364 718 - -
Conservation Area Offset MT CO2e/yr - 241 - 170 - 14 - 326 - 2,495
Methane from POME MT CO2e/yr 33,115 35,793 33,010 52,301 36,798
Mill Fuel Use MT CO2e/yr 328 1,421 336 590 497
Mill Electricity Supply Offset MT CO2e/yr - 1,604 - 20,149 - 3,317 - 784 - 2,552
GHG Emission by FFB Source (exclude emission from mill activities)
Own Crops MT CO2e/yr 15,025 99,246 8,929 18,838 27,608
Group MT CO2e/yr - 432 840 13 -
Outgrowers MT CO2e/yr 3,466 53,325 23,276 4,076 -
Carbon Footprint Report 2016
23base data
Production data
Description Unit 2016 2015 2014 2013 2012
Palm Products
Crude Palm Oil MT CPO/yr 273,354 294,255 257,881 254,735 217,146
Palm Kernel MT PK/yr 70,030 78,290 69,681 70,891 61,464
FFB Production
Own Crop MT FFB/yr 974,881 990,629 845,257 774,615 647,628
Outgrowers MT FFB/yr 364,778 419,994 407,568 494,115 433,454
Planted Area
Own Crop Ha 56,097 55,935 55,976 53,729 50,065
Outgrowers Ha 22,816 23,095 20,328 20,328 20,328
Fertiliser
Own Crop MT/yr 62,642 60,376 23,450 25,202 21,303
Outgrowers MT/yr 7,671 5,925 5,941 10,143 12,117
Field Fuel Use
Own Crop liters/yr 2,960,339 4,439,149 4,904,199 3,186,046 2,557,688
Outgrowers liters/yr 2,090,917 2,691,904 1,909,507 1,648,730 1,481,951
Mill Fuel Use liters/yr 971,047 1,016,824 676,298 721,522 878,882
Data collections and limitations Crop sequestration:
Calculation of carbon sequestration from the planting of new
There are two distinct sets of data used in this report. palm trees is estimated from the default values provided in
Each set of data has associated challenges and scope for the PalmGHG calculator. These default values are obtained
improvement. from the OPRODSIM and OPCABSIM models2 recommended
in the calculator. Kulim does not presently have in place a
In-house data from estates and mills practice of making on-site measurements of the biomass
growth of its own palm trees.
Primary emissions data from Kulim’s estate and mills
were obtained from statistics and monitoring undertaken Peat emissions:
by Kulim’s Estates and Engineering Departments. These While the peat areas within Kulim-owned estates are being
data are assumed to have a high level of accuracy, actively monitored and controlled for water table levels,
although continuous efforts to increase robustness will similar monitoring and control cannot be ascertained for
be undertaken. Two areas in particular may contribute to outgrowers’ operations. Kulim is in the process of identifying
significant improvements: these outgrowers within the supply chain and will work with
them to preserve peatlands from degradation.
Kulim (Malaysia) Berhad
24Outgrower data
The second set of data relate to outgrowers’ crops. Kulim’s external crop
is primarily purchased from third-party FFB traders who do not disclose
the source of FFB. In order to allow some level of monitoring, data were
collected using interviews and questionnaires sent to FFB traders and
smallholders. Kulim has assigned dedicated personnel to engage these
stakeholders in the process. A number of factors were found to contribute
to a high margin of error:
Diversity of suppliers: All the respondents replied and provided the
requested data. The data supplied suggested vast differences between
suppliers due to variations in previous land use profiles.
Insufficient record keeping: Quality of record keeping varies significantly
and may lead to a high level of uncertainty. This includes records of previous
land use over the past three decades and the identification of mineral soils
versus peatlands.
Emissions from non-palm related activity. It is assumed that all the
fertilisers and fuels purchased by smallholders and outgrowers are used for
oil palm cultivation and harvesting activities. However, it is likely that these
resources may be used for other purposes, such as for the cultivation of
additional crops or private transport. A more detailed methodology would
therefore apportion resource use between palm and non-palm related
activities.
Despite these shortcomings, we believe that this is still an improvement
over the standard assumption that a company’s FFB and externally sourced
FFB have similar carbon profiles. Our calculations so far indicate that this is
not the case. In addition, we believe that external FFB data can be improved
over time as engagement with traders and external suppliers continues and
levels of trust and transparency increase.
2
OPRODSIM (Oil Palm Production Simulator) and OPCABSIM (Oil Palm
Carbon Budget Simulator) are oil palm models specifically designed to
estimate oil palm and associated biomass in the plantation (litter and
ground cover) by generating growth curves based on climate and soil data,
largely based on Malaysian conditions.
Carbon Footprint Report 2016
257
Glossary
Biogas is a mixture of methane and carbon dioxide produced by the bacterial decomposition of
organic wastes and used as a fuel.
Biomass is biological material derived from living or recently living organisms. In the context of
biomass for energy this is often used to mean plant based material, but biomass can equally apply
to both animal and vegetable derived material.
Carbon dioxide (CO2) is the most widespread greenhouse gas. CO2 is released to the
atmosphere through natural and human activities, including fossil fuel and biomass burning,
industrial processes, and changes to land use, among others. Carbon dioxide accounts for 76.7%
of greenhouse gas emissions, with 13.5% arising from agriculture and 17.4% from forestry.
Carbon dioxide equivalent (CO2e) is a unit of measurement used to compare the climate
effects of all greenhouse gases to each other. CO2e is calculated by multiplying the quantity of
a greenhouse gas by its global warming potential. The standard form of labelling emissions is
therefore to express them as carbon dioxide equivalents or CO2e.
Carbon footprint is the amount of carbon dioxide and other carbon compounds emitted
through the activities of a particular person or group. Reports on these emissions for an operation
or product are also referred to as carbon reports or carbon footprints.
Kulim (Malaysia) Berhad
26Carbon sequestration/carbon sink describes the process by which vegetation captures carbon
dioxide from the atmosphere through the process of photosynthesis, and releases oxygen and some carbon
dioxide through respiration. Part of this carbon is retained in vegetation as biomass. Because around half of
the biomass of a plant is carbon, as the plant grows and adds biomass it also adds or sequesters carbon. This
is a natural process but it can be enhanced, for example by planting trees on land that has not previously
had trees will sequester more carbon because of the increase in biomass. The term ‘sink’ is used to mean
any process, activity or mechanism that removes a greenhouse gas from the atmosphere.
Greenhouse gases (GHGs) are an important part of the earth’s natural cycle, keeping the planet warm
enough to sustain life. Human activities are upsetting the balance, increasing the concentration of GHG to
the point where rising temperatures threaten livelihoods, ecosystems and economies. The major GHGs and
their contribution to the greenhouse effect (rounded up) are: water vapour (60%); carbon dioxide (26%);
methane (5%); ozone (4%); fluorinated gases (4%); and nitrous oxide (2%).
Palm products is a versatile oil and fat products intended for wide range application that being used in
everyday items. Kulim (Malaysia) Berhad is in production of Fresh Fruit Bunches (“FFB”), Crude Palm Oil
(“CPO”) and Palm Kernal (“PK”).
Carbon Footprint Report 2016
278 9
References
PalmGHG:
A Greenhouse Gas Accounting Tool for Palm
Products Greenhouse Gas Working group 2
Roundtable on Sustainable Palm Oil (RSPO) -
Laurence Chase, Ian Henson, Amir Abdul-Manan,
Fahmuddin Agus, Cécile Bessou, Llorenç Milà i
Canals, Mukesh Sharma.
PAS 2050:2011:
Specification for the assessment of the life cycle
greenhouse gas emissions of goods and services.
Carbon Trust and DEFRA UK.
Kulim (Malaysia) Berhad
289
About
this report
This report covers Kulim’s oil palm operations in Malaysia
for the calendar years 2015 and 2016. Data, commitments
and targets do not cover Kulim’s operations in Indonesia,
which were initiated in 2014.
The data in this report are presented on a best-effort basis
and may be subject to change. The data were collated
in-house and screened and analysed by a third party
consultant from Helikonia Advisory Sdn Bhd. The data have
not been subject to independent verification or assurance.
We welcome feedback and questions.
Please contact:
Salasah Elias
Kulim (Malaysia) Berhad
c/o Ulu Tiram Estate, Ulu Tiram, K.B 705
80990 Johor Bahru, Johor
Tel : +607 861 1611 / +607 862 2000
Email : salasah@kulim.com.my
Designed by Affinity Worldwide Sdn. Bhd.
Carbon Footprint Report 2016
29Kulim (Malaysia) Berhad (23370-V) Level 16, Menara KOMTAR Johor Bahru City Centre 80000 Johor Bahru Johor Darul Takzim, Malaysia T: +607 226 7692 / +607 219 5077 F: +607 222 3044 www.kulim.com.my
You can also read