AUSTRALIA'S AGEING POPULATION - 02/2019 Report No - Parliament of Australia
←
→
Page content transcription
If your browser does not render page correctly, please read the page content below

AUSTRALIA’S AGEING
POPULATION                         Report No.
                                   02/2019
Understanding the fiscal impacts
over the next decade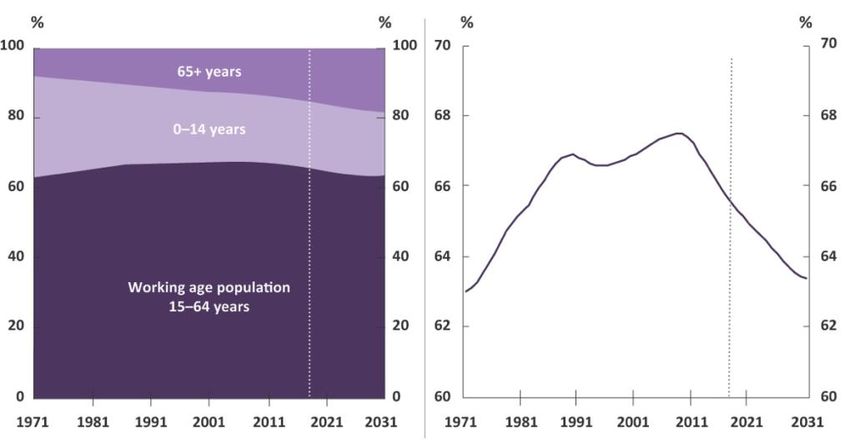
© Commonwealth of Australia 2019

ISBN 978-0-6483701-1-6 (online)

Copyright notice
This work is licensed under the Creative Commons Attribution-NonCommercial-NoDerivs
3.0 Australia License http://creativecommons.org/licenses/by-nc-nd/3.0/au/

Attribution
This publication should be attributed as follows: Parliamentary Budget Office, Australia’s
ageing population: Understanding the fiscal impacts over the next decade

Use of the Coat of Arms
The terms under which the Coat of Arms can be used are detailed on the following
website: www.itsanhonour.gov.au/coat-arms

Feedback
If you found this report useful, or have suggestions for improvement, please provide
feedback to feedback@pbo.gov.au.

ii
AUSTRALIA’S AGEING POPULATION:
Understanding the fiscal impacts over the next decade

Contents
Overview                                                                                            iv

1      Ageing and the budget                                                                        1
1.1    Why does population ageing matter to the budget?                                             1
       Box 1: What is meant by the ‘cost’ of ageing?                                                2
1.2    What are the drivers of population ageing?                                                   3
1.3    What is the aggregate cost to the budget expected to be?                                     4
       Box 2: How does this analysis fit with the Intergenerational Report?                         7

2      Breaking down the cost of ageing                                                             8
2.1    Slowing labour force growth reduces growth in tax revenue                                    8
2.2    Ageing increases welfare and caring expenditure                                             11
       Box 3: Age Pension qualifying age                                                           14
       Box 4: What are the key components of Commonwealth
              aged care spending?                                                                  16
2.3    Impact of ageing on other spending                                                          18

This report was prepared by Sam Pelly and Anupam Sharma, with the benefit of comments from Linda Ward, Tim Pyne and
Paul Gardiner. The report also benefited from comments from external referees, namely Dr Ralph Lattimore PSM
(Productivity Commission) and Mr David Tune AO PSM. The contents of the report are the sole responsibility of the
Parliamentary Budget Office.

                                                                                        AUSTRALIA’S AGEING POPULATION   iii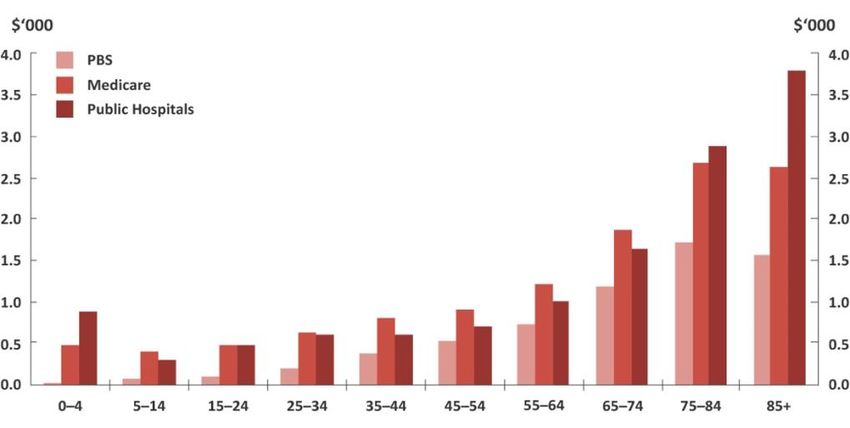
Overview
     This report builds on the 2015 Intergenerational Report by providing a detailed analysis
     of the impacts of an ageing population on revenue and spending over the next decade.

     The effects of ageing will be felt more over the coming decade than in the past due to the
     impact of the baby boomer generation retiring.
     This change has already begun to detract from economic growth, after decades of providing a boost
     to growth.
     Ageing will reduce tax revenue and add to spending pressures…
     Since 2011 – when the first of the baby boomer generation turned 65 – the share of the population
     of retirement age has increased significantly and the share of the population of prime working age
     has begun to fall.
     This flows through to the budget in the form of a reduction in revenue, due to lower labour force
     participation, and an increase in spending, reflecting greater demand for government programs that
     support older Australians.
     Over the next decade, the ageing population is projected to subtract 0.4 percentage points from the
     annual real growth in revenue and add 0.3 percentage points to the annual real growth in spending.
     In real dollar terms, this equates to an annual cost to the budget of around $36 billion by 2028–29.
     This is larger than the projected cost of Medicare in that same year.
     …with the budget impact coming in waves.
     The workforce participation and Age Pension impacts of the baby boomer generation reaching
     retirement age are already evident and are likely to peak during the next decade.
     The impacts on health and aged care spending will increase more gradually and peak later, as baby
     boomers move into their 70s and 80s. Demand for health services typically starts to increase when
     individuals are in their 70s, and demand for aged care services when they are in their 80s.
     Expectations of Australians around increases in the quality of health and aged care services
     could further increase these costs.
     However, ageing is only one of many drivers of the future budget position.
     The influence of ageing should be considered in the context of the overall budget position.
     Ageing is estimated to detract around $20 billion in real terms from revenue in 2028–29, but
     population and income growth are expected to increase revenue by around $187 billion (resulting in
     a net increase in 2028–29 in the order of $166 billion).
     Similarly, while ageing is projected to add around $16 billion in real terms to Commonwealth
     spending in 2028–29, broader factors such as population growth and indexation of payments are
     expected to increase spending by around $104 billion (resulting in a total increase in 2028–29 in the
     order of $119 billion).

iv   AUSTRALIA’S AGEING POPULATION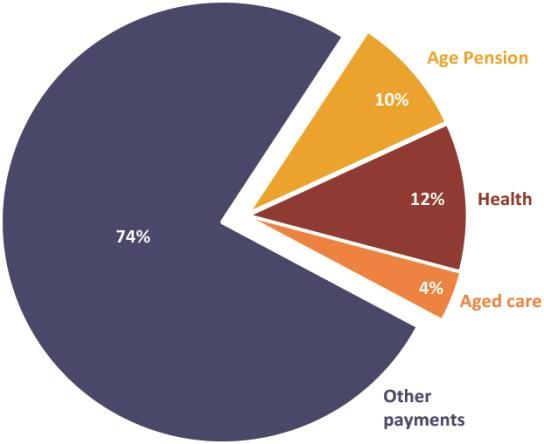
1 Ageing and the budget
1.1       Why does population ageing matter to the budget?
Population ageing is often thought of as a distant challenge for the economy and the budget. While it
is true that ageing is a long-term process and the financial costs accumulate over time, Australia is in
the midst of a particularly significant phase of demographic change.
The 2015 Intergenerational Report presented this ageing impact over the long term, that is, the next
40 years. This PBO report uses a broadly comparable approach to quantify the impact of demographic
change on the budget over the coming decade.
The impact of ageing on the budget arises through both an increase in spending (such as on the
Age Pension) and a decrease in revenue (particularly reduced income tax collection).
While the concentration of Australia’s population aged 65 and over will continue to increase over the
next century, the rate of progression of this demographic change will vary. Changes during the next
couple of decades will be particularly significant.1
The ageing of the baby boomer generation will affect the budget in waves. The movement of
the baby boomer generation to retirement age is already reducing labour force participation and
increasing the take-up of the Age Pension.2 As this large group grows older, individual demand
for health services will increase, and there will be an increasing demand for aged care.
Figure 1–1 shows the annual increase in the number of people in each of three older age groups
(aged 65 to 74, aged 75 to 84, and 85 years of age and over). The increase around 2010 in the number
of people turning 65 years of age corresponds with the oldest of the baby boomers reaching that age.
The ‘peaks’ over the subsequent two decades reflect movements of baby boomers into these older
age groups.
These waves of ageing have a cumulative impact on revenue and spending in the budget as the number
of people within each age group grows each year. The peak in annual increases in the 65 to 74 age group
occurred around 2012, however, annual increases continue to hold strong across the medium term
resulting in a significant impact on the Age Pension in particular. Across the medium term, the
annual increase in those in the 75 to 84 age group builds, with the highest annual increase occurring
in the early 2020s. From the early 2020s, the annual increase in the 85 years and older age group
also starts to grow, peaking in the early 2030s. Note that the peaks of ageing are lower in each age
group due to the impact of mortality.

1   ABS, 2018
2   The increase in Age Pension take-up is in both absolute terms and as a proportion of the total population.
                                                                                           AUSTRALIA’S AGEING POPULATION   1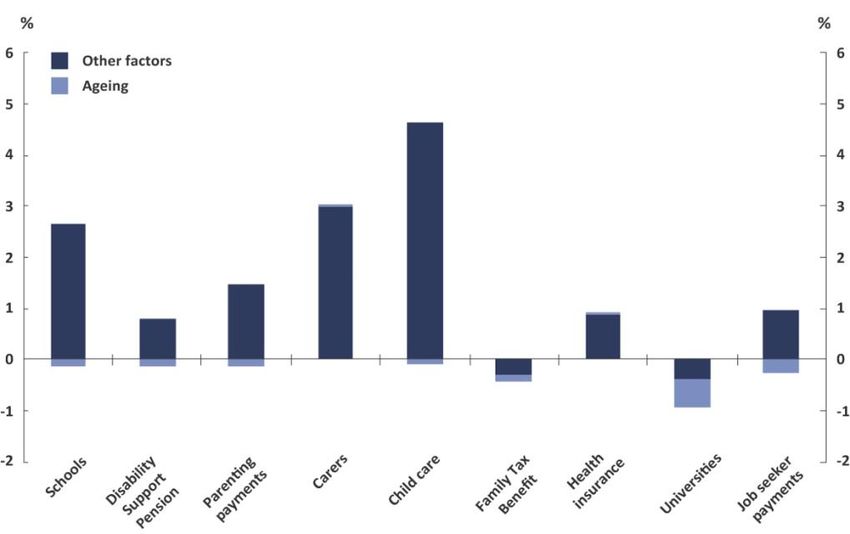
Figure 1–1: Rate of increase in older age groups
                                      Annual increase in the number of people by age group

                   Note: All population projection charts use series B of the Australian Bureau of Statistics population
                   projections unless noted otherwise. Lines are smoothed using a moving average. Dotted line
                   indicates the break between historical and projected results.
                   Source: ABS, 2018.

        Box 1: What is meant by the ‘cost’ of ageing?
        In this report, the PBO quantifies the cost of ageing on the budget. We use our 2018–19
        Budget medium-term projections as the base to do this. 3
        Our projections take account of both growth in the total population and changes in the age
        structure of the population. As such, the impact of the ageing population is embedded in our
        projections of spending and revenue.
        The concept of an ageing population relates to the increasing proportion of older people in
        the population. For example, over the next decade, annual growth in the total population is
        expected to average 1.5 per cent, whereas annual growth in the population aged 65 and over
        is expected to average 2.9 per cent. The impact of ageing measured in this report can be
        understood as the extra cost to the budget of that demographic change. That is, the budget
        cost of the older population growing faster than total population growth.
        It is important to note that the measured impact of ageing does not represent the total cost
        or saving from a policy targeted at older Australians. For example, the total budget saving over
        the next decade from increasing the Age Pension qualifying age is not the ageing impact of this
        policy change. The ageing impact captures only that part of the budget saving that is caused by
        the changing age structure. Other non-demographic factors, such as the indexation of the
        payment and take-up by different age groups, are not included.
        Further information on the PBO’s methodology is provided at Appendix A.

    3     The analysis in this report would not be expected to vary significantly from budget update to budget update.
2   AUSTRALIA’S AGEING POPULATION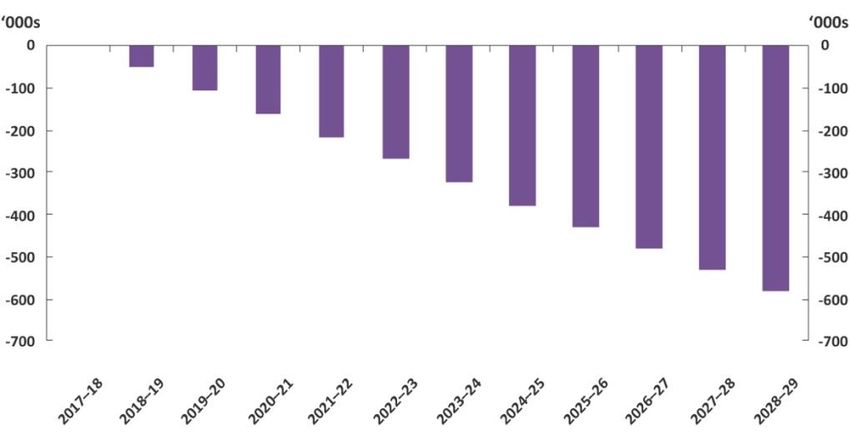
1.2       What are the drivers of population ageing?
Population ageing occurs when the proportion of older people in the population grows over time.4
Declining fertility rates and increasing life expectancy are the primary drivers of this phenomenon.
In Australia, fertility rates have fallen from the ‘baby boomer’ peak of 3.5 children per woman in the
early 1960s to 1.8, which is below the replacement rate.5 This, coupled with a considerable increase
in average life expectancy from 71 to 83 years over that period, has resulted in an increased share of
older people in the population.
Migration has also had a profound influence on Australia’s population structure. Indeed, Australia
has maintained one of the highest net migration rates in the developed world since World War II,
resulting in a significant increase in the working age population.6 Migrants to Australia are younger
than the population on average and also serve to boost the birth rate by increasing the number of
people of reproductive age. These effects mean migration can slow the pace of population ageing.7
The old-age dependency ratio is a simple and commonly-used measure of population ageing.
It illustrates the relative size of the retired to working-age population; that is, a ratio of those aged
65 and over to the prime working-age population (15 to 64 years of age).

                                        Figure 1–2: Old-age dependency ratio
                             Number of retirement age people to 100 working age people

             Source: ABS, 2014 and ABS, 2018

4   While population ageing can be defined and measured in a number of ways, this report focusses on the increasing
    proportion of the population aged over 65.
5   The replacement fertility rate is the rate required to maintain the existing population level. The total fertility
    rate necessary for replacement is around 2.1.
6   Australia’s net migration since 1950 ranks among the highest of OECD countries (UN, 2017).
7   There are limits to the benefit from migration on the age structure as these impacts do face diminishing returns
    as migration rates are increased. See McDonald and Kippen, 1999; McDonald, 2017.
                                                                                               AUSTRALIA’S AGEING POPULATION   3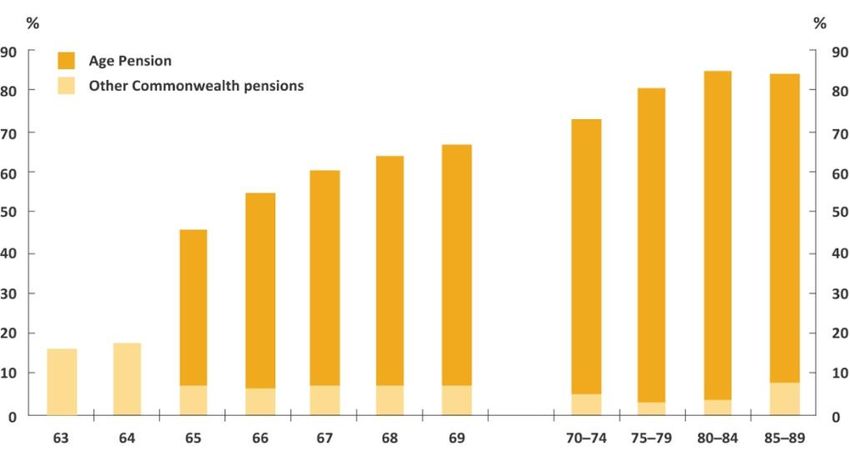
The old-age dependency ratio increased steadily in Australia between 1971 and 2011, rising from
    13 to 21 people over age 65 for every 100 working age people. Since 2011, when the oldest of the
    baby boomer generation turned 65, the rate of increase in the old-age dependency ratio has doubled
    compared to the previous two decades (Figure 1–2). Between 2011 and 2031, the number of people
    of retirement age per 100 working age people is projected to increase from 21 to 29.8 The rate of
    increase in the old age dependency ratio is projected to slow considerably after 2031, with little change
    expected between then and 2051, before returning to a rate of increase more akin to that prior to 2011.
    The rapid rise in the old-age dependency ratio over the next decade provides an indication that this
    will be a unique period of population ageing for Australia. Public understanding of the fiscal implications
    of that ongoing demographic change on the budget is important.

    1.3       What is the aggregate cost to the budget expected to be?
    This report provides an analysis of the impacts of an ageing population on revenue, spending and the
    budget balance over the next decade. This is the period where the rate of adjustment and increased
    pressure from demographic change appears likely to be historically unique.
    The fiscal cost of an ageing population is projected to progressively build. By 2028–29, on current
    projections, ageing is projected to reduce the budget balance by around $36 billion.9 This represents
    the combined fiscal implications from the dampening of growth in revenue and the boost to growth
    in spending over the next decade (Figure 1–3). Revenue is projected to fall by around $20 billion as a
    result of ageing, while spending is expected to increase by around $16 billion. This net effect is greater
    than the projected cost in that same year for any one of Medicare, the National Disability Insurance
    Scheme, Commonwealth funding for schools and hospitals, Family Tax Benefit or the Disability Support
    Pension – all of which are amongst the top ten spending programs in the Commonwealth budget.

                    Figure 1–3: Projected impact of ageing on the budget balance in 2028–29
                                                          2017–18 dollars

                 Note: An increase in spending is presented as a negative because it decreases the budget balance.
                 Source: 2018–19 Budget and PBO analysis

    8   Another way of expressing this would be 4.9 working age people per retirement age person (age 65 and over) in 2011,
        falling to 3.5 in 2031.
    9   All dollar values in this report are in 2017–18 dollars. Revenue, spending and budget balance figures are on a cash basis.
4   AUSTRALIA’S AGEING POPULATION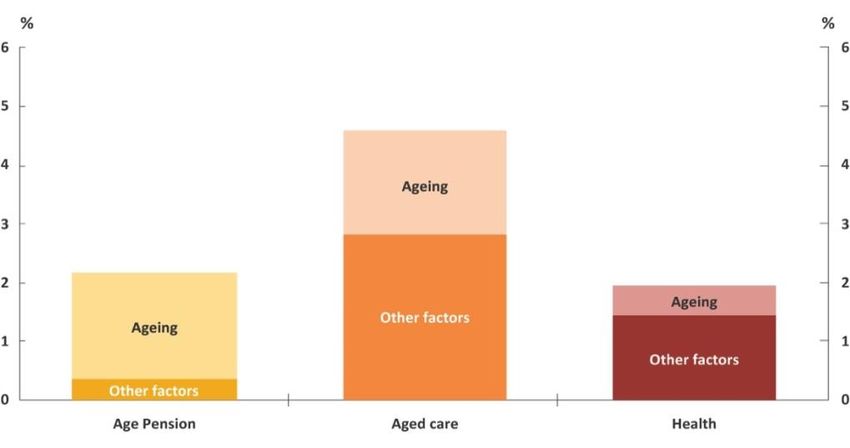
Demographic change is projected to slow labour force growth, reducing national income and hence
tax revenue. On the spending side, there is projected to be greater demand for government programs
that support older Australians, in particular the Age Pension, aged care and health (see section 2 for
further details).
The budget impact of ageing continues to increase each year over the next decade. This is illustrated
in Figure 1–4, which compares the PBO’s projections of spending and revenue to a projection under a
scenario without ageing. The gap between the two spending scenarios (and the two revenue scenarios)
will continue to widen over time as Australia’s population is expected to continue to age over the
entire 21st century.
These fiscal projections are based on the macroeconomic projections, policy settings and the
medium-term fiscal strategy underlying the 2018–19 Budget. The PBO’s 2018–19 baseline projections
of revenue and spending result in the budget surplus reaching 1.3 per cent of gross domestic product
(GDP) by 2028–29. This analysis suggests that were it not for population ageing, the budget surplus
would have been improved by a further 1.5 per cent of GDP by 2028–29.

                           Figure 1–4: Projections of revenue and spending
                                               2017–18 dollars

           Source: 2018–19 Budget and PBO analysis

Looking at the ageing impact in growth terms shows the average annual budget impact of population
ageing. Ageing is projected to subtract 0.4 percentage points from the average annual real growth in
revenue and add 0.3 percentage points to average annual real growth in spending over the next decade
(Figure 1–5).

                                                                           AUSTRALIA’S AGEING POPULATION   5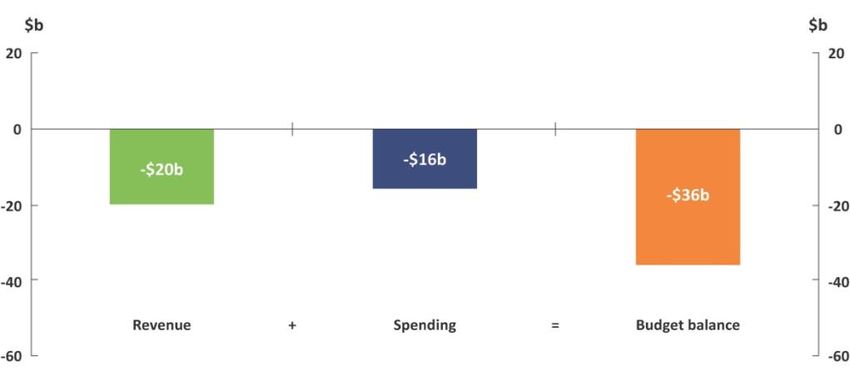
Figure 1–5: Average annual real growth in revenue and spending over the next decade

                Source: 2018–19 Budget and PBO analysis

    While the accelerated impact of demographic change on the budget is undoubtedly significant, it is
    also important to consider the cost of ageing in the broader context. As Figure 1–5 illustrates, ageing
    is only one factor driving the growth in revenue and spending over the next decade. Other factors are
    much more significant drivers of revenue and spending.
    Although revenue is projected to fall by $20 billion as a result of ageing over the decade, total revenue
    is estimated to increase by $166 billion in real terms over the same period.10 Other factors affecting
    revenue include growth in income, consumption and population.
    Likewise, the $16 billion cost of ageing on spending occurs in the context of the projection of total
    spending increasing by $119 billion in real terms. Other factors affecting spending include
    population growth, indexation of payments over inflation and increased usage of programs by
    individuals.11

    10 These figures relate to the difference between revenue at the start of the projections period in 2017–18 and the end of
       the period in 2028–29.
    11 A detailed analysis of trends in program-related spending over the next decade is set out in the PBO’s 2018–19 Budget:
       medium-term projections report.
6   AUSTRALIA’S AGEING POPULATION
Box 2: How does this analysis fit with the Intergenerational Report?
While there have been a number of studies, particularly the series of Intergenerational
Reports (IGR), that have looked at the impact of ageing on the budget, these have focussed
on a long-term time horizon.
Given the PBO’s focus in its research program on fiscal sustainability over the medium term,
this report provides additional information to help understand the impact of ageing over the
next decade.
It builds on the 2015 IGR analysis in two key ways.
Firstly, it includes a more detailed analysis of the revenue impact of an ageing population and
how demographic change influences revenue growth.
Secondly, it provides greater visibility on which areas of the budget will drive the ageing impact
on spending. For example, while the IGR implicitly included the impact of ageing in its
spending projections, it only specifically quantified the cost of ageing on total health spending.
The PBO’s detailed medium-term spending models of health, aged care and social security
spending allow for the analysis of the impact of ageing at a program level.
The analysis in this PBO report is intended to complement the IGR, which remains an important
document to help understand how the Australian economy and budget will change over the
next 40 years.
AUSTRALIA’S AGEING POPULATION 72 Breaking down the cost of ageing
Breaking down the budget costs associated with ageing requires a more detailed examination of the
way in which it flows through to revenue and spending.
2.1 Slowing labour force growth reduces growth in tax revenue
As shown earlier, population ageing is projected to detract 0.4 percentage points from annual real
growth in Commonwealth revenue over the next decade (Figure 1–5). This translates to the level of
revenue being 0.8 per cent of GDP lower in 2028–29 than in the absence of ageing.
The impact of ageing on revenue stems from the impact of demographic change on the size of the
workforce, with flow-on effects to national income and therefore revenue.
Broadly speaking, a fall in labour force participation directly influences economic growth by shrinking
the labour resources available for producing goods and services. The shrinking labour force flows
through to national income through lower earnings and company profits. Lower national income
translates directly through to lower revenue through reduced tax collections from income and
consumption, principally personal income tax and company tax.
The impact of ageing on the labour force is illustrated in Figure 2–1, which shows the reduction in the
size of the labour force between an ageing and ‘no-ageing’ scenario. This suggests that the size of the
labour force would be close to 600,000 workers higher by 2028–29 in the absence of ageing. Looking
at this from a participation perspective implies that participation rates will be in the order of
2.4 percentage points lower on account of this demographic change. This is despite the fact that
participation rates of older people are expected to continue to increase over the projection period.
Figure 2–1: Projected change in the labour force size due to ageing
Numbers of workers
Source: 2018–19 Budget and PBO analysis
8 AUSTRALIA’S AGEING POPULATIONTaking a closer look at population trends by age group helps to understand the trends in labour
force participation. Although the population has been ageing for many decades, until the start of this
decade the net effect of demographic change has been to increase the proportion of the population
of working age, from 63 per cent in 1971 to a peak of 67.5 per cent in 2009 (Figure 2–2 and
Figure 2–3).
Over this period, while the Australian population was ageing (that is, the proportion of the population
aged 65 and over was increasing) the proportion of children was falling at a faster rate, resulting in a
concentration of the population in the ‘working age’ years. In this way, Australia’s large baby boomer
generation, combined with a significant increase in female workforce participation rates, provided a
boost to economic growth from the early 1970s to the early 2000s.
With the large baby boomer population reaching retirement age this trend has turned, with the
proportion of the working-age population beginning to shrink, detracting from labour force growth.
Despite this, the labour force is still projected in the budget to grow in absolute terms, due to
ongoing population growth.
Figure 2–2: Population by Figure 2–3: Working
age group age population share
15–64 years old
Note: Dotted line indicates the break between historical and projected results.
Source: ABS, 2018
2.1.1 Other factors
In addition to the labour force impacts, there are other potential sources of interaction between
demographic change and Commonwealth revenue. These factors, discussed below, have not been
included in this analysis of the ageing impact on revenue as their impact is generally less certain and
considered less significant than the effect on labour force participation.
Composition of the tax base
Changing patterns of income and consumption due to an ageing population will affect the tax base of
Commonwealth revenue, interacting with areas of personal income tax that are concessionally taxed
or items exempt from the Goods and Services Tax (GST).
AUSTRALIA’S AGEING POPULATION 9Assets held in superannuation will continue to grow strongly until the system is mature, that is, when
Australians are retiring having earned superannuation their entire working lives. Income earned on
assets held in a superannuation fund incurs a 15 per cent tax rate. Once an individual’s fund moves
assets into the ‘retirement phase’, permitted once a person reaches their preservation age (age 55 to
60), income on superannuation assets is generally tax-free. Australia’s ageing population will mean a
greater share of the national income that is generated from superannuation assets will be tax-free
which will add to an ageing-related detraction to revenue. Similarly, a greater retired population may
mean a greater proportion of national income is earned from capital gains on assets used to fund
retirement, which are generally taxed at a lower rate compared to wages income.
In a similar vein, retirees tend to spend less than working-age people and can have a higher
proportion of spending on GST-free categories, particularly health care.12 This could lead to GST
revenue falling as a share of GDP.
Labour productivity
Labour productivity measures how much is produced, on average, for each hour worked. Growth in
labour productivity is a key determinant of national income growth, and hence revenue growth. 13
Population ageing has been purported to affect labour productivity through several channels.
This includes the potential that an older workforce is a less productive workforce, and the potential
that consumption patterns of older consumers will shift capital and labour to industries that have
higher labour to output shares, such as health care.
However, a range of studies have concluded that potential productivity effects of the ageing population
are likely to be small.14 The PBO has not included any productivity effects in the estimated impact
of ageing.
12 PC, 2013; PBO, 2018a
13 Labour productivity growth is a combination of capital deepening (growth in the ratio of capital to labour inputs) and
multifactor productivity growth (a broader measure of productive efficiency that accounts for both labour and capital
inputs). See PBO, 2017 for further details.
14 PC, 2005. Similar conclusions are contained in more recent research: National Research Council, 2012; Burtless, 2013.
10 AUSTRALIA’S AGEING POPULATION2.2 Ageing increases welfare and caring expenditure
Spending is projected to grow by 2.1 per cent annually in real terms over the next decade. Of this
growth, 0.3 percentage points is estimated to be due to ageing (Figure 1–5). This translates to ageing
increasing total spending by 0.7 per cent of GDP ($16 billion) in 2028–29 above levels in the absence
of ageing.
The size of the ageing impact for any given spending program is dependent on the composition of
recipients, how usage of the program varies with age, and how usage of the program is projected to
change over the next decade.
The impact of ageing on spending stems from three key areas – the Age Pension, aged care and health.
These three areas together account for around a quarter of total spending in 2017–18 and, to varying
extents, are weighted towards older Australians (Figure 2–4).
Figure 2–4: Composition of Figure 2–5: Impact of ageing on
Commonwealth spending spending in 2028–29
2017–18 2017–18 dollars
Source: 2017–18 Final Budget Outcome Source: 2018–19 Budget and PBO analysis
The impact of ageing on these three spending areas decreases the budget balance by $17.9 billion in
2028–29, the final year of the projections period (Figure 2–5). This impact is partially offset by the
effect of ageing on the remaining spending programs which improve the budget balance by
$1.9 billion, giving the net impact of $16 billion. These include programs such as jobseeker payments
and funding for schools and universities which all see a reduction in growth as a result of ageing.
AUSTRALIA’S AGEING POPULATION 11Figure 2–6: Average annual real growth in spending
Source: 2018–19 Budget and PBO analysis
On an annual basis, ageing is expected to result in an increase in the annual average growth in
Age Pension spending over the decade of around 1.8 per cent (Figure 2–6). Likewise for aged care,
growth in spending is expected to average close to 1.8 per cent. For health, the annual growth rate is
smaller than the other two spending areas at 0.5 per cent. While the ageing-related growth for aged
care and the Age Pension are similar, in dollar terms the greatest impact to the budget comes from
the Age Pension.
2.2.1 Age Pension
The most significant impact of ageing on the budget is through Age Pension spending. Around
three-quarters of the real growth over the next decade is due to ageing and the remainder attributable
to other factors such as population growth and indexation of payment rates (Figure 2–6). The Age
Pension program is one of the most significant components of Commonwealth expenditure, making up
10 per cent of total spending, or $45 billion, in 2017–18. Age Pension spending accounts for around
$9 billion of the $16 billion spending-related annual cost of ageing in 2028–29.
There is a rapid take-up of the Age Pension within the first few years of age 65 when individuals become
eligible (Figure 2–7).15 Currently, around 10 per cent of individuals move from another working age
pension, such as the Disability Support Pension, to the Age Pension at age 65. Thus the growth in Age
Pension recipients is partially offset by recipients moving off other pension payments.
15 Data in Figure 2–7 is at June 2017, when the qualifying age for the Age Pension was 65. From 1 July 2017, the qualifying
age increased to 65 years and 6 months for persons born after 1 July 1952.
12 AUSTRALIA’S AGEING POPULATIONFigure 2–7: Take-up of a pension by older Australians in 2017
Note: Other Commonwealth pensions include the Carer Payment, Disability Support Pension and
Department of Veterans’ Affairs (DVA) means-tested pensions.
Source: DVA administrative data
While Age Pension spending is the largest component of the cost of ageing on total spending,
this impact is likely to peak between 2010 and 2030, driven by the increase in the proportion of the
population aged 65 and over during this period. Once the entire baby boomer cohort has reached
the qualifying age for the Age Pension (which will happen in the early 2030s) the impact of ageing
on Age Pension spending will moderate.
Age Pension and the superannuation system
The influence of ageing on the Age Pension is taking place amidst the backdrop of a maturing
superannuation system. The modern superannuation system was introduced in 1992 and by the 2040s
Australians will be retiring having made superannuation contributions for their entire working life.
This maturation, along with the legislated increases in the compulsory superannuation contribution
(the Superannuation Guarantee) from 9.5 per cent to 12 per cent by 2025, will result in increasing
average superannuation balances over the coming decades.
The increase in the superannuation guarantee to 12 per cent will likely lead to lower wage increases,
shifting a greater proportion of earnings into the superannuation system.16 The ageing population
will also result in a greater proportion of superannuation accounts moving into the retirement phase.
The effect of these developments is a weakening of revenue growth due to a greater proportion of
the income tax base facing concessional taxation.
There will be an offset to the impact described above from the interaction with the Age Pension
assets test. Increasing superannuation balances are expected to become a significant factor in the
slowing of long-term growth in Age Pension spending. Analysis by Treasury and Rice Warner suggests
that the net budget impact of higher balances is unclear, with lower Age Pension expenditure being
offset by higher tax concessions.17 The evolution over time of the interacting components of the
retirement income system is an area which warrants ongoing monitoring and further research.
16 PBO, 2018a
17 Treasury, 2013; Rice Warner, 2019
AUSTRALIA’S AGEING POPULATION 13Box 3: Age Pension qualifying age
In 1909, the Age Pension was introduced with the qualifying age for men set at 65. Since that
time, male life expectancy has increased from 55 to 80, however, retirement behaviour has
remained anchored to the qualifying age. This is reflected in the significant decrease in labour
force participation at that point (Figure 2–8).
Figure 2–8: Retirement behaviour
Percentage point change in labour force participation by age in 2016
Note: Between age 55 and 60 people become eligible to access superannuation (depending on their date
of birth). This age range coincides with an increase in retirement (withdrawal from the labour force) that
plateaus from age 60, until eligibility for the Age Pension at 65. Superannuation can be accessed on a tax
free basis from age 60.
Source: PBO analysis of ABS Census data, 2016; based on analysis presented in Grattan, 2017 and PC, 2013
In 2017–18, a legislated staged increase in the Age Pension qualifying age from 65 years began,
with the qualifying age to increase to age 67 by 2023–24. A further increase in the qualifying
age to 70 had been proposed and was in the 2018–19 Budget baseline, but the Government
subsequently announced that they would no longer be proceeding with this measure.
The reversal of the measure to further increase the qualifying age reduces the budget balance.
This is because it increases total expenditure on the Age Pension, with a partial offset from
reduced recipients of working age payments such as the Disability Support Pension and Newstart,
and it reduces the size of the labour force and hence tax revenues. Since this change only takes
effect from 2025–26, however, it is expected to have only a marginal effect over the next decade.
2.2.2 Aged care
Aged care spending accounts for around $5 billion of the $16 billion spending-related annual cost
of ageing in 2028–29. Around one-third of the projected growth in aged care spending over the next
decade is due to ageing (Figure 2–6).
Like the Age Pension, aged care is a program targeted at older Australians with funding provided for
residential and in-home care. Residential care made up the majority of the $18 billion spent on aged
care in 2017–18 (see Box 4 for further information on the components of aged care spending).
14 AUSTRALIA’S AGEING POPULATIONUnlike the Age Pension program, however, the ageing component of aged care growth is likely to
peak beyond the next decade. This reflects the fact that the use of residential care is heavily weighted
to people in their mid-80s and older, and as Figure 1–1 illustrated, the large baby boomer cohort will
enter this age group in the early 2030s.
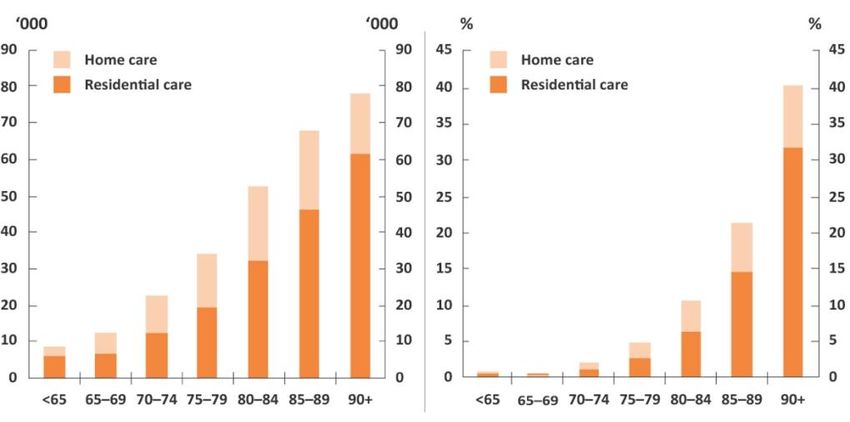
Figure 2–9 shows the use of aged care services by different age groups. This is broken down by the
number of people who take up aged care packages (Figure 2–9a) and the proportion of the population
in that age group using aged care by package type (Figure 2–9b).
Figure 2–9: Aged care
a. Population in aged care b. Proportion of population in
in 2018 aged care by age group
Note: These charts do not include recipients of the Commonwealth Home Support Program as data
is not available by age, so these charts may understate use of home-based care.
Source: Australian Institute of Health and Welfare, 2018
These graphs show that there is a steady increase in demand for coordinated aged care from age
70 to 74 onwards. The proportion of the population accessing aged care increases significantly for those
over the age of 80. Demand for residential aged care, in particular, grows as people age, rising to
around 80 per cent of aged care usage when individuals reach their 90s. This reflects the fact that as
people enter their 80s and 90s, their caring needs are often more appropriately catered for in
residential aged care facilities.
It is also worth noting that in dollar terms, the distribution of spending is even more weighted towards
older age groups. This is because aged care funding is determined according to the infirmity of the
resident, which tends to increase with age.
Other pressures on aged care costs
The budget will face cost pressures from aged care due to the ageing of the baby boomers in the
short term and, potentially, from increasing life expectancies in the long run. However, there are
other cost pressures that are also likely to emerge over the coming decades.
Aged care providers are sensitive to wage pressures, with labour making up approximately
70 per cent of residential care providers’ costs. Once fully implemented, the National Disability
Insurance Scheme will be of comparable size (in terms of Commonwealth Government spending) to
aged care, and will place additional demand on the health sector workforce. These conditions could
result in wage increases to attract the necessary staff into the aged care sector depending on other
developments in the labour market.
AUSTRALIA’S AGEING POPULATION 15Potential changes to the aged care sector also add to the uncertainty around future costs. Aged care
has undergone several reforms in recent years including an expansion of home-based care to meet
the preferences of older Australians. To the extent the expansion of home care continues to reduce
the required number of residential care places, it has the potential to moderate the growth in aged
care costs as home care is generally cheaper to provide. However, the cost to the budget of aged
care over the long term is ultimately most sensitive to the number of individuals that require care.
Growing expectations around the quality of aged care provided, some of which are being considered
by the Royal Commission into Aged Care Quality and Safety, also have the potential to motivate
further reforms which could increase funding pressures in the future.
Box 4: What are the key components of Commonwealth aged care spending?
In 2017–18, Commonwealth spending on aged care was $18 billion (including veterans’ aged
care). This is primarily comprised of spending on home and residential care.
Home care
Home care is currently provided through two programs, the Commonwealth Home Support
Programme (CHSP) ($3 billion in 2017–18), which was created to consolidate the delivery of
services previously managed by the states, and the Home Care Packages program ($2 billion
in 2017–18).
Home Care Packages are made available directly to consumers to be spent on aged care services.
The number of Home Care Packages provided is linked to the population aged 70 and over.
Part of the Living Longer Living Better reforms involved increasing the provision of Home Care
Packages from 27 in 2012 to 45 per 1,000 people aged 70 and over by 2021.
Residential care
The provision of residential care places ($12 billion in 2017–18) is changing over the same
period, falling from 86 to 78 places per 1,000 people aged 70 and over.
Subsidised residential care places are allocated annually to aged care facilities who are then
given time to expand or build new spaces before the place actually becomes operational and
available to a resident.
2.2.3 Health care
Health care spending accounts for around $3 billion of the $16 billion spending-related annual cost
of ageing in 2028–29. The budget cost of health care is due to spending on Medicare, pharmaceutical
benefits and hospitals. While these programs make up a larger share of total spending than the Age
Pension (12 per cent compared to 10 per cent), spending on health is more evenly spread across all
age groups.
Responsibility for health care is split between Commonwealth and state governments.
The Commonwealth has responsibility for funding Medicare and the Pharmaceutical Benefits
Scheme, and state governments have primary responsibility for managing the public hospital system,
with the Commonwealth funding $20 billion of the total $47 billion spent on hospitals in 2017–18.
One of the notable features of projected annual growth in healthcare in Figure 2–6, is that ageing
is not the principal driver of projected health costs. There are a range of other factors, such as
technological change and consumer preferences, that are more significant.
16 AUSTRALIA’S AGEING POPULATIONThe annual effect of ageing is about 10 per cent larger for hospitals than Medicare and
pharmaceutical benefits. Figure 2–10 shows how spending on different health care programs is
distributed across age groups. It highlights that the sharpest increase in costs as people grow older
is associated with public hospital spending. Per capita Commonwealth public hospital spending on those
aged 75 to 84 years and over is five times the median, while pharmaceutical benefits and Medicare
spending on the same cohort is closer to three times the median. This reflects that there are often
significant hospital costs incurred in the final years of life.
Figure 2–10: Health care costs
Per capita, 2017–18
Source: Department of Health administrative data; Department of Human Services, 2018.
Public hospitals data is the approximate cost to the Commonwealth in 2017–18 based on historical
actual data.
Other factors driving the growth in health care spending
As noted above, factors other than ageing are leading to higher health care spending over the
next decade.
Of these other factors, improvements in medical technology have been commonly identified by
health economists as having particular influence.18 Technological advances have resulted in new
medical services which often broaden the scope of diagnoses and treatments. These can have a
range of effects. For example, new technologies may treat conditions for which there was previously
no, or no effective, treatment (such as, renal dialysis and coronary artery bypass grafts), or expand
existing methods to a broader group of patients. 19
On the demand side, higher incomes drive growth in health spending. A phenomenon observed
across the developed world is that health spending is rising faster than economic growth, as higher
national incomes are associated with an increased preference to consume greater or higher quality
health care.20
18 OECD, 2006
19 OBR, 2016
20 For an overview see Sorenson et al (2013). The magnitude of the income effect is contested due to the difficulty of
separating it out from other contributing factors.
AUSTRALIA’S AGEING POPULATION 17Demand is also affected by the price that individuals pay for health care. In Australia, the availability
of government subsidised care and private health insurance mean that individuals rarely face the full
direct cost of their health consumption. This can act to increase demand through a dampening of the
price signal.
It is important to note that the projections of health expenditure in this report are based on current
policy. As such, the impact of some of the drivers of health expenditure such as new or more expensive
treatments is constrained in this analysis. Implicit in this is the assumption that, for example, rising
prices for existing Medicare items (or the cost of new treatments yet to be listed) may need to be
either absorbed by doctors or result in increased out-of-pocket costs for patients. To the extent that
the government provides comparable subsidies to these new treatments, the growth in health care
costs would be greater.21
2.3 Impact of ageing on other spending
There are a large number of other spending programs provided by the government. This ‘other
spending’ includes social security payments (such as family, job seeker and disability support payments)
and funding for schools and universities. The impact of ageing on these programs partially offsets the
impact of ageing from the Age Pension, health and aged care programs by improving the underlying
cash balance by $1.9 billion in 2028–29 (Figure 2–11).
Figure 2–11: Ageing impact on other spending
Annual real growth
Source: 2018–19 Budget and PBO analysis
21 See the PBO paper Medicare Benefits Schedule: Spending trends and projections 04/2015 for a discussion of the policy
effects on Medicare.
18 AUSTRALIA’S AGEING POPULATIONThe Commonwealth spending on these other programs show a much smaller responsiveness to ageing
over the next decade. This is because these programs are targeted at a larger base of the population
(such as social security spending), or younger cohorts (such as schools funding). As a result, their costs
do not differ substantially by the age of the recipient, making them less sensitive to the effect of ageing.
The greatest ageing-related growth impact for these other payments is in the areas of university
funding and job seeker payments. These programs are generally accessed by individuals below the
age of 65. Universities funding is projected to experience a slowing in the rate of average annual
growth over the decade as a result of ageing by 0.5 per cent, while the rate of job seeker payments
growth is expected to slow by 0.3 per cent. However, in net terms job seeker payments continue to
experience growth over the projections period.
AUSTRALIA’S AGEING POPULATION 19Appendix A – Methodology
The impact of ageing is measured by removing the influence of demographic change from the PBO’s
spending and revenue models used to produce the 2018–19 Budget: medium-term projections report
(‘the baseline‘). Comparing medium-term projections of spending and revenue, based on a
no-ageing scenario of population growth, to the baseline gives the quantified impact of ageing.
The no-ageing scenario freezes the demographic structure, the proportional balance of ages and
gender, of the population to that in 2017–18 (the ‘base year’). The population at each year of age
and gender is grown by the projected population growth rate by gender over the medium term.
Thus the projection of the total Australian population remains unchanged from the baseline while
the demographic structure remains static. 22
The PBO’s projections of demand-driven spending are broadly based on demographic-specific trends
of usage and projections of indexation parameters. Detailed methodology for how each payment is
projected is outlined in Appendix A to the 2018–19 Budget: medium-term projections report.
These spending models are projected using the no-ageing scenario population projection. The
growth in the no-ageing spending scenario is compared to the growth in the baseline projection to
measure an impact of ageing.
Revenue is generally projected on a ‘base plus growth’ methodology which depends on projections
of the macro-economy. Economic parameters are used to estimate growth rates which are then
applied to the relevant base. For policy decisions where the impact is not already factored into the
base year data or the economic parameters, the projected impact of these measures are added to
the base projections. Detailed methodology for how heads of revenue are projected is outlined in
Appendix A to the 2018–19 Budget: medium-term projections report.
The impact of ageing on revenue is applied through the impact on the participation rate. The baseline
projection of age-specific participation behaviour is adjusted for the no-ageing scenario population
projection producing a participation rate without the impact of ageing. No productivity changes are
assumed from the impact of ageing, meaning average output per worker is equivalent in the two
scenarios. Thus the relative changes to the participation rate imply a proportional change in the
projected level of nominal GDP and the subsequent impact on revenue.
The measurement of the impact of ageing on the budget balance (Figure 1–3) over the medium term is
adapted from the linear interpolation method applied to health costs decomposition in the Productivity
Commission paper Economic Implications of an Ageing Australia (PC, 2005). This methodology allows
apportioning of the change in expenditure to its component drivers.
For more detail on this method see Technical Paper 6: Health Cost Decompositions of the Economic
Implications of an Ageing Australia report (PC, 2005).
22 The female and male population have different projected growth rates over the medium term: an average of
1.55 per cent per annum for females compared to 1.49 per cent for males. As women have a longer life expectancy
than men there is a very slight evolution of the age demographic structure for the no-ageing scenario.
20 AUSTRALIA’S AGEING POPULATIONAppendix B – References and data sources
ABS (2014) Australian historical population statistics, Australian Bureau of Statistics Catalogue No.
3105, September 2014
ABS (2016) Census of Population and Housing, Employment, Income and Education - Labour force
status by age, Australian Bureau of Statistics
ABS (2018) Population Projections, Australia, 2017 (base) - 2066, ABS Catalogue No. 3220, November
2018
ABS (2019) Labour Force Australia, Australian Bureau of Statistics Catalogue No. 6202, January 2019
Australian Institute of Health and Welfare (2018) Aged care data snapshot—2018
Burtless, G (2013) The Impact of Population Aging and Delayed Retirement on Workforce Productivity,
Center for Retirement Research at Boston College
Department of Human Services (2018), Medicare Group Reports.
http://medicarestatistics.humanservices.gov.au/statistics/mbs_group.jsp
Grattan (2017) Daley, J, The Implications of ageing for economics and politics, Grattan Institute, IBR
Post Retirement Conference
Hotchkiss, J (2009) Changes in the Aggregate Labor Force Participation Rate, Federal Reserve Bank of
Atlanta Economic Review No. 4
McDonald, P (2017) Chapter 4 - Population Ageing: A Demographic Perspective of Ageing in Australia:
challenges and opportunities, Springer New York
McDonald, P and Kippen, R (1999) The Impact of Immigration on the Ageing of Australia’s Population,
Department of Immigration and Multicultural Affairs, Belconnen ACT
National Research Council (2012) Chapter 6 - Aging, Productivity, and Innovation of Aging and the
Macroeconomy: Long-Term Implications of an Older Population, Washington, DC: The National
Academies Press
OBR (2016) Licchetta, M & Stelmach. Fiscal sustainability analytical paper: Fiscal sustainability and
public spending on health, Office for Budget Responsibility, September 2016
OECD (2006) Projecting OECD Health and Long-Term Care Expenditures: What are the Main Drivers?,
Organisation for Economic Co-operation and Development Economics Department Working
Papers No. 477, Paris
PBO (2015) Medicare Benefits Schedule: Spending trends and projections, Parliamentary Budget Office,
Report no. 04/2015, Parliament of Australia
PBO (2017) 2017–18 Budget medium-term projections: economic scenario analysis, Parliamentary
Budget Office, Report no. 05/2017, Parliament of Australia
PBO (2018a) Trends affecting the sustainability of Commonwealth taxes, Parliamentary Budget Office,
Report no. 02/2018, Parliament of Australia
PBO (2018b) 2018–19 Budget: medium-term projections, Parliamentary Budget Office, Report no.
03/2018, Parliament of Australia
PC (2005) Economic implications of an ageing Australia, Productivity Commission
PC (2013) An Ageing Australia: Preparing for the Future, Productivity Commission
Rice Warner (2019) RW Newsletter Productivity Commission parts company with the evidence, 24
January 2019
AUSTRALIA’S AGEING POPULATION 21The Treasury (2013) A Super Charter: fewer changes, better outcomes
The Treasury (2015) Intergenerational Report
UN (2017), World Population Prospects: The 2017 Revision, United Nations Department of Economic
and Social Affairs
Other data sources used include:
• Participation rate and population projections over the medium-term provided by the Treasury
• Pharmaceutical Benefits Scheme and public hospitals costs provided by the Department of Health
• Pension recipient numbers provided by the Department of Social Services and Department of
Veterans’ Affairs.
22 AUSTRALIA’S AGEING POPULATIONYou can also read