DENVER HUMAN SERVICES - Proposed 2021 Budget VISION: DHS envisions a healthy community where people are connected, supported, safe, and well ...
←
→
Page content transcription
If your browser does not render page correctly, please read the page content below

DENVER HUMAN SERVICES
      Proposed 2021 Budget

VISION: DHS envisions a healthy community
where people are connected, supported, safe,
and well.

MISSION: Partnering with our community to
protect those in harm’s way and help all
people in need.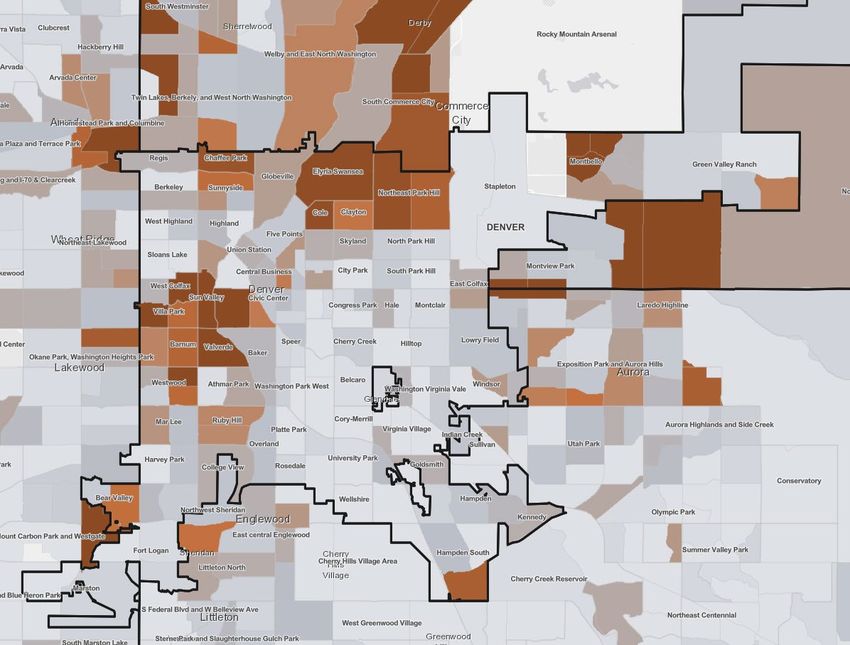
2

                      Human Together Goals
                         and Value Sphere

Equity and Access

Safety and Wellness

Connectivity

Economic Resilience

DHS Workforce
3

                                    DHS Response to COVID-19

Operational                               Financial
• 90%+ of employees working remotely      • Close collaboration with Dept. of
• Supported Emergency Operations            Finance on FEMA and Coronavirus
  Center with eight staff redeployed        Relief Funding reimbursement
• Supported expanded sheltering (40         (including for shelter on-call
  redeployments and 80+ on-call hires)      positions, which DHS is currently
• Created Document Runner Program           funding)
• Virtual child welfare home visits       • Rethinking what Castro Building
• Rental assistance digital innovations     space revitalization looks like post-
• Food delivery to community                COVID and preserving operational
• In-person EBT card issuance at            flexibility by delaying capital transfer
  Castro Building                           until later this year
• Federal waivers that simplified         • Holding key department leadership
  eligibility determination work have       positions open to generate savings
  expired                                 • Reviewed and renegotiated certain
                                            service contracts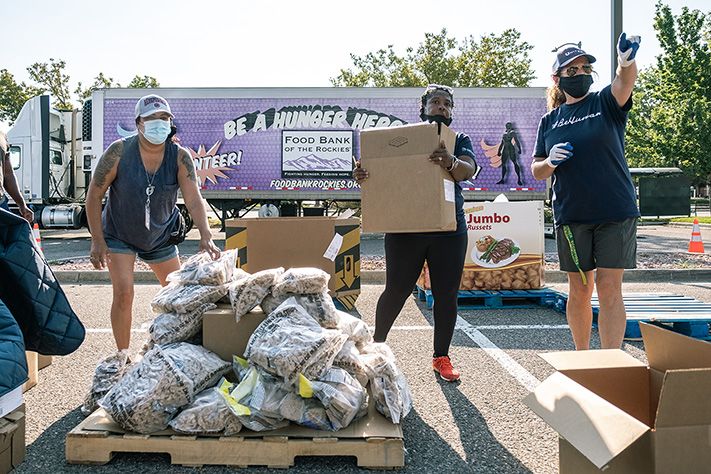
4

Human Services Delivery
     in Colorado
5

                                                State-Supervised,
                                             County-Administered

• Colorado is one of nine states with state-
  supervised but county-administered human
  services systems.
   o The other eight states include California, New York,
     Pennsylvania, and Ohio. More than half of the U.S.
     population resides in the nine states.

• The relationship between the state and county
  departments, both fiscally and programmatically,
  is found in the Colorado Revised Statutes.
• The state has rule-making authority that ensures
  all counties operate with some level of
  consistency.
6

                                             Human Services in
                                      Colorado Revised Statutes

Administration
• Each county in the state is required to establish a department of human
  services whose responsibility is to provide assistance payments, food stamps,
  and social services. (CRS 26-1-115)
• Other counties’ boards of county commissioners serve as the county board, but
  in Denver the department’s director serves in this role. (CRS 26-1-116)

County Share
• The county’s share of expenses are to be raised through property taxes. (CRS
  26-1-122.5)
• In most instances, the state funds 80% of the cost. (CRS 26-1-122)
• Each county is required to create a “county social services fund” which is to
  consist of moneys appropriated for public assistance and welfare and related
  purposes. (CRS-26-1-123)
• A county social services budget is to be prepared by the county director and
  reviewed by the county board. Before being adopted by the board, the budget is
  to be submitted to the state department for review. (CRS 26-1-124)
7

                                               Human Services in
                                        Colorado Revised Statutes

State Funding Allocations
• With input from a statutory “works allocation committee”, the state department
  allocates funds (“the county block grant”) to counties for the administration and
  implementation of the Colorado Works (TANF) program. The state also monitors
  the statewide progress in meeting the work participation requirements. (CRS
  26-2-712; 26-2-714)
• A county that doesn’t fully spend its allocation can retain the unspent funds in
  reserve, provided that the county’s reserve doesn’t exceed 40% of its allocation.
  (CRS 26-2-714)
• A county can transfer up to 30% of its county block grant to augment its child
  care assistance program, and up to 10% to child welfare, provided that it not
  transfer an amount in total that exceeds 30%. (CRS 26-2-714)
• The state allocates funding to each county for child welfare services. The
  allocation model is developed with the input from a statutory committee.
  Denver is assured of a seat on the committee. (CRS 26-5-103.5)
8

                                            Human Services Structure

                    US Dept. of                       US Dept. of Health
                    Agriculture                       & Human Services
Federal
Departments                                                                Centers for Medicare
                                                                           & Medicaid Services

Federal Programs      Food         Child     Child                 Child        Medicaid
                                                      TANF
                    Assistance    Welfare   Support                Care

State Departments

County
Departments
9

                                                                                              House Bill 20-1360
                                                                                             The State “Long Bill”

Appropriation Title*                       Total                   General Fund                        Cash Funds1     Federal Funds
County Administration             $76,649,899                 $25,515,408                      $15,329,979           $35,804,512
Medicaid
                                  $88,174,672                 $12,476,154                      $21,228,612           $54,469,906
Administration
Child Welfare2                    $353,614,720                $176,963,771                     $66,020,062           $97,652,952
Child Welfare Staffing            $26,478,879                 $19,275,468                      $2,666,593            $4,563,309
Families and
                                  $55,302,123                 $46,542,880                      $5,781,763            $2,977,480
Children’s Programs
Child Care Assistance
                                  $130,162,609                $28,190,496                      $13,332,375           $88,639,738
Program
Colorado Works/TANF
                                  $150,548,087                $0                               $22,349,730           $128,198,357
County Grants
Adult Protection                  $18,165,983                 $12,405,977                      $3,670,034            $2,089,972
 * Thefunding for each appropriation title listed is allocated to the counties, either through statutory
 committees (Child Welfare and Colorado Works) or through various county/state workgroups.
 1 Cash Funds are the counties’ share of costs.
 2 There is an additional $13 million transferred to Child Welfare from Medicaid.

   Sources: https://leg.colorado.gov/sites/default/files/documents/2020A/bills/2020a_hum_act.pdf and
   https://leg.colorado.gov/sites/default/files/documents/2020A/bills/2020a_hcp_act.pdf.
10

Denver Human Services
   Funding Sources
11

                                                                       Historical DHS Revenues
$250M

$200M
                                                  Denver voters approve one mill property tax
                                                    levy to fund services for residents with
                                                  intellectual and developmental disabilities

$150M

$100M            External Revenue                                                                        Services for People with I/DD
        (Primarily Intergovernmental Revenue from the
          State of Colorado but includes General Fund
                                                                                                            Property Tax Revenue
            Transfer and Fee-for-Service Revenues)
$50M

        Social Services Mill Levy
         Property Tax Revenue
  $M

            Jul. 1990 to Mar. 1991 Recession                    Mar. to Nov. 2001 Recession     Dec. 2007 to June 2009 Recession

            Source: Annual City and County of Denver Budget Books | Adjusted for Inflation – 2018 Dollars (except for 2019) | Excludes Grants
12
Major State Allocations to DHS
Allocation SFY 2018-19 SFY 2019-20 SFY 2020-21
Adult Protective Services $2.3M $2.6M $2.3M
Child Care Assistance $19.3M $21.6M $23.7M
Child Welfare Block $46.8M $48.0M $46.5M*
Child Welfare Core Services $7.0M $6.6M $6.3M
Child Welfare SB242 Positions $2.1M $3.5M $3.4M
Colorado Works / TANF $26.6M $25.5M $25.8M
County Administration $21.3M $22.6M $21.3M
TOTAL $125.4M $130.4M $129.3M
* DHS anticipates a reduction in this allocation by about $1 million.
NOTE: The State of Colorado is on a July 1 to June 30 fiscal year. SFY 2020-21 allocations are subject to change.
The Colorado Dept. of Human Services has only provided six-month Child Welfare allocations to date. To estimate
the full SFY2020-21 Child Welfare allocation amounts, DHS doubled the six-month allocations.13
DHS Property Tax Revenues
Social Services Mill Levy Revenue I/DD Mill Levy Revenue
$60M
$55.5M $56.2M
$54.2M
$51.7M 3.380 3.374
$50.4M mills $50.5M
$50M mills
$46.4M $46.6M 3.835 TBD
3.849 2.479
mills mills
4.480 4.470 mills mills
mills mills
$40M
$30M
$22.0M $22.3M
$20M $17.3M $17.6M
1.011 ~1.0
$14.2M $14.5M
mills mill
$11.4M $11.4M 1.010 1.009
1.012 1.010 mills mills
$10M
1.021 1.016 mills mills
mills mills
$M
2014 2015 2016 2017 2018 2019 2020 2021
Projected Projected
NOTE: Starting in 2020 the City reduced the Social Services Mill Levy to fund services
related to people experiencing homelessness in the new Dept. of Housing Stability.14
DHS Division / Program
Funding Map
More State / More Local City /
Federal Funding County Funding
Family & Adult
Child Welfare Assistance Services for
People with
Administration I/DD
Child Support Community
Services Outreach & Property Tax
Resource Relief Program
Financial Services
Adult Protection Engagement
Services General
Performance Assistance
Aid to Needy Improvement &
Disabled Accountability
All Local Funding15
DHS Fund Balance
Assigned – Committed to Specific Programs Assigned – Could Support Mandated Programs Unassigned
$100M
$90M
$80M $26.5M $24.5M
$27.2M
$70M
$23.4M
$60M $11.8M $12.2M
$10.1M
$50M $9.4M
$40M
$30M
$52.5M $54.5M $54.7M
$46.7M
$20M
$10M
$M
2017 Actuals 2018 Actuals 2019 Actuals 2020 Projected
As of Dec. 31 of Each Year16
TANF Reserves
DHS TANF Reserves
2017 to 2021
$12M • DHS currently has about $9.8 million
$10.3M available in its Temporary Assistance
$10.0M
$10M
$9.3M $9.3M
$9.8M
to Needy Families (TANF) reserves
held off its books in a state account.
$8M
• These reserves can cover
$6M
overspending of state allocations to
DHS for Colorado Works (TANF),
$4M
Child Welfare, or Child Care.
• DHS’s TANF reserves are statutorily
$2M capped at 40% of its annual TANF
allocation or about $10.2 million for
$M
2017 2018 2019 2020 2021
SFY2020-21.17
Denver Human Services Divisions,
Key Strategic Metrics, and
2021 Proposed Budget18
Historical DHS FTE Changes
Budgeted Full-Time
Equivalents (FTEs)
1,400
1,296
1,233 1,242 1,247 1,238
1,207
1,175
1,200 1,138
1,106 1,103 1,097 1,106
1,030 1,034
999 996
1,000 968 952 966
835 856 861
800
600
400
200
0
2000 2001 2002 2003 2004 2005 2006 2007 2008 2009 2010 2011 2012 2013 2014 2015 2016 2017 2018 2019 2020 2021
Mar. to Nov. 2001 Recession Dec. 2007 to June 2009 Recession
Source: Annual City and County of Denver Budget Books19
2021 Proposed
DHS Budget by Fund
Service Delivery and Administration Child Welfare
(13008) (13005) Total
▪ Family & Adult Assistance (FAAD): $40.1M | 417.49 FTEs
▪ Administration: $29.2M | 31.83 FTEs
◦ Executive Management: $13.3M | 14 FTEs $43.2M
$194.4M
◦ Human Services Legal Services: $7.1M | 0 FTEs*
◦ Facilities & Security: $5.1 M | 8.33 FTEs
354.83 FTEs 1,237.55 FTEs
◦ Office of Human Resources: $2.3M | 0 FTEs*
◦ Marketing & Communications: $1.4M | 9.50 FTEs Areas represent separate
▪ Performance Improvement & funds / appropriations
Accountability (PIAD): $11.5M | 124.11 FTEs
▪ Child Support Services: $10.1M | 129 FTEs
▪ Community Outreach & Resource Grants and Affordability
Engagement (CORE): $6.8M | 74.75 FTEs Services for Cash Basis Programs
▪ Financial Services: $6.6M | 53.53 FTEs SRFs (13813)
People with
▪ Adult Protective Services: $2.3M | 23 FTEs
▪ Information Systems and Technology: $1.9M | 9 FTEs I/DD (13304) $6.1M $6.1M
4 FTEs
General Assistance
(13305)
$22.3M
$108.4M Functional areas are divided
into divisions or cost centers
Child Care
(13017)
$1.5M
2 FTEs
Aid to Needy Disabled
(13303) $1.0M
862.71 FTEs within this fund / appropriation
$4.5M
Transfer to General
14 FTEs
Fund $163K
* Human Services Legal Services and the Office of Human Resources’ DHS Service Group Transfer to Property Tax Transfer to Alternative
are budgeted in a special revenue fund by their respective departments, which bill DHS for Relief Program $1.0M Transportation SRF $144.9K
associated costs. There are 48 FTEs in the Human Services Legal Services section of the
City Attorney’s Office and 12 FTEs in the Office of Human Resources’ DHS Service Group.20
Assistance and Services Paid
Through State Systems
The graph and table below show federal and state benefits and services paid—including Denver’s share—to/for clients through state
systems. Only Denver’s share is reflected in the City budget. The figures do not include local benefits paid (i.e., Property Tax Relief) or
the value of medical assistance to Denver clients for which DHS only determines eligibility.
$250,000,000
$217.1M $209.3M $203.9M $201.2M
$200,000,000
$150,000,000
$100,000,000
$50,000,000
$0
2016 2017 2018 2019
Home Care Allowance $1,623,319 $1,765,687 $1,739,531 $1,993,024
Aid to Needy Disabled $3,528,602 $3,361,579 $2,555,178 $3,254,745
Low-Income Energy Assistance $2,959,535 $3,781,491 $3,769,440 $2,970,667
Child Care $14,902,734 $16,495,158 $17,929,970 $21,229,300
Colorado Works/TANF $18,717,465 $17,748,830 $17,020,522 $17,121,538
Old Age Pension $20,479,165 $18,489,852 $17,183,677 $16,801,130
Child Welfare Services $29,317,012 $28,747,136 $26,060,307 $24,524,269
Food Assistance $125,577,006 $120,659,778 $119,415,280 $115,297,00421
Child Welfare
So far in 2020, Child Welfare has received over 10,000 reports of suspected child
abuse or neglect. Social workers engage with families to assess the reported concerns
and determine how best to respond to maintain or establish safety for a child. Child
Welfare continues to provide services and support to strengthen and preserve families
by emphasizing prevention, partnering with the family to maintain children within their
home or with someone they know, and utilizing out-of-home care only when necessary.22
Child Welfare
Key Strategic Metrics
Child Welfare is responsible for providing child protection services, adoption,
foster care resources, and advocacy for Denver youth and children.
DHS Out-of-Home Placements and DHS Kin Placements as Percent of Total
New Removals
1,400 250
New Removals
1,200
Children in Out-of-
200
45% Denver
1,000
Home Placement
150
800
600
100
400
50
30%
200 Statewide
0 0
Source: Colorado Department of Human Services23
Child Welfare Budget and
2021 Significant Changes
Historical Budget and Expenditures 2021 Budget by Category
$50M $0 $205,110
$45M Personnel Services
$40M $6.2M $5.7M $1.2M $0.3M Services and Supplies
$35M $1.0M $1.0M Internal Services
$11,892,911
$30M
$25M
$20M
$31,071,685
$15M 2021 FTEs
$10M
354.83
$5M
$36.9M $36.3M $43.4M $42.9M
$M
2018 2019 2020 2021
Actuals Actuals Appropriated Recommended
Child Welfare Family Crisis Center Unspent
2021 Significant Budget Changes
Personnel FTE Services / Supplies Internal Services
-$534,645 -1.17 Unlimited +$40,000 -$955,982
Personnel budget decrease due to furloughs and holding positions of retiring employees vacant.
Internal services budget decrease due to retirement of Family Crisis Center debt.24
Adult Protective Services (APS)
When an at-risk adult is reported as a victim of mistreatment or is demonstrating that they
cannot provide for their own health, safety, or wellbeing, APS responds to investigate the
concerns while identifying and helping implement interventions to mitigate ongoing risk. APS
case workers operate in accordance with the key principles of self-determination and least
restrictive intervention, honoring client choice. As a final resort when absolutely necessary to
improve safety, APS case workers can pursue guardianship for incapacitated adults to act on
their behalf and in their best interest. DHS is currently the guardian for 150 at-risk adults.25
Adult Protective Services
Key Strategic Metrics
Adult Protective Services provides protection services, resources, and advocacy for seniors and vulnerable adults.
Adult Protective Services Reports Received
2019 2020
250
220 225
217
211 207 210
200 185 182
177 177 174 179
150 135 131
112
100 84
50
0
January February March April May June July August
Source: Colorado Adult Protective Services (CAPS) Data26
Adult Protective Services Budget and
2021 Significant Changes
Historical Budget and Expenditures
$3M
Unspent
2021 Budget by Category
$0.3M $0.1M
$2M
$0 $1,000
$2M Personnel Services
$210,902 Services and Supplies
Internal Services
$1M
$1M
$2,042,972
$1.9M $2.1M $2.2M $2.3M 2021 FTEs
$M
2018 2019 2020 2021
23.00
Actuals Actuals Appropriated Recommended
2021 Significant Budget Changes
Personnel FTE Services / Supplies Internal Services
+$11,859 No Change +$8,400 -$8,400
No significant changes to the Adult Protective Services budget.27
IDDEAS Program
The IDDEAS (Intellectual and Developmental Disabilities Equitable Access to
Services) program administers revenue from the property tax mill levy dedicated
to funding services for people with intellectual and developmental disabilities
(I/DD) approved by Denver voters in 2003. The IDDEAS program contracts with
Denver’s state-designated community centered board (CCB) which provides
services and case management to 4,700+ residents with I/DD. In recent years,
DHS completed a community needs assessment, seated an advisory council,
and now contracts with other community providers for innovative services.28
IDDEAS Program
Key Updates
The IDDEAS program provides services to people with intellectual and developmental disabilities
(I/DD) both through the community centered board as well as through other providers.
IDDEAS Program Pillars
GAPS PILLAR
• $300K fund for mini-projects
managed by external
organization—agreement
executed
MENTAL HEALTH PILLAR
• Center for START Services model
• Initial consult agreement and
RFP in development
HOUSING PILLAR
• Community housing report—new
recommendations in progress29
IDDEAS Program Budget and
2021 Significant Changes
Historical Budget and Expenditures
$25M
2021 Budget by Category
Unspent $0 $0 $0
$20M
$2.0M Services and Supplies
$3.3M
$15M
Fund became
$10M non-lapsing.
Any unspent $22,346,410
$5M
budget rolls to
next year.
2021 FTEs
3.00
$15.6M $14.3M $24.5M $22.3M
$M NOTE: There are 3 FTEs dedicated to this program, but
2018 2019 2020 2021 they are not budgeted in this cost center. The Program
Actuals Actuals Appropriated Recommended Manager and Program Administrator are budgeted in
Administration. The Internal Auditor is currently
2021 Significant Budget Changes budgeted in PIAD for 2021.
Personnel FTE Services / Supplies Internal Services
No Change No Change -$2,197,973 No Change
Services and supplies budget decrease due to unspent budget that rolled from 2019 to 2020.
Any 2020 budget that is not spent will roll to 2021 because the fund is non-lapsing.30
IDDEAS Program
New Program Administrator
Expenditures Revenues FTE Duration Strategic Alignment
1 Program
$87,700 $0 Unlimited Network of Equity &
Administrator Opportunity Access
Funding is currently managed by a single Program Manager. When that position was created in 2017, all
funding went to one entity. Since then, the program has evolved significantly with the creation of a Mill Levy
Advisory Council, multiple new vendor contracts now in place, and additional vendor contracts under
consideration. As with the Program Manager, this position would be budgeted in Administration.
Current DHS Mill Levy Contractors Dedicated Mill Levy Fund Balance
$14.4M
As of Dec. 31, 2019
Budget Equity Framework Summary
This position will enable DHS to convert dedicated funding into services for people with I/DD, many of whom are
under-resourced.31
Family & Adult Assistance Division
(FAAD)
Instead of a crowded lobby filled with hundreds of clients, FAAD—
DHS’s division that connects people to state, federal, and local
benefits—now deploys document runners, conducts interviews by
phone, and answers questions and provides benefits cards on the
“Front Porch” of the Castro Building.32
Family & Adult Assistance
Key Strategic Metrics
The Family & Adult Assistance Division is responsible for eligibility and authorization of benefit payments for federal food, cash,
and child care assistance and for determining eligibility for medical assistance. FAAD also determines eligibility for state
benefits like Aid to Needy Disabled and Old Age Pension as well as the local Property Tax Relief Program.
DHS Clients by Major Federal Program
Clients COVID-19
pandemic begins
250,000
Repeal of Affordable Care
Medical Assistance Act mandate becomes law 216,154 clients
200,000
Repeal of Affordable Care
Act mandate takes effect
150,000
Food Assistance 97,220 clients
100,000
50,000
Colorado Works (Temporary Assistance to Needy Families) 7,974 clients
-
Mar-16
Apr-16
Oct-16
Nov-16
Oct-17
Nov-17
Dec-17
Mar-18
Apr-18
Oct-18
Nov-18
Mar-19
Apr-19
Oct-19
Nov-19
Dec-19
Mar-20
Apr-20
May-16
Aug-16
Dec-16
Mar-17
Apr-17
May-17
Aug-17
May-18
Aug-18
Dec-18
May-19
Aug-19
May-20
Aug-20
Jan-16
Sep-16
Sep-17
Sep-18
Sep-19
Feb-16
Jun-16
Jul-16
Jan-17
Feb-17
Jun-17
Jul-17
Jan-18
Jan-20
Feb-18
Jun-18
Jul-18
Jan-19
Feb-19
Jun-19
Jul-19
Feb-20
Jun-20
Jul-20
Source: Colorado Benefits Management System (CBMS)33
Family & Adult Assistance
Key Strategic Metrics
Work on Hand
Application Change Questions RRR Verification
12,000
CBMS transformation
go-live
10,000
8,000
6,000
4,000
2,000
0
Source: DHS Work Management System (WMS)34
Family & Adult Assistance Budget
and 2021 Significant Changes
Historical Budget and Expenditures
$60M
$50M $8.7M
$10.3M
$1.0M $1.0M
2021 FAAD Budget by Category
$4.5M $4.5M
$0 $75,000
$0.6M $0.6M $6.1M $6.1M
$40M Personnel Services
$3.0M $2.9M
$1.8M $1.9M Services and Supplies
$30M Internal Services
$10,350,737
$20M
$10M
$29,689,202
$33.8M $34.4M $40.2M $40.1M 2021 FTEs
$M
2018 2019 2020 2021 417.49
Actuals Actuals Appropriated Recommended
Family & Adult Assistance Property Tax Relief Child Care
Aid to Needy Disabled Unspent
2021 Significant FAAD Budget Changes
Personnel FTE Services / Supplies Internal Services
-$1,024,950 +0.50 Net FTEs +$1,006,761 -$32,850
Personnel budget decrease due to furloughs and holding positions of retiring employees vacant offset by two
new Call Center Agents and one new RTD LiVE Outreach Case Coordinator.
Services and supplies budget increase due to additional $1M for Colorado Works (TANF) client assistance.35
Family & Adult Assistance
Colorado Works (TANF) Client Assistance
Expenditures Revenues FTE Strategic Alignment
$1,000,000 $1,000,000 0 Essential Equity &
Services Access
Increased property tax revenue in 2021 will enable DHS to expand financial support to Colorado
Works (TANF) clients. DHS is exploring ways to best distribute these funds.
Not Employed in the Last 7 Days
60% 49%
50% 39% The most recent statewide
36%
40% 30% Household Pulse Survey found
30%
significant percentages of
20%
10% respondents not employed in
0% the last seven days.
Black Hispanic White Asian
Budget Equity Framework Summary
This funding will provide expanded support to clients enrolled in Colorado Works (TANF). The most recent Household Pulse Survey
results show 53 percent of Hispanic Colorado residents experienced loss of employment income since March compared to 45
percent of black and 42 percent of white residents who experienced loss of income.
Source: U.S. Census Bureau, Household Pulse Survey, Phase 2. Aug. 19 to Aug. 31 for Colorado36
Family & Adult Assistance
New Call Center Agents
Expenditures Revenues FTE Duration Strategic Alignment
2 Customer Limited
$136,500 $43,700 Essential Equity &
Service Agents (1 year) Services Access
DHS’s Family & Adult Assistance Call Center has seen a surge in call volume in 2020 due to a variety of factors, including
COVID-19. Two additional limited call center agents will help meet demand and allow staff currently redeployed to assist the
call center to shift back towards other responsibilities.
Calls
60,000
Family & Adult Assistance Call Center Volume
Calls Handled
50,000
Calls Abandoned
40,000
30,000 Calls Rejected
20,000
10,000
0
Budget Equity Framework Summary
Full coverage at the DHS Call Center will increase timely and thorough assistance for historically marginalized communities of color,
First Nations people, and under-resourced communities, especially during the COVID-19 pandemic. Data indicate people living in
Denver’s inverted-L neighborhoods own computers at lower rates than in other neighborhoods. See next slide for more details.37
Limited Access to Computers in Denver’s
Inverted-L Neighborhoods
Percent of Adults in Households Without a Computer38
Family & Adult Assistance
New RTD LiVE Outreach Case Coordinator
Expenditures Revenues FTE Duration Strategic Alignment
$74,400 in Personnel
1 Outreach Case Limited
and $14,700 in $89,100 (3.5 years)
Equipment / Materials Coordinator Network of
Opportunity
Equity &
Access
The RTD LiVE program offers discounted fares to adults earning up to 185% of the federal poverty level. This is $23,606 for
a single person or $40,182 for a family of three. DHS has processed all applications received to date within the RTD service
area. RTD currently funds four eligibility staff at DHS and wants to fund this new outreach position and associated costs.
RTD’s Target
RTD LiVE Applications Approved by DHS
949
Enrollment 1,000 865
Enrolled 160,000 800 679 695
573
600 444 478 496 457
7,076 407 433
400 219 232
200 110
-
Budget Equity Framework Summary
The RTD LiVE program’s reduced fares help low-income residents attend school, access jobs, and connect with other
resources. Data indicate that a greater percentage of Colorado residents who are Black or Hispanic work in jobs for which
they cannot telecommute. See next slide for more details.39
Ability to Telework by Race / Ethnicity
Some Adult in the Household Substituted Some or All of Their Typical In-Person
Work for Telework Because of the Coronavirus Pandemic
Telework Cannot Telework No change in work Did not report
100%
90% 13% 12% 21% 16%
18%
80%
70%
31%
60% 43% 38%
39%
50% 46%
40%
30%
52%
20% 40% 39% 43%
29%
10%
0%
Asian Black Hispanic Two or more races White
Source: U.S. Census Bureau, Household Pulse Survey, Phase 2. Aug. 19 to 31 for Colorado40
Property Tax Relief
Program Update
DHS is working with City Council, the Mayor’s Office, and the Dept. of Finance to expand eligibility for the property
tax relief program. Increased 2021 property tax revenue will allow DHS to increase funding for the program by $1
million. Specific ideas on the table include:
Exempting social security income and supplemental security income (rule change)
Exempting dependents’ income (rule change)
Allowing self-attestation for income for returning recipients
Clarifying language to allow for eligibility for people with developmental disabilities (rule change)
Increasing income limits (ordinance change)
Amending the definition of “older adult” to lower the age from 65 to 60
Property Tax Relief Program TOTAL Applications Property Tax Relief Program NEW Applications
As of Sept. 15 1,200 1,053
Paid Denied Pending 891
The average rebate 1,000
4,000 3,562 for the 2019 program 800
3,393 3,418 520
year so far is $559. DHS received 91 new
3,500 600
DHS accepts applications from
379 581 782 400
3,000 applications through families with kids for the
April 2021. 200 2018 program year
2,500
0
2,000 2016 2017 2018
1,500 3,014 2,837 2,783
2,184
Budget Equity Framework Summary
1,000
This program aims to keep families in their homes. Data indicate
500
100 a greater percentage of people in Colorado who are Black and
0 Hispanic face housing insecurity. See next slide for details.
2016 2017 2018 201941
Housing Security by Race / Ethnicity
Confidence in Ability to Pay Next Month's Mortgage by Select Characteristics
High Confidence No/Slight Confidence
70%
58%
60% 56%
54%
50%
45%
40%
30%
20% 16%
12%
10%
3% 5%
0%
Asian Black Hispanic White
Source: U.S. Census Bureau, Household Pulse Survey, Phase 2. Aug. 19 to 31 for Colorado42
Child Support Services (CSS)
Each year about $40 million in payments are made from non-custodial to
custodial parents to support children associated with cases established by
Child Support Services. In recent years, CSS has taken efforts to forgive TANF
arrears or debts owed by the non-custodial parent to the government because
the custodial parent was enrolled in TANF. This supports the economic
resiliency of non-custodial parents, many of whom are low-income themselves.43
Child Support Services
Key Strategic Metrics
Child Support Services is responsible for ensuring quality and timely child support services and resources. This
includes establishing and modifying orders and providing support to non-custodial parents to help them to fulfill
their child support obligations.
Total Annual Collections and
Obligations Paid
Collections Percent of Obligations Paid in Month Due in Month Due
$50M 70%
61.4% 61.3% 61.5% 61.4% 62.0%
$45M 58.3% 58.3% 59.2% 59.9%
58.3%
60%
$40M
$35M 50%
$30M
40%
$25M
30%
$20M
$15M 20%
$10M
10%
$5M
$41.1M $41.7M $42.M $42.6M $43.6M $44.7M $43.M $41.M $40.1M $39.7M
$M 0%
2010 2011 2012 2013 2014 2015 2016 2017 2018 2019
Source: Automated Child Support Enforcement System (ACSES)44
Child Support Budget and
2021 Significant Changes
Historical Budget and Expenditures
$12M
Unspent
$10M
$0.4M $0.7M 2021 Budget by Category
$8M $7,600
$0
$278,500 Personnel Services
$6M Services and Supplies
Internal Services
$4M
$2M
$9,833,613
$9.4M $9.4M $10.7M $10.1M
2021 FTEs
$M
2018 2019 2020 2021
129.00
Actuals Actuals Appropriated Recommended
2021 Significant Budget Changes
Personnel FTE Services / Supplies Internal Services
-$599,069 -3.00 Unlimited +$2,000 -$2,900
Personnel budget decrease due to furloughs and holding positions of retiring employees vacant.45
Community Outreach &
Resource Engagement (CORE)
This division was formed in 2016 to increase DHS’s presence in the community. In
late 2019, CORE staff were on-site at 27 different partners organizations, helping
their clients connect to DHS services. CORE continues to support these partners
remotely and also support post-COVID efforts to strengthen food security in under-
resourced communities.46
Community Outreach & Resource
Engagement Key Strategic Metrics
The Community Outreach and Resource Engagement Division works with community partners to bring increased
access to assistance, benefits, nutrition, and other wellness services to the neighborhoods that need it most. In
addition to Outreach, CORE manages workforce services for people enrolled in food assistance, Veterans
Services, the GIVE Center and annual drives, and General Assistance, which provides eviction, rental, burial, and
other emergency assistance to clients in need.
Clients GIVE Center Intakes
12,000
9,776 9,800
10,000
8,210
8,000
The GIVE Center provides free
5,765
6,000 essential services and items to Denver
residents in need, including families,
4,000
foster youth, and people experiencing
homelessness. During COVID, GIVE
Center staff are supporting various
2,000
food security efforts.
0
2017 2018 2019 2020 Projected47
Community Outreach & Resource
Engagement Budget and 2021
Significant Changes
Historical Budget and Expenditures
$10M
$0.3M
$9M 2021 CORE Budget by Category
$8M
$0.05M $2.0M $1.5M $7,481
$0
$7M $1.5M
Personnel Services
$6M $1.8M $414,607
Motel vouchers Services and Supplies
$5M budget in General Internal Services
Assistance
$4M
transferred to
$3M HOST in 2020
$2M $6,329,560
$1M
$5.1M $6.7M $6.5M $6.8M 2021 FTEs
$M
2018 2019 2020 2021 74.75
Actuals Actuals Appropriated Recommended
Unspent General Assistance Community Outreach & Resource Engagement
2021 CORE Significant Budget Changes
Personnel FTE Services / Supplies Internal Services
+$271,499 +4.75 FTEs +$68 -$368
Personnel budget increase for six new positions offset by decrease due to furloughs and
holding positions of retiring employees vacant.48
Community Outreach & Resource Engagement
New Complex Care Team Positions
Expenditures Revenues FTE Duration Strategic Alignment
1 Peer Navigator and Limited
$244,400 $0 2 Social Case Workers (1 year) Network of Equity &
Opportunity Access
CORE’s Complex Care Team provides comprehensive supports to clients with complex barriers and needs. This model is a holistic
approach addressing mental health and social supports. The team is currently limited in how many clients it can serve given existing
staffing levels. With additional positions, CORE aims for the Complex Care Team to serve up to 180 clients per year. Piloting this
effort with limited staff will allow for the collection of data and proof of concept before making the program permanent.
CORE has two
Behavioral Health
Social Case •Intensive case management
•Navigates multiple systems of
Intensive
Case
Navigators on staff Workers support for client
Management
that support the
Complex Care Team
Peer •Peer with lived experience
•Works with the client through
Behavioral
Health
Peer
Navigation
Navigators
Navigation
complex processes
Budget Equity Framework Summary
The Complex Care Team provides multi-disciplinary support to historically marginalized communities of color, First Nations people,
and under-resourced communities throughout Denver with numerous barriers to self-sufficiency including lack of assets/income,
behavioral health challenges, housing instability, etc.49
Community Outreach & Resource Engagement
New GIVE Center Positions
Expenditures Revenues FTE Duration Strategic Alignment
1 Human Services
$64,400 $0 Advocate
Unlimited
2 Human Services Limited Essential Equity &
$128,800 $0 Advocates
Services Access
(1 year)
These positions will support DHS’s GIVE Center programming and internal resource hub in anticipation of
reopened facilities and other CORE food access initiatives in collaboration with community partners like Food Bank
of the Rockies.
GIVE Denver by the numbers:
9,776 individuals and families served in 2019
191 customers received glasses through New Eyes for the Needy
2,561 Vital Document Fee Waivers
3,956 bus tickets issued
12,720 hygiene Items
667 diapers/wipes
3,406 clothing referrals
Budget Equity Framework Summary
These positions will provide an array of services to people in Denver seeking assistance, particularly related to
food access and other essentials such as clothing, hygiene products, etc. Data indicate people who are Black or
Hispanic are more likely to face food insecurity. See next slide for more details.50
Food Insecurity
Food Sufficiency for Households in the Last 7 Days
Sometimes Not Enough To Eat Often Not Enough To Eat
12%
10%
10%
8% 8%
8%
6%
4%
3% 3%
2%
2%
1% 1%
0%
Asian Black Hispanic White
Source: U.S. Census Bureau, Household Pulse Survey, Phase 2. Aug. 19 to 31 for Colorado
The COVID pandemic caused access to basic needs for some residents to
become more difficult in ways that magnify racial and ethnic disparities.51
Financial Services
DHS contractually partners with between 200 and 300 different community organizations,
service providers, and vendors and over 400 child care providers each year to deliver services.
Financial Services provides contracting services for DHS from formal solicitation to scope of
work development to compliance monitoring. The division is also responsible for the full
spectrum of financial services for DHS including accounting, budgeting, fiscal analysis,
cashiering and accounts receivable, procurement and accounts payable, and grants fiscal
management. The internal audit function for DHS moved to the division in July 2020.52
Financial Services
Key Strategic Metrics
The Financial Services Division is responsible for providing timely and accurate
financial services, contracting services, and fiscal management.
Contracts Executed Rental Assistance Checks Issued
Count * Dollar Amount * Count Dollar Amount
450 $70M 1,000 $922,326
$1000K
$56,611,354
400 $59,337,120 900 $900K
$60M $824,759
350 800 $800K
$49,304,765
$50M 700$605,702 $700K
300 $588,670
$45,786,858 600 $600K
250 $40M
500 $500K
200 $30M
400 $400K
150
$20M 300 $300K
100 200 $200K
$10M
50 100 $100K
284 401 398 256 632 894 960 521
0 $M 0 $K
2017 2018 2019 As of Sept. 2017 2018 2019 As of Aug.
15, 2020 31, 2020
* Includes both revenue and expenditure contracts.53
Financial Services Budget and
2021 Significant Changes
Historical Budget and Expenditures
$8M
$7M
$6M
Unspent $0.7M 2021 Budget by Category
$5M Personnel Services
DHS’s Business
Management $0 Services and Supplies
$4M $0.5M Division $1,224,748
Internal Services
merged with
$3M Financial $195,492
Services in
$2M 2019
$5,206,219
$1M 2021 FTEs
$M
$3.9M $6.1M $6.8M $6.6M
53.53
2018 2019 2020 2021
Actuals Actuals Appropriated Recommended
2021 Significant Budget Changes
Personnel FTE Services / Supplies Internal Services
-$148,537 -0.75 Unlimited No Change No Change
Personnel budget decrease due to furloughs and holding position of retiring employee vacant.
Repurposing internal services budget previously used to make debt payments on the Castro Building Parking Garage
for Human Together grant fund ($700K) and to cover costs associated with 405 South Platte River Drive ($215K).54
Performance Improvement &
Accountability Division (PIAD)
The Performance Improvement and Accountability Division (PIAD)
makes the right work easier to do. The division aims to ensure DHS
is as accurate, efficient, and secure as possible.55
Performance Improvement &
Accountability Key Strategic Metrics
PIAD images and archives all applications for public assistance. It also oversees fraud investigations, quality
improvement, privacy, data and technology platforms, and Peak Performance process improvement initiatives.
Applications for Public Assistance
Applications
120,000
Mail-in Med. Assistance-Site PEAK Walk-in Other
65% reduction in
100,000
19,571
walk-in applications
20,624
80,000
23,172
24,382
12,695
100% increase in
online applications.
32,106
60,000 26,544 29,138
51,864 Since the COVID-19 pandemic,
40,000
online applications have
27,820
29,519 25,804
doubled.
20,000
13,939 15,658 15,080
10,958
4,407 4,490 4,061 5,594
-
2017 2018 2019 2020 Estimated56
Performance Improvement &
Accountability Budget and 2021
Significant Changes
Historical Budget and Expenditures
$14M
Unspent
2021 Budget by Category
$12M
$11,692
$0
$1.9M $749,613 Personnel Services
$10M
$1.8M Services and Supplies
$8M Internal Services
$6M
$10,709,421
$4M
2021 FTEs
$2M
124.11
$8.5M $9.7M $11.9M $11.5M
$M Note: The Internal Audit unit (3 FTEs)
2018 2019 2020 2021 is budgeted in PIAD for 2021 but
Actuals Actuals Appropriated Recommended transferred to Financial Services in
July 2020.
2021 Significant Budget Changes
Personnel FTE Services / Supplies Internal Services
-$433,890 -7.00 Unlimited -$300 No Change
Personnel budget decrease due to furloughs and holding positions of retiring employees vacant
as well as the expiration of four limited Document Management Technician positions.57
Information Systems & Technology
Now more than ever with over 90% working remotely, DHS
employees rely on technology to do their jobs. Information
Systems & Technology supplies the equipment employees
need to work from home successfully.58
Information Systems & Technology
Key Strategic Metrics
Information Systems & Technology, also known as Desktop Support, procures, issues, tracks, maintains,
and troubleshoots computers, laptops, computer accessories, and other IT equipment.
DHS IT Incidents Reported and Tasks Requested Types of Issues / Requests
600
Incidents Tasks New computer
500 build
15%
Apple iPhone
8%
400 Other Quick Ticket -
53% Find PC Later
6%
300 User Account
5%
Monitor
4% Adobe Acrobat
200
Pro DC
3%
Generic - Printer Headset (Skype
100 3% for Business
As of Sept. 15, Compatible)
3%
Information Systems
0 & Technology had
Jan-20 Feb-20 Mar-20 Apr-20 May-20 Jun-20 Jul-20 Aug-20 Sep-20
responded to 3,511
NOTE: An incident is an unplanned interruption or reduction of quality to an IT service. A DHS tickets in 2020.
request is something new to be provided; including a standard change, access, or information.59
Information Systems & Technology
Budget and 2021 Significant
Changes
Historical Budget and Expenditures
$3M
Unspent
$2M 2021 Budget by Category
$1,700
$0.9M $0.8M
$2M Personnel Services
Services and Supplies
Capital Equipment
$1M $494,750 Internal Services
$822,875
$1M
$600,922
$1.2M $1.3M $2.1M $1.9M 2021 FTEs
$M
2018 2019 2020 2021
9.00
Actuals Actuals Appropriated Recommended
2021 Significant Budget Changes
Personnel FTE Services / Supplies Internal Services
-$131,939 No Change -$404 +$404
Personnel budget decrease due to three employees retiring in late 2019 / early 2020 and new
employees being hired lower in the salary range.60
Administration
With 1,2000+ employees and hundreds of thousands of clients,
DHS requires operational infrastructure to deliver services. As a
charter agency and arm of the state, the department is subject to
an array of mandates and regulations.61
Administration
Key Strategic Metrics
Administration includes Executive Management, Communications, DHS’s legislative liaison, Facilities and
Security, and groups from the City Attorney’s Office and Office of Human Resources embedded within DHS .
The IDDEAS Program Manager and Administrator are budgeted in this cost center.
DHS Voluntary Resignations Voluntary
Resignations as
Within > 2 Years Within 2 Years Within 1 Year % of Workforce
100% 14%
90%
31% 31% 29% 12%
80%
50% 55% 55%
70% 10%
60%
8%
29% 34%
50% 37%
6%
40% 24%
20% 21%
30% 4%
20% 40% 37%
31% 2%
26% 25% 24%
10%
0% 0%
2015 2016 2017 2018 2019 As of Aug. 31,
202062
Administration Budget and
2021 Significant Changes
Historical Budget and Expenditures
DHS consolidated most contingency
$35M budget in Administration in 2019
$30M $1.6M
$1.4M 2021 Budget by Category
$6.0M
$2.3M
$25M $2.2M
$4.3M $5.1M Personnel Services
$1.2M $5.2M
$20M Services and Supplies
$1.1M $1.9M $4,592,513
$4.7M $6.4M
$7.1M Capital Equipment
$15M $2.0M
Internal Services
$4.4M
$10M $5.9M $10,678,185
$5.7M $13,919,009
$5M
$M
$4.3M $7.3M $12.3M $13.3M
2021 FTEs
$0
2018
Actuals
2019
Actuals
2020
Appropriated
2021
Recommended
31.83
Executive Management Legal Services Facilities / Security
Human Resources Communications Unspent
2021 Significant Budget Changes
Personnel FTE Services / Supplies Internal Services
-$155,331 +0.83 Unlimited $1,005,434 +$729,844
Personnel budget decrease due to furloughs and holding position of retiring employee vacant offset by
increase for Program Administrator to support IDDEAS program.
Services and supplies budget increase due to additional $1M for eviction assistance.
Internal services budget increase due to higher OHR and CAO personnel costs and billings.63
Administration
Expanded Eviction Assistance
Expenditures Revenues FTE Strategic Alignment
$1,000,000 $1,000,000 0 Essential Economic
Services Resilience
Increased property tax revenue in 2021 will enable DHS to expand eviction assistance. DHS intends
to make this funding available to clients in all programs—not just through General Assistance.
Likelihood of Leaving This Home Due to
Eviction in the Next Two Months Recent data from the U.S. Census Bureau’s
Not likely at Very likely, 6% statewide Household Pulse Survey show:
all, 14%
• Nearly 60% of Coloradans believe they are “somewhat likely”
to be evicted in the next two months.
Not very
likely, • 6% of Coloradans believe they are “very likely” to be evicted
Somewhat
20%
likely, 59%
in the next two months.
Source: U.S. Census Bureau, Household Pulse Survey, Phase 2. Aug. 19 to 31 for Colorado
Budget Equity Framework Summary
This program aims to keep families in their homes. Data indicate a greater percentage of people in Colorado who are Black and
Hispanic face housing insecurity. See slide 41 for more details.You can also read