On Minimal Unique Induced Subgraph Queries
←
→
Page content transcription
If your browser does not render page correctly, please read the page content below
applied
           sciences
Article
On Minimal Unique Induced Subgraph Queries
Lincheng Jiang 1,2 , Xiang Zhao 1, * , Bin Ge 1 , Shengze Hu 1 , Weidong Xiao 1 ,
Haichuan Shang 3,4 and Yumei Jing 5
 1   College of System Engineering, National University of Defense Technology, Changsha 410073, China;
     linchjiang@gmail.com (L.J.); binge@nudt.edu.cn (B.G.); shengzehucn@gmail.com (S.H.);
     wdxiao@nudt.edu.cn (W.X.)
 2   Courant Institute of Mathematical Sciences, New York University, New York, NY 10012, USA
 3   National Institute of Information and Communication Technology, Tokyo 184-8795, Japan;
     haichuanshang@gmail.com
 4   Institute of Industrial Science, The University of Tokyo, Tokyo 113-8654, Japan
 5   School of Electronics Engineering and Computer Science, Peking University, Beijing 100871, China;
     yumeijing@pku.edu.cn
 *   Correspondence: xiangzhao@nudt.edu.cn

 Received: 29 August 2018; Accepted: 19 September 2018; Published: 1 October 2018

 Featured Application: MUIS (Minimal Unique Induced Subgraph) query can be used in many
 potential applications, such as subgraph retrieval, graph visualization, representative subgraph
 discovery and vertex property exploration.

 Abstract: In this paper, a novel type of interesting subgraph query is proposed: Minimal Unique
 Induced Subgraph (MUIS) query. Given a (large) graph G and a query vertex (position) q in the graph,
 can we find an induced subgraph containing q with the minimal number of vertices that is unique in
 G? MUIS query has many potential applications, such as subgraph retrieval, graph visualization,
 representative subgraph discovery and vertex property exploration. The formal definition of MUIS
 is given and the properties are discussed in this paper. The baseline and EQA (Efficient Query
 Answering) algorithms are proposed to solve the MUIS query problem under the filtering-validation
 framework. In the EQA algorithm, the Breadth First Search (BFS)-based candidate set generation
 strategy is proposed to ensure the minimality property of MUIS; the matched vertices-based pruning
 strategy is proposed to prune useless candidate sets and the unnecessary subgraph isomorphism;
 and the query position-based subgraph isomorphism is proposed to check efficiently the uniqueness
 of the subgraphs. Experiments are carried on real datasets and synthetic datasets to verify the
 effectiveness and efficiency of the proposed algorithm under novel measurements. The influencing
 factors of the process speed are discussed at last in the paper.

 Keywords: graph data; induced subgraph; MUIS; subgraph isomorphism

1. Introduction
     Graphs have been used to model many complex data objects and their relationships in our real
world, such as bioinformatics, chemistry, social networks, software, the World Wide Web, and so
on [1–6]. With the increasing of graph data, graphs have been of extensive concern and deeply studied.
The management and mining of graph data can effectively solve the analysis and processing problems
of topological data [7–9]. One of the most important tasks in graph management is how to effectively
answer the various queries in graph databases. For example, medical staff needs to query whether
a given compound contains a particular substructure, and scientists want to query the number of
specific substructures such as triangle subgraphs in the graph database.

Appl. Sci. 2018, 8, 1798; doi:10.3390/app8101798                              www.mdpi.com/journal/applsci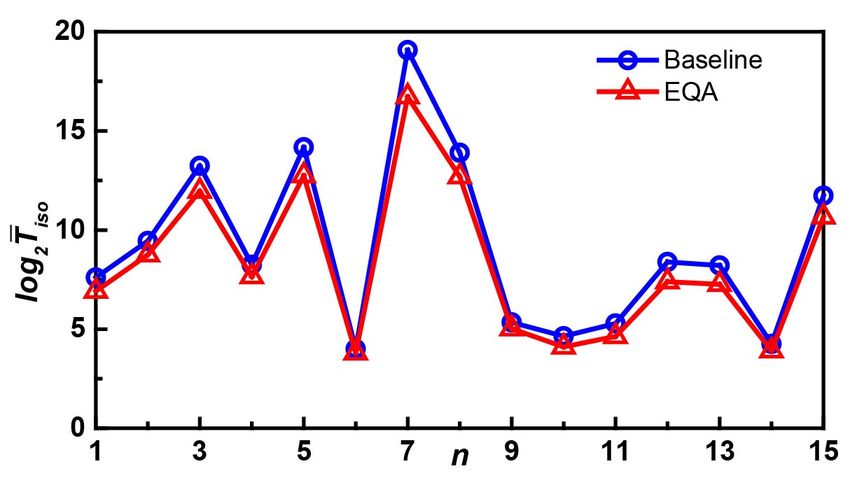
Appl. Sci. 2018, 8, 1798                                                                                       2 of 20

     In this paper, a novel type of interesting subgraph query is proposed. Suppose you are searching
in the human protein network using query position q (a specific gene at a specific position), and you
want to find a suitable subgraph containing the query position in the network for visualization purpose.
The subgraph should not be too small to avoid users not being able to distinguish the differences
between the neighborhood of the query position and that of other vertices, and the subgraph should not
be too large to avoid users getting confused with the returned redundant information. The subgraph
should be special and representative. For this demand, this paper presents the Minimal Unique
Induced Subgraph (MUIS) query.
     MUIS query refers to finding out a unique induced subgraph that contains a minimum number of
vertices and the given query position. MUIS query provides a new graph data access and management
method that has many potential applications, such as subgraph retrieval, graph visualization,
representative subgraph discovery and vertex property exploration.
     Answering MUIS query efficiently is far from trivial. There are many academic problems in the
research, such as what are the properties of MUIS, how to find MUIS candidate subgraphs, how to
prune useless candidate subgraphs as early as possible, how to ensure the minimum number of vertices
of MUIS and how to check the uniqueness of candidate graphs.
     We summarize the major contributions by the following four ingredients:
•     To our best knowledge, we are the first to propose MUIS query, which is a novel type of interesting
      and useful subgraph query. MUIS query enriches and develops graph data query and management
      methods;
•     For the novel type of subgraph query, the formal definition is given and the properties are
      discussed in this paper;
•     The EQA (Efficient Query Answering) algorithm is proposed to solve the MUIS query
      problem under the filtering-validation framework. In the EQA algorithm, BFS (Breadth First
      Search)-based candidate set generation strategy, matched vertices-based pruning strategy and
      query position-based subgraph isomorphism are proposed to improve the effectiveness and
      efficiency of MUIS query;
•     Through comprehensive experiments on real datasets and synthetic datasets, EQA is demonstrated
      to outperform the state-of-the-art model to answer MUIS query. Influencing factors of the process
      speed are also verified by the experiments.
     The rest of the paper is organized as follows. We define MUIS and discuss the properties in
Section 2, and review the related work briefly in Section 3. Then, we present our model in Section 4.
In Section 5, we report the experimental results, and we conclude the paper in Section 6.

2. Formal Definition and Properties
    In this section, we formulate the minimal unique induced subgraph query and discuss the
properties of MUIS.

Definition 1. (Graph) A labeled graph G is defined as (V, E, l ) where V is the set of vertices, E(⊆ V × V ) is
the set of edges and l is a label function that maps a vertex or an edge to a set of labels.

Definition 2. (Subgraph) If a graph G 0 has vertices and edges forming subsets of the vertices and edges of a
given graph G, G 0 is a subgraph of G.

Definition 3. (Induced subgraph) For a graph G = (V, E), an induced subgraph G 0 = (V 0 , E0 ) of G is the
graph whose vertex set V 0 is the subset of V and whose edge set E0 consists of all the edges in E with both
endpoints in V 0 .

    In Figure 1, the vertex set of g2 is V2 = {v1 , v2 , v3 } and the edge set of g2 is E2 = {(v1 , v2 ), (v1 , v3 )}.
The vertex set of g1 is V1 = {v1 , v2 , v3 , v4 }, and the edge set of g1 is E1 = {(v1 , v2 ), (v1 , v3 ), (v1 , v4 )}.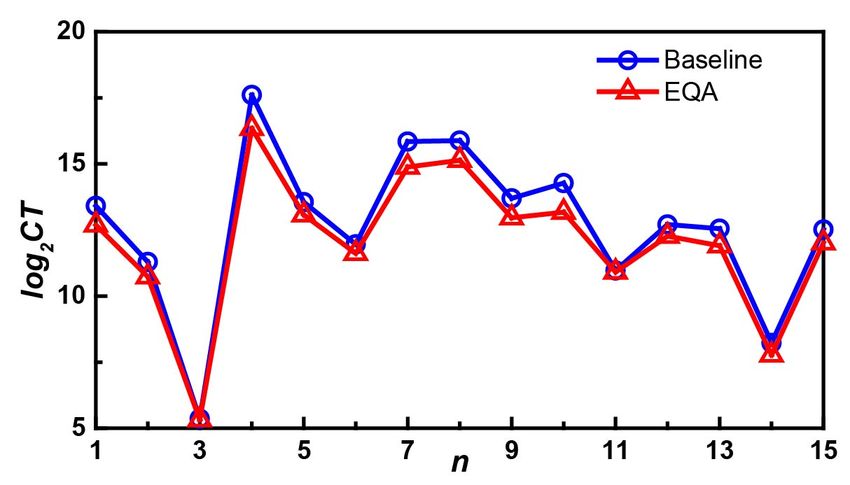
Appl. Sci. 2018, 8, 1798                                                                                                 3 of 20

 It is easy to get V2 ⊂ V1 and E2 ⊂ E1 . Moreover, l1 (v1 ) = l2 (v1 ) = a, l1 (v2 ) = l2 (v2 ) = b,
 l1 (v3 ) = l2 (v3 ) = b, l1 (v1 , v2 ) = l2 (v1 , v2 ) = x, l1 (v1 , v3 ) = l2 (v1 , v3 ) = x and (v1 , v2 ) ∈ E2 , (v1 , v3 ) ∈
 E2 ⇔ (v1 , v2 ) ∈ E1 , (v1 , v3 ) ∈ E1 . Therefore, g2 is an induced subgraph of graph g1 .

                                      Figure 1. An example of an induced subgraph.

Definition 4. (Graph isomorphism) A labeled graph G 0 = (V 0 , E0 , l 0 ) is isomorphic to another graph G =
(V, E, l ), denoted by G 0 ≈ G, iff there exists a bijection M : V → V 0 such that:

(1)    ∀u ∈ V, l (u) ⊆ l 0 ( M(u)),
(2)    ∀(u, v) ∈ E, ( M(u), M(v)) ∈ E0 and l (u, v) = l 0 ( M(u), M(v)),

        The bijection M is called an isomorphism between G 0 and G. We also say that G is isomorphic to
 G0   and vice versa.

 Definition 5. (Subgraph isomorphism) A labeled graph G 0 is subgraph isomorphic to a labeled graph G,
 denoted by G 0 ⊆ G, iff there exists a subgraph G 00 of G such that G 0 is isomorphic to G 00 .

      In Figure 2, we find subgraphs of data graph g that are isomorphic to query graph q. According to
 the definition of subgraph isomorphism, there exists two bijections M1 and M2 ,
       M1 = {(u1 , v3 ), (u2 , v5 ), (u3 , v9 ), (u4 , v6 )}; M2 = {(u1 , v6 ), (u2 , v5 ), (u3 , v9 ), (u4 , v3 )}.

                                     Figure 2. An example of subgraph isomorphism.

 Definition 6. (Self-isomorphism) If a labeled graph is isomorphic to itself, we call it self-isomorphism.

      In Figure 2, query graph q is self-isomorphism. There exists a self-isomorphism bijection M0 ,
 M0 = {(u1 , u4 ), (u2 , u2 ), (u3 , u3 ), (u4 , u1 )}.
      It can be seen from the bijection M0 that the vertices u1 and u4 can be interchanged in query graph
 q. The two vertices can be regarded as equivalent points. Self-isomorphism graphs usually contain
 equivalent points.
      Before the formal definition of MUIS is given, a definition of the Smallest Unique Induced
 Subgraph (SUIS) that is closely related to the MUIS definition is first given.

 Definition 7. (SUIS) A labeled graph Gs = (Vs , Es , ls ) is a SUIS of graph G = (V, E, l ), such that: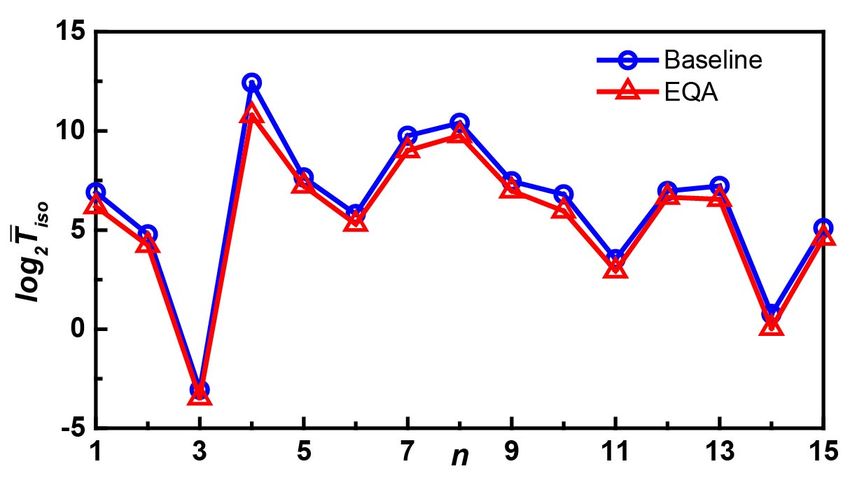
Appl. Sci. 2018, 8, 1798                                                                                  4 of 20

(1)   Gs is a an induced subgraph of G (induced subgraph property).
(2)   Gs is unique in the set of induced subgraphs of G, that is to say, there is no other induced subgraph
      of graph G isomorphic to Gs except itself (uniqueness property).
(3)   In G, there is no proper subgraph of Gs satisfying (1) and (2) (smallest one property).

       Given a vertex q in G, we are interested in the SUIS of graph G containing position q, denoted as
SUIS(q), which is closely related to MUIS.
       Figure 3 shows an example of SUIS and SUIS(q). Assume q = v5 , Gs1 is not an SUIS of G, but it is
an SUIS(q). Below is the verifying process:
       First, it is easy to verify that Gs1 is an induced subgraph of G according to Definition 3.
Second, we can verify that Gs1 is unique according to Definition 4. Third, on the one hand,
since {{v1 ,v2 },{(v1 ,v2 )}}, an induced subgraph of Gs1 is also unique, and Gs1 is not an SUIS. On the
other hand, all the induced subgraphs of Gs1 containing q, except itself, {{v5 }, ∅}, {{v1 ,v5 },{(v1 ,v5 )}} and
{{v2 ,v5 },{(v2 ,v5 )}}, are not unique. Gs1 satisfies the smallest one property when taking into account q,
so Gs1 is an SUIS(q).
       Gs2 is both an SUIS and an SUIS(q) of G, which can also be verified by the same method.
The example clearly shows the difference between SUIS and SUIS(q).

                 Figure 3. An example of the Smallest Unique Induced Subgraph (SUIS) and MUIS.

 Definition 8. (MUIS) For a graph G = (V, E, l ) and a vertex q(∈ V ), the MUIS subgraph is the induced
 subgraph in the set of SUIS(q) of G with the minimal number of vertices, denoted as MUIS(q). More intuitively,
 MUIS(q) is the induced subgraph of G containing q with the minimal number of vertices, which is unique.

       Vertex q is called the query vertex or query position. Obviously, MUIS is a concept that is
 closely related to the query position. Similar to SUIS, MUIS has the induced subgraph property,
 uniqueness property and minimality property. For the same graph, a different query vertex may obtain
 a different MUIS.
       Figure 3 shows an example of MUIS. Suppose v5 is the query vertex. Both Gs1 and Gs2 are SUIS(q)s
 as proven above. The number of vertices of Gs2 is more than that of Gs1 . Since the number of vertices
 is not minimal, Gs2 is not an MUIS. It is easy to find out that the minimal induced subgraph of G
 containing the query position is {{v5 }, ∅}, which is not unique. Furthermore, we can verify that the
 induced subgraphs of G containing the query position with two vertices are also not unique. Therefore,
 Gs1 is an MUIS.

 Definition 9. (Problem definition) Minimal Unique Induced Subgraph Query (MUISQ) is to find an MUIS
 for the given graph and query position.

     We show the induced subgraph property, the uniqueness property and the minimality property
 of MUIS above. Furthermore, we explore the property related to the number of MUISs below.
 Number property. Given a graph G = (V, E, l ) and a vertex q(∈ V ), there exists at least one SUIS,
 SUIS(q) and MUIS.
Appl. Sci. 2018, 8, 1798 5 of 20
Proof: G itself is unique. Therefore, at least one SUIS, or SU IS(q), or MUIS is itself in
extreme cases.
Therefore, there may exist may induced subgraphs satisfying the conditions. MUISQ is a task to
find out any one subgraph satisfying the conditions. There is no need to find out all MUISs.
3. Related Works
We will briefly review areas that are relevant to the concept of subgraph query in this section.
3.1. Subgraph Matching Query
Subgraph matching query is the most basic query task in the graph query domain, and it is
often the basis of many other query tasks. The subgraph matching query is divided into subgraph
isomorphism [10] and similarity matching [11] according to whether strict matching is required.
Subgraph isomorphism is defined as follows: for a data graph G and a query graph Q, retrieve all
subgraphs of G that are isomorphic to Q, which has been proven to be an NP-complete problem in
several papers [12,13]. In recent years, many algorithms such as GraphGrep [14], VF2 [15], QuickSI [16]
and TurboISO [17] have been proposed to solve the problem. In the subgraph isomorphism process,
when it cannot be strictly matched, the conclusion that the query graph and the subgraphs of data
graph are different will be made. However, in real applications, the query graph can be considered to
be isomorphic to a subgraph of the data graph within the error tolerance. Depending on the application,
the error can have different evaluation criteria. For example, an effective method is to use the edit
distance of the graph [18,19].
3.2. Frequent Subgraph Mining
Frequent subgraph mining refers to finding out the subgraphs whose number of occurrences is
higher than a given threshold [20–22]. The output of frequent subgraph mining can be used to provide
support for other graph tasks, such as graph classification or clustering. The core step of frequent
subgraph mining is computing subgraph frequencies, which is computationally hard. There are two
subgraph enumeration methods: one is the breadth-first search method, such as AGM [23] and FSG [24],
and the other is the depth-first search method, such as gSpan [25], FFSM [26] and GASTON [27].
To reduce the computational complexity in large graphs further, new emerging techniques deploy
approximate algorithms to find frequent subgraphs.
3.3. Correlation Subgraph Query
Correlation subgraph query aims to find out the subgraphs statistically correlated to query graph
Q [28,29]. The work in [30] proposed the CGSearchalgorithm, which adopted the commonly-used
Pearson’s correlation coefficient as the correlation measure to take into account the occurrence
distributions of graphs. The paper got the subgraph set with Pearson’s correlation coefficient higher
than a certain threshold between the subgraph and the query graph. The work in [31] focused on a new
subgraph query based on frequent subgraph mining and correlation subgraph query, named frequent
correlated subgraph pairs discovery. The paper proposed FCP-Miner, a fast approximate algorithm to
solve the problem.
3.4. Network Motif Discovery
The network motif comprises patterns of connectivity that occur significantly more frequently
than expected, which was introduced in [32]. Network motif discovery refers to the discovery of
subgraphs that are overrepresented, with a p-value higher than a certain threshold. Network motif
discovery is a very important research direction in graph query, and it is especially important for the
analysis of biological networks. As frequent subgraph mining, computing subgraph frequencies is
also an important step for network motif discovery. Many classic algorithms have been proposed toAppl. Sci. 2018, 8, 1798 6 of 20
solve the problem, such as Grochow [33] and gTrie [34]. Recently, [35] proposed an analytical method
to identify statistically-significant labeled motifs.
Besides the above main subgraph query research, there are also some other interesting graph
query problems, such as the classic maximum common subgraphs problem [36], the connected induced
subgraph problem [37], similarity search in an XML database [38], and so on. MUIS query enriches
and develops graph query technology. Research on the existing subgraph query technology is helpful
to solve the MUIS query problem.
4. The Proposed Model
This section presents the proposed model for the MUIS query process. We first show the general
filtering-verification framework for the MUIS query problem. Then, we propose a candidate set
generation strategy and pruning strategy in the filtering process and the novel subgraph isomorphism
method in the verification process. Baseline and EQA algorithms are presented at last.
4.1. The General Framework
This paper adopts the filtering-verification solving strategy, which is commonly used in graph
query problems [16,17]. For this novel graph query task, both the filtering process and verification
process have new content. In the filtering process, a series of candidate subgraphs is generated
by searching the induced subgraph space. The induced subgraph space refers to the set of all the
induced subgraphs of the given graph. The generated candidate subgraphs are the points in the
induced subgraph space. Then, the candidate subgraphs that do not meet the conditions are filtered
out by various pruning methods. In the verification process, the subgraph isomorphism testing is
performed to check whether the candidate subgraphs generated in the filtering process are unique or
not. Subgraph isomorphism has been proven to be an NP-complete problem in many papers [12,13].
Therefore, the times of subgraph isomorphism testing must be reduced as much as possible due to its
high cost. This requires us to design better candidate set generation and pruning strategies.
The above steps ensure the induced subgraph property and uniqueness property of MUIS, but the
minimality property cannot be guaranteed. The minimality property requires that the found MUIS has
the least number of vertices in all unique induced subgraphs containing the query position. Therefore,
we cannot judge whether an induced unique subgraph containing the query position is MUIS before
we know that all the induced subgraphs containing the query position with less vertices are not unique.
In Figure 4, considering that v1 is the query position, we can see that the induced subgraph g3 is
unique and contains the query positon, but we cannot judge whether g3 is MUIS, as explained above.
From the figure, we can also see that the induced subgraph g2 containing the query positon is also
unique, and the number of vertices is less than that of g3 . Therefore, when searching the induced
subgraph space, the search must be performed from the lower layer to the higher layer, that is to say,
the induced subgraphs are searched in ascending order of the number of vertices.
Figure 4. An example to show the importance of searching induced subgraphs in ascending order of
the number of vertices.Appl. Sci. 2018, 8, 1798 7 of 20
The general framework for MUIS query is given in Algorithm 1, which contains a global Boolean
variable Found to show whether MUIS has been found. We search the space from the lower layer to
the high layer (Lines 2∼3). We then check whether the subgraph is unique in Line 4. Line 5 is a further
uniqueness testing for Line 4, which will be explained in detail later. When MUIS is found, we can exit
the main loops of the algorithm (Lines 6∼15). If the value of Found is still false after searching all the
induced subgraph space, the data graph itself is the MUIS since it is a unique induced subgraph and
the number of vertices is minimal in this situation (Lines 16∼17).
Line 5 addresses the self-isomorphism problem, which may cause misjudgment. Figure 5 is a
false positive example. Consider data graph G and the query position v3 . g3 is an induced graph
containing the query position and has the minimal number of vertices. However, it is isomorphic to
itself under mapping M = {(v1 , v1 ), (v4 , v2 ), (v2 , v4 )}. Since g3 gets an isomorphic induced subgraph,
we may judge it to be not unique. However, in fact, there is no other induced subgraph isomorphic to
g3 in G. Therefore, g3 is unique. It is necessary to avoid such a misjudgment. If all the vertices of the
two induced subgraphs are the same in the original data graph, it is self-isomorphism.
Algorithm 1 The general framework.
Input:
data graph, G = (V, E, l );
query position, q;
Output:
MUIS(q);
1: Found = f alse, the number of vertices of induced subgraphs i = 0 ;
2: for i = 1 to |V | do
3: for each induced graph gi with the number of vertices i and containing the vertex q do
4: isomorphism testing for gi to judge uniqueness;
5: check gi whether is self-isomorphism;
6: if gi is unique then
7: Found = true; MUIS(q) = gi ; break;
8: end if
9: end for
10: if Found then
11: Break;
12: end if
13: end for
14: if Found then
15: return MUIS(q)
16: else
17: return G
18: end if
Figure 5. An example to show the self-isomorphism problem.Appl. Sci. 2018, 8, 1798 8 of 20
4.2. BFS-Based Candidate Set Generation Strategy
The BFS-based candidate set generation strategy can effectively search the induced subgraph
space containing query position q. The strategy mainly contains the following four important ideas:
(1) Search the induced subgraph space containing query position q in ascending order of the number
of vertices. In particular, the first layer of the induced subgraph space is the query position
self-constructed induced subgraph {{q}, ∅, l }. Its importance will be explained in detail later.
(2) Divide all the vertices of the data graph into two subsets. The two subsets are defined as follows:
V in denotes the vertices already contained in the current induced subgraph. Note that it must
have query position q ∈ V in .
V out denotes the vertices not contained in the current subgraph. Note that it must have
V out = V − V in .
(3) When performing BFS for the (i + 1)-th layer induced subgraph from the i-th layer induced graph
(containing i vertices), select a vertex v from the subset V out of the i-th layer induced subgraph.
If vertex v is connected to any vertex of the subgraph, then add vertex v into the vertex set of the
subgraph to generate a new induced subgraph (containing i + 1 vertices).
(4) We eliminate the generated duplicate induced subgraphs, which have been already obtained by
other i-th layer induced subgraphs and vertices in V out , which can greatly reduce subsequent
computational overhead.
Figure 6 is an example of the induced subgraph space search path. Data graph G = (V, E, l ),
V = {v1 , v2 , v3 , v4 , v5 }, E = {(v1 , v2 ), (v1 , v3 ), (v1 , v5 ), (v2 , v4 ), (v2 , v5 ), (v3 , v4 ), (v4 , v5 )}. Set query
position q = v2 . g3 is an induced subgraph of graph G with three vertices and containing the query
position q. g3 = (V3 , E3 , l ), V3in = V3 = {v1 , v2 , v4 }, V3out = V − V3in = {v3 , v5 } in this example. Select a
vertex v5 from V3out and find the existence of edge (v1 , v5 ) between vertex v5 and vertex v1 in V3in after
checking. Then, add the vertex v5 , the edge (v1 , v5 ) and other edges between v5 and other vertices
in V3in ((v2 , v5 ) and (v4 , v5 ) in this example) to the induced subgraph g3 . In this case, we can get the
induced subgraph g4 with four vertices and containing the query position q. Similarly, select the vertex
v3 from V3out and obtain another induced subgraph g40 .
Figure 6. An example of the induced subgraph space search path.
Algorithm 2 shows the entire process of the BFS-based candidate set generation algorithm.
Gi denotes a set of the induced subgraphs with i vertices, and gi denotes an induced subgraph with i
vertices, thus gi ∈ Gi . Algorithm initialization is extremely important in the algorithm. The induced
subgraph composed of the query position q is initialized as the first layer induced subgraph, i.e.,
g1 = {{q}, ∅, l }, G1 = g1 in Line 1. This initialization can ensure that the subgraphs searched by the
algorithm absolutely contain query position q and that all other induced subgraphs not containing
query position q are prune off, which makes the candidate set non-repetitive and complete. Then,
we search the space from the second layer to the |V |-th layer (Line 2). The details to generate a
candidate have been already introduced above and are shown in Lines 3∼9. If gi does not exist in
Gi , add gi to Gi (Lines 10∼12). In addition, it is worth mentioning that there is no need to find all the
induced subgraphs containing the query position q. When the MUIS(q) that satisfies the condition is
obtained in a certain layer, the search can be stopped.Appl. Sci. 2018, 8, 1798 9 of 20
Algorithm 2 BFS-based candidate set generation algorithm.
Input:
data graph, G = (V, E, l );
query position, q;
Output:
induced graphs, gi ;
1: initialize the first layer of the induced subgraph space, one vertex induced graph g1 = {{q}, ∅, l },
report g1 ;
2: for i = 2 to |V | do
3: set i vertices induced subgraph set Gi =∅;
4: for each i − 1 induced graph gi−1 ∈ Gi−1 do
5: compute V in and V out of gi−1 ;
6: for each vertex v ∈ V out do
7: if there is an edge between v and vertices in V in then
8: get all vertices in V in and v to generate induced graph gi , report gi
9: end if
10: if gi ∈
/ Gi then
11: add gi to Gi
12: end if
13: end for
14: end for
15: end for
4.3. Matched Vertices-Based Pruning Strategy
The pruning strategy based on the matched vertices can effectively reduce the number of graphs
or regions that execute isomorphism testing. The pruning strategy mainly contains the following two
important ideas:
(1) During the isomorphism testing, some vertices in some subgraphs of data graph G are measured
not to derive the subgraphs that are isomorphic to the induced subgraph. These vertices can be
recorded for pruning.
(2) Consider graph g1 = (V, E, l ), query position q ∈ V and graph g2 = (V 0 , E0 , l 0 ). In the case
of q0 (∈ V 0 ) corresponding to q, if all the subgraphs containing vertex q0 of graph g2 are not
isomorphic to g1 , then any hypergraph of graph g1 and all subgraphs containing vertex q0 of
graph g2 are not isomorphic in this case.
The proposition in (2) can be proven as followings. Under the given conditions, assume that a
hypergraph of graph g1 is isomorphic to a subgraph containing vertex q0 of graph g2 . Since vertex q
corresponds to vertex q0 , graph g1 must be isomorphic to a subgraph containing vertex q0 of graph
g2 , which contradicts the given condition that graph g1 is not isomorphic to any subgraph containing
vertex q0 of graph g2 . Therefore, the assumption is not true, and thus, the proposition is true.
The concept of hypergraph used here is a commonly-used concept in graph data research.
The hypergraph is relative to the subgraph. If graph G1 is a hypergraph of graph G2 , then graph G2 is
a subgraph of graph G1 .
Figure 7 is an example of the above proposition. In the figure, assuming that the query position
is vertex v1 in graph g1 and vertex v1 in graph g2 corresponds to vertex v1 in graph g1 , it can be seen
from the figure that graph g1 is not isomorphic to any subgraph of graph g2 in this case.Appl. Sci. 2018, 8, 1798 10 of 20
Figure 7. An example to show isomorphism between the hypergraph and subgraph.
Someone may point out that subgraph {{v2 , v4 }, {(v2 , v4 )}} of graph g2 is isomorphic to graph g1 ,
but this does not satisfy the condition that vertex v1 in graph g2 corresponds to vertex v1 in graph g1 .
Therefore, it is not considered. The hypergraph gh of graph g1 shown in the figure is not isomorphic
to any subgraph of graph g2 under the condition that vertex v1 in graph g2 corresponds to vertex v1
in graph g1 . However, if removing the constraint condition, the hypergraph gh is isomorphic to the
subgraph {{v1 , v2 , v4 }, {(v1 , v2 ), (v2 , v4 )}} of graph g2 . Therefore, the constraint that vertex v1 in the
graph g2 corresponds to vertex v1 in graph g1 is extremely important. There is no need to enumerate
all hypergraphs of graph g1 infinitely. This example is just for the ease of understanding the above
proposition.
The following shows how to use the proposition in (2) for pruning. Considering graph g = (V, E, l )
and query position q and setting the query position q as the starting point of isomorphism testing
(we do this in this way in our paper), the vertices corresponding to q, denoted by Vq , must be the
vertices with the same label as q in the set V, i.e., q ∈ / Vq and Vq ⊂ V. Assuming a vertex q0 (∈ Vq ) and
in the case of q0 corresponding to q, the i-th layer induced subgraph gi containing q is not isomorphic
to any subgraphs containing q0 , it can be derived by the proposition that all the (i + 1)-th layer
induced subgraphs (hypergraphs of gi ) derived from gi in the induced subgraph space cannot find
their isomorphic subgraphs containing q0 , so that all the branches with q0 corresponding to q can be
pruned off when performing the subgraph isomorphism testing.
Figure 8 shows an example of the matched vertices-based pruning strategy. In the data
graph, assuming that the query position q is v4 , then the set of vertices corresponding to q is
Vq = {v1 , v6 , v8 }. In the case of v4 corresponding to v1 and v8 in Vq , the second layer induced subgraph
g2 = {{v4 , v7 }, {(v4 , v7 )}} is not isomorphic to any subgraph containing v1 or v8 . Thus, when testing
the third layer induced subgraphs g3 = {{v2 , v4 , v7 }, {(v2 , v4 ), (v4 , v7 )}} derived from g2 , do not
consider v1 and v8 , and only test subgraphs derived from v6 .
Figure 8. An example of the matched vertices-based pruning strategy.
4.4. Query Position-Based Subgraph Isomorphism
Subgraph isomorphism is used to check the uniqueness of candidate subgraphs in our paper.
Most subgraph isomorphism algorithms are implemented with the backtracking strategy [15–17],
which finds solutions by incrementing partial solutions or abandoning them when it is determined
that they cannot be completed until a full match is found. A set of candidate vertices C (u) for query
vertex u is computed at the first step according to specific rules. If C (u) is empty, that is to say
no isomorphic subgraphs, the programs exit. Otherwise, the algorithms invoke the main recursive
function SubgraphSearch to match one query vertex with one data vertex one time.Appl. Sci. 2018, 8, 1798 11 of 20
We propose a query positon-based subgraph isomorphism algorithm to improve the testing
efficiency for our application. The main ideas is discussed in detail as follows.
(1) Use the query position as the starting vertex of the isomorphism testing
Using the query position as the starting vertex of the isomorphism testing makes full use of the
query position in the data graph, and it is the most important improvement in the isomorphism
testing algorithm. When the subgraph isomorphism testing is performed on candidate subgraphs,
matching the query position first can avoid invalid and extra isomorphism testing.
Figure 9 is an illustration of the importance of matching the query position first. Considering the
data graph G and the query position v1 , g3 is an induced subgraph of G containing the query
position with three vertices. If we do not use v1 as the first matching vertex, it will be matched in
two directions. For the first direction, we can get matched pairs of vertices (v3 , v3 ), (v2 , v2 ) and
(v1 , v1 ), where the isomorphic subgraph is g3 itself. For the other direction, we can get matched
pairs of vertices (v3 , v3 ) and (v2 , v4 ) and will stop for the non-matched vertices v1 in g3 and v5 in
G. We have to do more testing to judge whether g3 is unique. When using v1 as the first matching
vertex, the second direction testing can be avoided.
Figure 9. The importance of matching the query position first.
In fact, much local or partial matching can be avoided when using the query position as the
starting vertex of the isomorphism testing, thus judging whether the induced subgraph is unique
as soon as possible and improving the efficiency of verification process. In addition, we use the
query rewrite method in [17] to rank the other vertices in the query graph and get a matching
order according to the ranking value. In this way, we can reduce the candidate regions for
performing subgraph isomorphism search and improve the efficiency.
(2) Sorting the candidate vertices by degree for pruning
For vertex pairs (u, v) in the candidate set P, u represents the vertex from induced subgraph gi ,
and the set of u can be denoted as P( gi ), while v represents the vertex from data graph G, and the
set of v can be denoted as P( G ).
In the undirected graph, before judging whether vertex pairs (u, v) in P are matched, sort the
vertices in P( G ) by degree in descending order. Since u and v are matched only when the degree
of v is greater than or equal to the degree of u, when the degree of v is less than the degree of u,
it can be pruned. For a given vertex u, if the degree of the vertex v taken from the sorted P( G ) is
less than the degree of u, then the degree of the vertices after v in P( G ) must be less than the degree
of u, which can be pruned directly without further judgment. The pruning algorithm is denoted as
PruningDegree(u, v). In the directed graph, the vertices can be sorted by in degree and out degree.
Both can be used for pruning.
Algorithm 3 is a detailed description of the query position-based subgraph isomorphism.
The algorithm starts from empty mapping M, and the global Boolean variable unique is set to true
value at the beginning in Line 1. The algorithm uses the query position as the starting point of the
isomorphism testing in Line 2. The PruningDegree pruning function is called before adding the first
vertex mapping pair to maximize the performance (Line 3). Then, we invoke QueryRewrite to get the
matching order of the other vertices except the query position (Line 4). For each vertex that matchesAppl. Sci. 2018, 8, 1798 12 of 20
the query position, the algorithm calls the recursive subroutine SubgraphSearch to find the complete
isomorphism mapping (Lines 5∼8).
Algorithm 3 Query position-based subgraph isomorphism.
Input:
data graph, G = (V, E, l );
query position, q;
induced graph, gi
Output:
Boolean variable to answer whether another induced graph in G isomorphic to graph gi , unique;
1: M := ∅, unique = true;
2: get all vertices wq (∈ P( G )) whose label is the same as q, sort P( G ) by degree in descending order;
3: PruningDegree(q, wq );
4: O = QueryRewrite(q, gi );
5: for each wq ∈ P( G ) do
6: M := M ∪ (q, wq );
7: subgraphsearch( gi , G, M, O, ...)
8: end for
Subroutine SubgraphSearch
1: if | M | = |V ( gi )| then
2: report M;
3: if the isomorphism subgraph of G is gi itself then
4: report sel f isomorphism;
5: else
6: set unique = f alse, stop all procedures;
7: end if
8: else
9: v := NextQueryVertex (O, ...);
10: compute candidate vertices w (∈ W ) of v;
11: PruningDegree(v, w) ;
12: for each w ∈ W and w is not yet matched do
13: if IsJoinable( gi , G, M, v, w, ...) then
14: set M := M ∪ (v, w);
15: subgraphsearch( gi , G, M, O, ...)
16: end if
17: end for
18: end if
In SubgraphSearch, Lines 1∼7 present the termination condition of the program. When a full
mapping is found (Line 1), we check whether it is self-isomorphism (Line 3). If it is self-isomorphism,
we continue to find the real isomorphism subgraph (Line 4). If not, we set unique as false and stop
the procedure (Line 6). If unique is true when compared with all other induced subgraphs containing
q, all main programs exit, and MUIS is obtained. Lines 8∼18 show how to increase partial mapping.
The NextQueryVertex function is invoked to get the next query vertex (Line 9). For the current query
vertex v, compute and refine the candidate vertex set W subsequently (Lines 10∼11). Then, for each
vertex w in W, the IsJoinable function is invoked to check whether the edges between v and already
matched query vertices in query graph gi have corresponding edges between w and already matched
data vertices in data graph G (Lines 12∼13). If w is qualified, add (v, w) to the already matched pairs
of vertices (Line 14), and then, continue to invoke SubgraphSearch recursively to match the remaining
query vertices and data vertices (Line 15).Appl. Sci. 2018, 8, 1798 13 of 20
4.5. Baseline and EQA Algorithms
The baseline and EQA (Efficient Query Answering) algorithms, to answer MUIS query,
are presented after introduction of the general framework and related strategies. Both algorithms use
the BFS-based candidate set generation strategy. The baseline algorithm adopts the latest outstanding
subgraph isomorphism testing method TurboISO [17] to check the uniqueness of candidate subgraphs,
while the EQA algorithm makes use of both the matched vertices-based pruning strategy and the
query position-based subgraph isomorphism method. Comparative experiments and results for the
two algorithms will be shown in the next section.
5. Results
This section describes the experimental results of the proposed algorithms. All the algorithms
were implemented using the C++ programming language. Experiments were run on a Win7 64 system
with a 2.7-GHz Intel Core i5 and 4 GB 1333 MHz DDR3 memory. The comparative experiments were
conducted on real datasets and synthetic datasets. Novel experimental performance measurements for
MUIS query are proposed, and the influencing factors of the query process efficiency are discussed.
5.1. Experimental Performance Measurement
Two experimental performance measurements were used in this paper.
(1) Average isomorphism time
The running time of each algorithm in this paper contains two parts: the time of filtering and the
time of verification. The time of filtering includes the time of searching and pruning in the induced
subgraph space. Since the algorithms use the same method to search the induced subgraph space
and the time of pruning is negligible relative to the time of searching, the filtering time was
almost the same. Therefore, we adopted the verification time as the performance measurement.
The verification time is the time of subgraph isomorphism testing.
During the algorithms’ running process, the performance of the computer dynamically changes.
Therefore, the average isomorphism time of five experiments was used as a criterion for evaluation.
The average isomorphism time is represented by the symbol T iso .
(2) The times of calling the recursive function
Compared with the isomorphism time, the times of calling the recursive function were more
stable and could better reflect the performance of the algorithms. As long as the data graph
and query position were given, the times of calling recursive functions were the same for each
algorithm and would not change when the PC hardware and software environment change.
The times of calling recursive function are further explained below. In the MUIS query process,
when the isomorphism testing was performed, the recursive function is called to determine whether
the vertex pairs can join the current partial mapping. A better performing algorithm has a good
pruning strategy at every stage to avoid some isomorphism testing or avoid calling recursive functions,
so in general, the total number of times to call the recursive function is less. Figure 10 is an example of
calling the recursive function and backtracking, where each line represents a calling of the recursive
function. Assuming that the vertex set of the candidate induced subgraph is {v1 , v2 , v3 , v4 }, it can be
seen from the figure that Algorithm b utilizes the pruning strategy to avoid the isomorphism testing
between the vertex v1 and the vertex v5 ; thus, the times of calling recursive function were less than
those of Algorithm a. The times of the calling recursive function are denoted as CT.Appl. Sci. 2018, 8, 1798 14 of 20
Figure 10. An example of calling the recursive function and backtracking.
5.2. Experiment on the YEAST Dataset
The YEASTdataset can be downloaded from the official website of Pajek. Pajek is a large-scale
complex network analysis tool. The official website also contains many other graph data test sets.
The YEAST dataset has been used in [39]. The dataset has 2361 vertices, 7182 edges and 13 different
vertex labels. The average degree for each vertex is six, and the maximum degree is 66.
During the process, 15 query points were randomly selected to conduct the experiments.
The found MUIS, T iso and CT were recorded or calculated for each experiment. Table 1 shows
the experiment number, the query position number, the number of vertices of found MUIS and the
found MUIS. Both the baseline and EQA algorithms can complete the MUIS query process.
Table 1. Experimental results on the yeastdataset.
# Query Position Vertex # MUIS
#1 265 4 257 265 267 991
#2 321 5 81 208 321 522 1024
#3 345 5 146 338 345 400 849
#4 495 4 495 499 1525 1816
#5 620 6 275 303 619 620 625 866
#6 752 4 67 71 752 1040
#7 899 8 186 895 896 891 898 899 900 1280
#8 987 5 368 507 987 1201 1477
#9 1501 4 144 429 1501 1678
#10 1758 5 1483 1526 1724 1725 1758
#11 1895 3 198 1576 1895
#12 1984 5 17 1191 1508 1982 1984
#13 2013 6 1515 1553 1559 1562 1563 2013
#14 2236 4 1442 1617 1885 2236
#15 2300 6 1005 1357 1517 2121 2122 2300
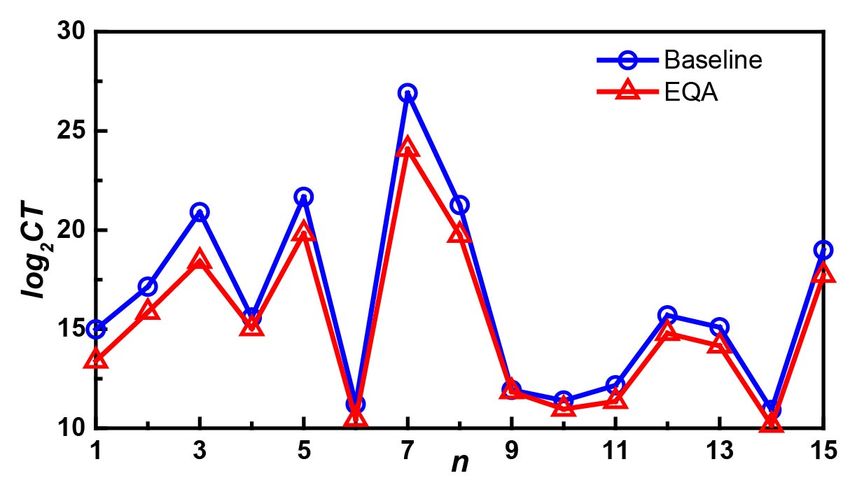
Figure 11 shows the comparison of the experimental results of the baseline and EQA algorithms
on the YEAST dataset. Figure 11a shows the comparison of T iso , and Figure 11b shows the comparison
of CT. The X-axis of the figure represents the experiment number, while the Y-axis of Figure 11a
represents the logarithm of T iso to base two, and the Y-axis of Figure 11b represents the logarithm of
CT to base two.
As can be seen from Figure 11, the performance of EQA was better than that of the baseline
algorithm according to the two criteria. Moreover, in general, the longer T iso , or the more CT,
the greater advantage of EQA over the baseline algorithm. It can be seen from the figure that
the seventh experiment took the most time, and the advantage of the EQA was also the greatest.
In addition, it can be seen from the figure that no matter which algorithm, the change trend of T iso
and CT was almost the same, and the efficiency of the MUIS query algorithms can be well evaluated.
As mentioned earlier, the measurement CT was more stable, so it is recommended to use CT to evaluate
the performance of the algorithms.Appl. Sci. 2018, 8, 1798 15 of 20
(a) (b)
Figure 11. Comparison results on the YEAST dataset. (a) The comparison of T iso ; (b) the comparison
of CT. EQA, Efficient Query Answering.
5.3. Experiment on the HPRD Dataset
The HPRDdataset is provided by Human Proteinpedia, which was used in [40].
Human Proteinpedia is a community that shares and integrates human protein data. The dataset
has 9460 vertices, 37,081 edges and 301 different vertex labels. The average degree for each vertex is
seven, and the maximum degree is 249.
During the process, 15 query points were randomly selected to conduct the experiments.
Similar information as the YEAST dataset is shown in Table 2. Both the baseline and EQA algorithms
can complete the MUIS query process on the HPRD dataset.
Table 2. Experimental results on the HPRDdataset.
# Query Position Vertex # MUIS
#1 1890 4 100 568 723 1890
#2 2155 3 134 2155 2157
#3 2977 2 1098 2977
#4 3434 4 236 2329 3434 6928
#5 3789 3 1144 3789 4832
#6 4334 3 69 4334 4677
#7 4567 4 87 2734 4567 4569
#8 5332 4 77 153 235 5332
#9 5347 5 269 346 347 349 5347
#10 5701 4 659 2255 5701 6596
#11 5734 3 5734 5767 5768
#12 6758 4 419 1282 1818 6758
#13 7345 4 1686 3142 3840 7345
#14 8434 3 127 2959 8434
#15 9147 4 1457 1728 3277 9417
Comparing Tables 2 and 1, it can be found that the number of vertices of MUIS found on the
HPRD dataset was less than that of MUIS found on the YEAST dataset in most cases. That is to say,
less layers were searched to find MUIS on the HPRD dataset. This indicates that the time to answer
MUIS query on the HPRD dataset was less than that on the YEAST dataset in some sense.
Figure 12a,b shows the comparison of T iso and CT of the baseline and EQA algorithms separately.
The meaning of the X-axis and Y-axis of Figure 12 is the same as that of Figure 11.
According to the two criteria T iso and CT shown in Figure 12, the performance of EQA was better
than that of the baseline algorithm. Comparing Figure 11 with Figure 12, we find that the time to query
MUIS on the HPRD dataset was usually less than that on the YEAST dataset, which was the same as
the conclusion observed in Table 2. On the HPRD dataset, in many cases, both the baseline and EQA
algorithms have less query time, so the performance advantage of EQA was not as obvious as that on
the Yeast dataset. This further verifies the above-mentioned conclusion: in the MUIS query process,
the longer T iso , or the more CT, the greater advantage of EQA over the baseline algorithm.Appl. Sci. 2018, 8, 1798 16 of 20
(a) (b)
Figure 12. Comparison results on the HPRD dataset. (a) The comparison of T iso ; (b) the comparison
of CT.
The reason for this phenomenon is speculated as follows. Although both the number of vertices
and the number edges of the HPRD dataset were significantly larger than those of the YEAST dataset,
the average degrees of the vertices of the two datasets had little difference. As a result, there was
little difference between the number of induced subgraphs generated by the layer with the same
number of vertices, as well as the number of candidate MUISs that needed to execute the isomorphism
testing. However, the number of vertex labels in the HPRD dataset was significantly more than the
number of vertex labels in the YEAST dataset, so on the HPRD dataset, the isomorphism testing was
faster, and there were more unique induced subgraphs and a higher probability to obtain MUIS earlier.
Therefore, the query time on the HPRD dataset was relatively shorter. Experiments on the synthetic
dataset will further verify the above speculation.
5.4. Experiment on the Synthetic Datasets
Experiments were carried out on the synthetic datasets to investigate the influencing factors of
EQA process speed. We designed and performed experiments on different sizes of graphs and different
numbers of vertex labels and edge labels of graphs. We could also further verify the effectiveness and
scalability of EQA algorithms through the experiments.
The synthetic datasets were generated by the graph data simulation generator used in [24].
The parameters of the simulation generator can be set by the users, including the number of edges,
the number of vertex labels and the number of edge labels. As mentioned above, T iso and CT can
evaluate the performance of the algorithms, and the trends were almost the same; however, CT was
more stable. Therefore, CT was used in the experiments on the synthetic dataset as the evaluation
criteria. We randomly selected 100 query positions for each dataset and calculated the average value
of CT from the 100 experiments, denoted as CT.
(1) Experiments on the increasing number of edges
We investigated the influence of graph size on EQA process speed first. Keep the same number of
vertex labels and edge labels, and increase the number of edges. The number of vertices was 3000;
the number of edge labels was set as five; the number of vertex labels was set as five; and the
number of edges was set as 6000, 7000, 8000 and 9000 separately. The experimental results are
shown in Table 3. As can be seen from the table, CT was increasing with the increasing number of
edges, that is to say, the answering speed was decreasing. When the number of vertices in the
graph was kept the same and the number of edges was increasing, the average degree of vertices
was also increasing. Therefore, when searching the induced subgraph space in ascending order of
the number of vertices, more candidate subgraphs would be generated in each layer, and more
graphs would participate in the subgraph isomorphism testing; so the query time became longer,
and the answering speed decreased.
(2) Experiments on the increasing number of vertex labels
We investigated the influence of vertex labels on EQA process speed subsequently. Keep the sameAppl. Sci. 2018, 8, 1798 17 of 20
size of graphs and the same number of edge labels, then increase the number of vertex labels.
The graphs contained 3000 vertices and 8000 edges. The number of edge labels was set as five,
and the number of vertex labels was set as 10, 30, 50 and 70 separately. The experimental results
are shown in Table 4. As seen from the table, CT was decreasing with the increasing number of
vertex labels, that is to say, the answering speed was increasing. Since both the number of vertices
and the number of edges in each graph were the same, the number of candidate subgraphs
generated had little difference, as well as the number of candidate subgraphs participating in
the isomorphism testing. However, with the increasing number of vertex labels, there were
more unique induced subgraphs on the dataset and a higher probability to obtain MUIS earlier.
Therefore, CT was decreasing, and the answering speed was increasing.
(3) Experiments on the increasing number of edge labels
We investigated the influence of edge labels on EQA process speed at last. Keep the same size of
graphs and the same number of vertex labels, then increase the number of edge labels. All the
graphs contained 3000 vertices and 8000 edges. The number of vertex labels was set as five,
and the number of edge labels was set as 10, 30, 50 and 70 separately. The experimental results
are shown in Table 5. As seen from the table, CT was decreasing with the increasing number
of edge labels, that is to say, the answering speed was increasing. Since the size of each graph
was the same, the number of candidate subgraphs generated in each graph was also almost the
same, that is to say, the number of candidate subgraphs participating in the isomorphism testing
also had little difference. However, the number of unique induced subgraphs was increasing in
each graph with the increasing number of edge labels, so there was a higher probability to obtain
MUIS earlier. Therefore, CT was decreasing, and the answering speed was increasing.
Table 3. Experimental results on the increasing number of edges.
Dataset # Edge # Vertex Label # Edges Label # CT
#1 6000 5 5 566,534
#2 7000 5 5 616,321
#3 8000 5 5 685,132
#4 9000 5 5 763,026
Table 4. Experimental results on the increasing number of vertex labels.
Dataset # Edge # Vertex Label # Edges Label # CT
#1 8000 10 5 666,345
#2 8000 30 5 602,654
#3 8000 50 5 538,935
#4 8000 70 5 464,682
Table 5. Experimental results on the increasing number of edge labels.
Dataset # Edge # Vertex Label # Edges Label # CT
#1 8000 5 10 675,634
#2 8000 5 30 610,635
#3 8000 5 50 542,684
#4 8000 5 70 476,325
In a summary, the size and labels of graphs were the main influencing factors of the EQA process
speed. The answering speed was decreasing when the size of graphs was increasing, while the speed
was increasing when the the number of labels was increasing. EQA solved all MUIS queries on the
synthetic datasets, which shows its effectiveness and scalability.Appl. Sci. 2018, 8, 1798 18 of 20
6. Conclusions
In this paper, we report a novel type of interesting subgraph query: MUIS query. MUIS query is a
graph query technology with high academic value and widespread application prospects. We first
give the formal definition of MUIS and discuss the properties. Then, we propose the general
filtering-validation framework to solve MUIS query. In the filtering process, the BFS-based candidate
set generation strategy is proposed, which searches the induced subgraph space from the lower layer
to the higher layer and sets the query position self-constructed one-vertex subgraph as the first layer.
In addition, the matched vertices-based pruning strategy is proposed in this process to prune the
useless subgraph region, thereby significantly avoiding unnecessary computations. In the validation
process, query position-based subgraph isomorphism is proposed to check efficiently whether the
candidate subgraphs are unique. The EQA algorithm is devised to answer efficiently MUIS query
under the framework and strategies at last. Both synthetic and real datasets are used to test the
effectiveness and scalability of the EQA algorithm. The influencing factors of the EQA process speed
are also verified by the synthetic dataset experiments.
MUIS query can be used in many potential applications, such as subgraph retrieval,
graph visualization, representative subgraph discovery and vertex property exploration. The paper
mainly answers MUIS query in single (large) graphs. For graph databases that store more than one
graph, our solution may meet problems. We will try to answer MUIS query efficiently in graph
databases in future work.
Author Contributions: Conceptualization, L.J., X.Z. and B.G. Methodology, L.J. Software, L.J. Validation, S.H.
Formal analysis, L.J., X.Z. and B.G. Resources, W.X. Data curation, L.J. Writing, original draft preparation,
L.J., X.Z. and B.G. Writing, review and editing, S.H., H.S., Y.J. and W.X. Visualization, L.J. Supervision, W.X.
Project administration, B.G. Funding acquisition, S.H. and W.X.
Funding: This research was funded by (NSFC) grant number (No. 61872446), (No. 71690233) and (No. 71331008).
Acknowledgments: We are pleased to thank the Editor and the Referees for their useful suggestions. This work
was supported by the National Natural Science Foundation of China under Grant Nos. 61872446, 71690233 and
71331008.
Conflicts of Interest: The authors declare no conflict of interest.
References
1. Zaslavskiy, M.; Bach, F.; Vert, J.P. Global alignment of protein–protein interaction networks by graph
matching methods. Bioinformatics 2009, 25, 259–267. [CrossRef] [PubMed]
2. Liao, C.S.; Lu, K.; Baym, M.; Singh, R.; Berge, B. IsoRankN: Spectral methods for global alignment of multiple
protein networks. Bioinformatics 2009, 25, 253–258. [CrossRef] [PubMed]
3. Couennea, F.; Jalluta, C.; Maschkea, B.; Tayakouta, M.; Breedveldb, P. Bond graph for dynamic modelling in
chemical engineering. Chem. Eng. Process. 2008, 47, 1994–2003. [CrossRef]
4. Khakzad, N.; Landucci, G.; Reniers, G. Application of Graph Theory to Cost-Effective Fire Protection of
Chemical Plants During Domino Effects. Risk Anal. 2017, 37, 1652–1667. [CrossRef] [PubMed]
5. Faloutsos, M. Detecting malware with graph-based methods: Traffic classification, botnets, and facebook
scams. In Proceedings of the 22nd International Conference on World Wide Web, Rio De Janeiro, Brazil,
13–17 May 2013; pp. 495–496.
6. Khan, K.U.; Alam, A.; Dolgorsuren, B.; Uddin, M.A.; Umair, M.; Sang, U.; Duong, V.T.; Xu, W.;
Lee, Y.K. LPaMI: A Graph-Based Lifestyle Pattern Mining Application Using Personal Image Collections in
Smartphones. Appl. Sci. 2017, 7, 1200. [CrossRef]
7. Rezig, S.; Achour, Z.; Rezg, N.; Kammoun, M.A. Supervisory control based on minimal cuts and Petri net
sub-controllers coordination. Int. J. Syst. Sci. 2015, 1–11. [CrossRef]
8. Rezig, S.; Achour, Z.; Rezg, N. Control Synthesis Based on Theory of Regions with Minimal Reachability
Graph Knowledge. IFAC-Pap. Online 2016, 49, 1383–1388. [CrossRef]
9. Rezig, S.; Achour, Z.; Rezg, N. Theory of Regions for Control Synthesis without Computing Reachability
Graph. Appl. Sci. 2017, 7, 270. [CrossRef]Appl. Sci. 2018, 8, 1798 19 of 20
10. Fortin, S. The Graph Isomorphism Problem; Tech. Rep.; University of Alberta: Edmonton, AB, Canada, 1996.
11. Yuan, Y.; Wang, G.; Chen, L.; Wang, H. Efficient subgraph similarity search on large probabilistic graph
databases. In Proceedings of the VLDB Endowment, Istanbul, Turkey, 27–31 August 2012; pp. 800–811.
12. Cook, S.A. The Complexity of Theorem-proving. In Proceedings of the Third Annual ACM Symposium on
Theory of Computing, Shaker Heights, OH, USA, 3–5 May 1971; pp. 151–158.
13. Shamir, R.; Tsur, D. Faster subtree isomorphism. J. Algorithms 1999, 33, 267–280. [CrossRef]
14. Shasha, D.; Wang, J.; Giugn, R. Algorithmics and applications of tree and graph searching. In Proceedings
of the Twenty-First ACM SIGMOD-SIGACT-SIGART Symposium on Principles of Database Systems,
Madison, WI, USA, 3–5 June 2002; pp. 39–52.
15. Cordella, L.P.; Foggia, P.; Sansone, C.; Vento, M. A (sub)graph isomorphism algorithm for matching large
graphs. IEEE PAMI 2004, 26, 1367–1372. [CrossRef] [PubMed]
16. Shang, H.; Zhang, Y.; Lin, X.; Yu, J.X. Taming verification hardness: An efficient algorithm for
testing subgraph isomorphism. In Proceedings of the VLDB Endowment, Auckland, New Zealand,
23–28 August 2008; pp. 364–375.
17. Han, W.S.; Lee, J.; Lee, J.H. TurboISO: Towards ultrafast and robust subgraph isomorphism search in large
graph databases. In Proceedings of the 2013 ACM SIGMOD International Conference on Management of
Data, New York, NY, USA, 22–27 June 2013; pp. 337–348.
18. Zhao, X.; Xiao, C.; Lin, X.; Wang, W.; Ishikawa, Y. Efficient processing of graph similarity queries with edit
distance constraints. VLDB J. 2013, 22, 727–752. [CrossRef]
19. Zhao, X.; Xiao, C.; Lin, X.; Zhang, W.; Wang, Y. Efficient structure similarity searches: A partition-based
approach. VLDB J. 2018, 27, 53–78. [CrossRef]
20. Lin, W.; Xiao, X.; Ghinita, G. Large-scale frequent subgraph mining in mapreduce. In Proceedings of the IEEE
30th International Conference on Data Engineering, Chicago, IL, USA, 31 March–4 April 2014; pp. 844–855.
21. Horváth, T.; Otaki, K.; Ramon, J. Efficient frequent connected induced subgraph mining in graphs of
bounded tree-width. In Proceedings of the Joint European Conference on Machine Learning and Knowledge
Discovery in Databases, Prague, Czech Republic, 23–27 September 2013; pp. 622–637.
22. Qiao, F.; Zhang, X.; Li, P.; Ding, Z.; Jia, S.; Wang, H. A parallel approach for frequent subgraph mining in a
single large graph using spark. J. Appl. Sci. 2018, 8, 230. [CrossRef]
23. Inokuchi, A.; Washio, T.; Motoda, H. An apriori-based algorithm for mining frequent substructures from
graph data. In Proceedings of the Joint European Conference on Machine Learning and Knowledge Discovery
in Databases, Lyon, France, 13–16 September 2000; pp. 13–23.
24. Kuramochi, M.; Karypis, G. Frequent subgraph discovery. In Proceedings of the 2001 IEEE International
Conference on Data Mining, San Jose, CA, USA, 29 November–2 December 2001; pp. 313–320.
25. Yan, X.; Han, J. Gspan: Graph-based substructure pattern mining. In Proceedings of the 2002 IEEE
International Conference on Data Mining, Maebashi City, Japan, 9–12 December 2002; pp. 721–724.
26. Huan, J.; Wang, W.; Prins, J. Efficient Mining of Frequent Subgraphs in the Presence of Isomorphism. In Proceedings
of the 2003 IEEE International Conference on Data Mining, Melbourne, FL, USA, 19–22 November 2003.
27. Nijssen, S.; Kok, J.N. A quickstart in frequent structure mining can make a difference. In Proceedings of the
tenth ACM SIGKDD International Conference on Knowledge Discovery and Data Mining, Seattle, WA, USA,
22–25 August 2004; pp. 647–652.
28. Zou, L.; Chen, L.; Lu, Y. Top-K correlation sub-graph search in graph databases. In Proceedings of
the 14th International Conference on Database Systems for Advanced Applications, Brisbane, Australia,
21–23 April 2009; pp. 168–185.
29. Ke, Y.; Cheng, J.; Ng, W. Efficient correlation search from graph databases. IEEE Trans. Knowl. Data Eng.
2008, 20, 1601–1615.
30. Ke, Y.; Cheng, J.; Ng, W. Correlation search in graph databases. In Proceedings of the 13th ACM SIGKDD
International Conference on Knowledge Discovery and Data Mining, San Jose, CA, USA, 12–15 August 2007;
pp. 390–399.
31. Ke, Y.; Cheng, J.; Yu, J.X. Efficient discovery of frequent correlated subgraph pairs. In Proceedings of the
Ninth IEEE International Conference on Data Mining, Miami, FL, USA, 6–9 December 2009; pp. 239–248.
32. Ronen, M.; Rosenberg, R.; Shraiman, B.I.; Alon, U. Assigning numbers to the arrows: Parameterizing a gene
regulation network by using accurate expression kinetics. Proc. Natl. Acad. Sci. USA 2002, 99, 10555–10560.
[CrossRef] [PubMed]You can also read