Bat Evaluation Monitoring Studies at the Fowler Ridge Wind Farm Benton County, Indiana - US Fish and Wildlife Service
←
→
Page content transcription
If your browser does not render page correctly, please read the page content below
Bat Evaluation Monitoring Studies at the
 Fowler Ridge Wind Farm
 Benton County, Indiana

 DRAFT Report
 May 4 – October 15, 2020

 Prepared for:
 Fowler Ridge Wind Farm

 Prepared by:
 Rhett E. Good, Kristen Nasman, and Anna Ciecka
 Western EcoSystems Technology, Inc.
 408 West 6th Street
 Bloomington, Indiana 47404

 April 27, 2021
Fowler Ridge 2020 Bat Evaluation Monitoring Study Results

EXECUTIVE SUMMARY

The Fowler Ridge Wind Farm (FRWF) collectively includes Fowler Ridge Wind Farm LLC, Fowler
Ridge II Wind Farm LLC, Fowler Ridge III Wind Farm LLC, and Fowler Ridge IV Wind Farm LLC.
The FRWF consists of 420 wind turbines in four phases in Benton County, Indiana. Western
EcoSystems Technology, Inc. conducted post-construction fatality studies of bats within Phases I,
II, and III in the fall of 2009 and 2010, when two Indiana bat carcasses were found. The FRWF
worked with the US Fish and Wildlife Service and developed a Habitat Conservation Plan (HCP)
for the Indiana bat, designed to minimize Indiana bat fatalities during the fall migration period. The
FRWF received an Incidental Take Permit (ITP) for Indiana bats in August 2014.

Monitoring the effectiveness of minimization measures is required by both the HCP and the ITP.
Evaluation phase monitoring was conducted in Phases I, II, and III during the fall of 2014
and 2015. The estimated Indiana bat fatality rate was below adaptive management thresholds in
both years, so less intensive implementation phase monitoring began in 2016 for Phases I, II, and
III, and will continue unless adaptive management thresholds are exceeded in the future.
Evaluation phase monitoring was completed during the fall of 2016 and 2017 for Phase IV. The
estimated Indiana bat fatality rate was below adaptive management thresholds in both years for
this phase, so implementation phase monitoring began in the fall of 2018 and will continue unless
adaptive management thresholds are exceeded in the future.

Indiana bats were not believed to be at risk during the spring migration period when the original
HCP was prepared and the ITP was issued. In 2018, the HCP was amended to account for spring
take of Indiana bats due to evidence indicating a risk of Indiana bat take during the spring
migration period. An ITP amendment was granted, and two years of evaluation phase monitoring
were conducted during the spring of 2018 and 2019 at all phases of the FRWF. Estimated Indiana
bat fatality rates were below adaptive management thresholds in both years, so implementation
phase monitoring for all phases began in the spring of 2020 and will continue unless adaptive
management thresholds are exceeded in the future.

Standardized carcass searches were completed weekly at 114 turbines during the spring (May 4
– May 15) and twice weekly during the fall (August 1 – October 15), corresponding with migration
periods of Indiana bats. Stay-at-home orders for Indiana residents due to COVID-19 prevented
monitoring from April 1 – May 3. Turbines were searched twice weekly during the fall of 2020
because the average length of persistence for bat carcasses in the fall of 2019 was 4.14 days.
The search area was restricted to the gravel roads and pads within 80 meters (262 feet) of each
turbine included in the study in both seasons. Searcher efficiency and carcass persistence trials
were also conducted during both seasons to adjust for detection and removal bias.

No Indiana bat or other Myotis species were found. There were 124 bat carcasses of five known
species and one identified to the genus Lasiurus, and 18 bird carcasses of 14 known species
found during searches and incidentally. Similar to previous years of monitoring, the most

WEST i April 2021
Fowler Ridge 2020 Bat Evaluation Monitoring Study Results

commonly found bat species were eastern red bats and silver-haired bats, followed by hoary bats.
Four Seminole bats and four big brown bats were also found.

Estimated bat fatality rates were calculated based on the number of carcasses found, the results
of bias trials, and adjustments for bats that did not fall on roads and pads. The fatality estimate
was adjusted upward for the spring period when COVID-19 prevented surveys. The combined
spring and fall bat fatality rate in 2020 was estimated to be 14.32 bat fatalities/turbine/study period
(90% confidence interval: 11.09–18.41). The results of monitoring during 2020 provide evidence
that operational strategies exceeded the objective of reducing bat fatality rates by 50%, compared
to fatality estimates from turbines operating normally in 2010 and 2011. Within-season and end-
of-season adjustments of minimization strategies were not required in 2020 because bat fatality
rates were below adaptive management thresholds.

WEST ii April 2021
Fowler Ridge 2020 Bat Evaluation Monitoring Study Results

 STUDY PARTICIPANTS

 Rhett Good Project Manager
 Anna Ciecka Field Supervisor and Report Compiler
 Kristen Nasman Statistician
 Kristen Klaphake GIS Technician
 Jolie Blevins Project Tracking and Data Manager
 Julia Preston-Fulton Technical Editor
 Wes Conway Permitted Bat Biologist
 Hannah Yoquelet Field Technician
 Lucas Voorhees Field Technician
 Jessica Outcalt Field Technician

 REPORT REFERENCE

Good. R. E., K. Nasman, and A. Ciecka. 2021. Bat Evaluation Monitoring Studies at the Fowler Ridge Wind
 Farm, Benton County, Indiana: April 1 – October 15, 2020. Prepared for Fowler Ridge Wind Farm,
 Benton County, Indiana. DRAFT Report. May 4 – October 15, 2020. Prepared for Fowler Ridge
 Wind Farm. Prepared by Western EcoSystems Technology, Inc. (WEST), Bloomington, Indiana.
 April 27, 2021.

WEST iii April 2021
Fowler Ridge 2020 Bat Evaluation Monitoring Study Results

 TABLE OF CONTENTS

EXECUTIVE SUMMARY ............................................................................................................... i
INTRODUCTION .......................................................................................................................... 1
STUDY AREA ............................................................................................................................... 2
METHODS .................................................................................................................................... 4
 Standardized Carcass Searches .............................................................................................. 4
 Turbine Operation Schedule ..................................................................................................... 5
 Bias Trials ................................................................................................................................. 6
 Searcher Efficiency Trials ..................................................................................................... 6
 Carcass Persistence Trials ................................................................................................... 6
 Quality Assurance and Quality Control ..................................................................................... 7
 Statistical Analysis .................................................................................................................... 7
 Bat Fatality Rate Estimation .................................................................................................. 7
 Carcass Persistence Rates ................................................................................................... 8
RESULTS ..................................................................................................................................... 9
 Bat and Bird Carcass Surveys .................................................................................................. 9
 Species Composition ............................................................................................................ 9
 Estimated Time since Death ............................................................................................... 11
 Timing of Bat Carcasses ..................................................................................................... 11
 Distribution of Bat Carcasses .............................................................................................. 13
 Bat Carcasses by Turbine Type .......................................................................................... 14
 Bias Trials ............................................................................................................................... 14
 Searcher Efficiency Trials ................................................................................................... 14
 Carcass Persistence Trials ................................................................................................. 16
 Estimated Fatality Rates ......................................................................................................... 16
 End-of-year Adaptive Management Threshold ................................................................... 19
 Within-season Adaptive Management ................................................................................ 19
 End-of-season Indiana Bat Take Estimate .......................................................................... 24
REFERENCES ........................................................................................................................... 24

WEST iv April 2021
Fowler Ridge 2020 Bat Evaluation Monitoring Study Results

 LIST OF TABLES

Table 1. Turbine characteristics at the Fowler Ridge Wind Farm, Benton County, Indiana.......... 2
Table 2. Land cover types, coverage, and percent composition within 0.5 mile of turbine
 locations within the Fowler Ridge Wind Farm, Benton County, Indiana............................ 4
Table 3. Total number and percent composition of bat carcasses found at the Fowler Ridge
 Wind Farm from May 4 – May 15 and August 1 – October 15, 2020.Error! Bookmark
 not defined.
Table 4. Total number and percent composition of bird carcasses found at the Fowler Ridge
 Wind Farm from May 4 – May 15 and August 1 – October 15, 2020. ............................. 11
Table 5. Estimated time since death of bat carcasses found on search plots and estimated to
 have been killed at the Fowler Ridge Wind Farm from May 4 – May 15 and August 1
 – October 15, 2020. ........................................................................................................ 11
Table 6. Distribution of distances from turbines of bat carcasses found on search plots during
 scheduled searches at the Fowler Ridge Wind Farm from May 4 – May 15 and August
 1 – October 15, 2020, that were included in fatality estimates. ....................................... 13
Table 7. Total number of carcasses found and unadjusted fatality rate by turbine type and
 season at the Fowler Ridge Wind Farm from May 4 – May 15 and August 1 – October
 15, 2020. ......................................................................................................................... 14
Table 8. Searcher efficiency based on empirical pi methodology for post-construction fatality
 monitoring at the Fowler Ridge Wind Farm from May 4 – May 15 and August 1 –
 October 15, 2020. ........................................................................................................... 15
Table 9. Carcass persistence rates reported at the Fowler Ridge Wind Farm from April 1 –
 May 15 (Spring) and August 1 – October 15 (Fall) from 2010 – 2020. ........................... 16
Table 10. Number of bat fatalities per turbine per study period for the Fowler Ridge Wind
 Farm from April 1 – May 15, 2020. An adjustment of 0.29 was applied to account for
 the shorter study period. ................................................................................................. 17
Table 11. Number of bat fatalities per turbine per study period for the Fowler Ridge Wind
 Farm from August 1 – October 15, 2020. ........................................................................ 17
Table 12. Adjusted bat fatality estimates (empirical pi) for different turbine types within the
 Fowler Ridge Wind Farm from April 1 – May 15, 2020. 1 ................................................ 18
Table 13. Adjusted bat fatality estimates (empirical pi) for different turbine types within the
 Fowler Ridge Wind Farm from August 1 – October 15, 2020. 1 ...................................... 19
Table 14a. Variables used to calculate the within-season adaptive management threshold for
 420 operational turbines in spring 2020 (Phases I, II, III, and IV). .................................. 22
Table 14b. Variables used to calculate the within-season adaptive management threshold for
 420 operational turbines in fall 2020 (Phases I, II, III, and IV). ....................................... 23
Table 15. The estimated number of Indiana bat fatalities compared to the number of predicted
 Indiana bat fatalities at the Fowler Ridge Wind Farm while operating under Incidental
 Take Permit TE95012A-0. ............................................................................................... 24

WEST v April 2021
Fowler Ridge 2020 Bat Evaluation Monitoring Study Results

 LIST OF FIGURES

Figure 1. Land cover types and locations of Phase I–IV turbines searched from May 4 – May
 15 and August 1 – October 15, 2020, at the Fowler Ridge Wind Farm, Benton County,
 Indiana. ............................................................................................................................. 3
Figure 2. Timing of eastern red bat carcasses found on search plots during scheduled
 searches at the Fowler Ridge Wind Farm from May 4 – May 15 and August 1 –
 October 15, 2020, that were included in fatality estimates. ............................................. 12
Figure 3. Timing of silver-haired bat carcasses found on search plots during scheduled
 searches at the Fowler Ridge Wind Farm from May 4 – May 15 and August 1 –
 October 15, 2020, that were included in fatality estimates. ............................................. 12
Figure 4. Timing of hoary bat carcasses found on search plots during scheduled searches at
 the Fowler Ridge Wind Farm from May 4 – May 15 and August 1 – October 15, 2020,
 that were included in fatality estimates. .......................................................................... 13
Figure 5. Distribution of distances from turbines of bat carcasses found on search plots during
 scheduled searches at the Fowler Ridge Wind Farm from May 4 – May 15 and
 August 1 – October 15, 2020, that were included in fatality estimates............................ 14
Figure 6. A comparison of estimated bat fatality rates and 90% confidence intervals (CIs) for
 the Fowler Ridge Wind Farm. ......................................................................................... 20
Figure 7. Weekly per-turbine fatality rates (number of bat carcasses found per turbine) at the
 Fowler Ridge Wind Farm in 2020. This graph was used to determine if weekly fatality
 rates were approaching the 50% adaptive management threshold. Fatality rates for
 2020 shown above were based on 2019 bias trial results. ............................................. 21

 LIST OF APPENDICES

Appendix A. Estimated Time of Death Information Sheet for Fowler Ridge Wind Farm Benton
 County, Indiana
Appendix B. Bat and Bird Casualties Found at the Fowler Ridge Wind Farm, Benton County,
 Indiana, between May 4 – May 15 and August 1 – October 15, 2020
Appendix C. Representative Photos of Carcass Removal Events Recorded at Fowler Ridge
 Wind Farm, Benton County, Indiana, between September 14 – 23, 2020

WEST vi April 2021
Fowler Ridge 2020 Bat Evaluation Monitoring Study Results

INTRODUCTION

The Fowler Ridge Wind Farm (FRWF) collectively includes Fowler Ridge Wind Farm LLC, Fowler
Ridge II Wind Farm LLC, Fowler Ridge III Wind Farm LLC, and Fowler Ridge IV Wind Farm LLC.
The FRWF consists of 420 wind turbines in four phases in Benton County, Indiana. A post-
construction fatality study of bats was conducted by Western EcoSystems Technology, Inc.
(WEST) within Phases I, II, and III in 2009 (Johnson et al. 2010a, 2010b), when an Indiana bat
(Myotis sodalis) carcass was found. Subsequent studies were conducted in 2010, 2011, 2012
and 2013 (Good et al. 2011, 2012, 2013, and 2014) under Scientific Research and Recovery
Permits (TE15075A in 2010, TE15075A-2 in 2011, and TE73598A-0 in 2012 and 2013) within
Phases I, II, and III. A second Indiana bat carcass was found in 2010 (Good et al. 2011). The
results of this research FRWF used to design a strategy for reducing Indiana bat fatality rates.

The FRWF worked with the US Fish and Wildlife Service (USFWS) and developed a Habitat
Conservation Plan (HCP) for the Indiana bat designed to minimize Indiana bat fatalities by
feathering turbine blades when winds are at 5.0 meters per second (m/s; 16.4 feet per second
[ft/s]) or lower, on a nightly basis from sunset to sunrise during the fall migration period from
August 1 – October 15. The FRWF received an Incidental Take Permit (ITP) for Indiana bats in
August 2014 (TE95012A-0) based on the HCP. The HCP and ITP include requirements for
monitoring the effectiveness of minimization measures.

The first two years of evaluation phase monitoring were completed at Phases I, II, and III during
the fall migration season for Indiana bats in 2014 (Good et al. 2015) and 2015 (Good et al. 2016).
Construction of Phase IV was completed in December 2015, and the required two years of
evaluation phase monitoring were conducted during the fall migration season for Indiana bats
in 2016 (Good et al. 2017) and 2017 (Good et al. 2018). Because the estimated Indiana bat fatality
rate was estimated to be below adaptive management thresholds for all phases during their
respective evaluation years, as outlined in the HCP, implementation phase monitoring began in
the fall of 2016 at Phases I, II, and III, and in the fall of 2018 at Phase IV, and will continue unless
adaptive management thresholds are exceeded in the future (Good et al. 2018, 2019, 2020).

Indiana bats were not believed to be at risk during the spring migration period (April 1 – May 15)
when the original HCP was prepared and the ITP was issued. Since that time, new evidence
indicates Indiana bats may be at risk of take during the spring migration period as well (Pruitt and
Reed 2018). The HCP was amended to account for spring take of Indiana bats and an amendment
to the ITP was granted on March 22, 2018 (TE95012A-1). To minimize Indiana bat take during
the spring migration period, turbine blades are feathered below a cut-in speed of 3.5 m/s (11.5 ft/s)
on a nightly basis from sunset to sunrise from April 1 – May 15. As per the amended HCP and
ITP, two years of spring evaluation phase monitoring were conducted in 2018 (Good et al. 2019)
and 2019 (Good et al. 2020) at the FRWF. Because the estimated Indiana bat fatality rate was
estimated to be below adaptive management thresholds during the spring of 2018 and 2019,
implementation phase monitoring began in 2020 and will continue unless adaptive management
thresholds are exceeded in the future.

WEST 1 April 2021
Fowler Ridge 2020 Bat Evaluation Monitoring Study Results

Prior to the start of the spring 2020 fatality monitoring season, the Health, Safety, Security and
Environment Advisor for BP informed WEST that monitoring would be delayed while a stay-at-
home order was in place in Indiana (N. Allred, BP, pers. comm., March 25, 2020). The stay-at-
home restrictions were eased by the governor of Indiana as of May 1, 2020, and an abbreviated
spring monitoring season began on May 4, 2020. This report describes the results of the 2020
spring and fall fatality monitoring required under the HCP and ITP.

STUDY AREA

The FRWF has a total energy capacity of 750 megawatts (MW). Phase I consists of 122, Vestas
V82 1.65-MW turbines and 40, Clipper C96 2.50-MW turbines with a combined 301 MW of energy
capacity. Phase II consists of 133, 1.50-MW General Electric (GE) SLE turbines with a capacity
of 199.5 MW. Phase III consists of 60, Vestas V82 1.65-MW turbines with a total 99 MW of
capacity. Phase IV consists of 65, Siemens SWT-2.3-108 2.30-MW turbines with a capacity of
150 MW. Turbine characteristics are listed in Table 1.

 Table 1. Turbine characteristics at the Fowler Ridge Wind Farm, Benton County, Indiana.
 Turbine Height Rotor Diameter Standard cut-in speed
 Turbine Model Megawatt (meters) (meters) (meters/second)
 General Electric SLE 1.50 80 77 3.5
 Vestas V82 1.65 80 82 3.5
 Siemens SWT-2.3-108 2.30 80 108 3.5
 Clipper C96 2.50 80 96 3.5

Phases I and III were constructed in 2008 and became operational during January 2009. Phase II
was constructed in 2009 and became operational by December 31, 2009. Phase IV was
constructed in 2015 and became operational in December 2015.

The FRWF is dominated by cultivated crops, consisting primarily of corn (Zea mays) and
soybeans (Glycine max; Figure 1). Within 0.8 kilometers (0.5 mile) of turbine locations, cultivated
crops compose 92.5% of the land use in the 67,894-acre (27,476-hectare) study area (Table 2).
After cultivated crops, the next most common land uses within the FRWF are developed areas
(e.g., houses, buildings, and open space), which compose 5.3% of the total, and
pastures/hayfields, which compose 1.5% of the total area. Forested areas, grasslands
(herbaceous), and wetlands are rare within the study area (National Land Cover Database 2016).

WEST 2 April 2021
Fowler Ridge 2020 Bat Evaluation Monitoring Study Results

 Figure 1. Land cover types and locations of Phase I–IV turbines searched from May 4 – May 15 and August 1 –
 October 15, 2020, at the Fowler Ridge Wind Farm, Benton County, Indiana.

WEST 3 April 2021
Fowler Ridge 2020 Bat Evaluation Monitoring Study Results

 Table 2. Land cover types, coverage, and percent composition within 0.5 mile of turbine
 locations within the Fowler Ridge Wind Farm, Benton County, Indiana.
 Land Cover Types Coverage (acres) Percent Composition
 Cultivated Crops 62,810.0 92.5
 Developed, Low Intensity 2,014.0 3.0
 Developed, Open Space 1,557.0 2.3
 Hay/Pasture 1,036.0 1.5
 Deciduous Forest 280.0 0.4
 Developed, Medium Intensity 95.0 0.1
 Open Water 37.0
Fowler Ridge 2020 Bat Evaluation Monitoring Study Results

All bat carcasses were recorded and collected. Bird carcasses were recorded, but left in the field.
Searches began after 0700 hours each morning and were completed before sunset.

The condition of each carcass found was recorded using the following categories:

 • Intact – a carcass that is complete, shows little to no decomposition, and no sign of being
 fed upon by a predator or scavenger
 • Scavenged – an entire carcass that shows signs of scavenging or is heavily infested by
 insects, or portion(s) of a carcass in one location (e.g., wings, skeletal remains)
 • Dismembered – an entire carcass, but found in more than one piece, where the pieces
 are separated by more than 5.0 m (16.4 ft)
 • Injured – a live bird or bat that is harmed, damaged, or impaired in some way
 • Feather Spot (for bird carcasses only) – 10 or more feathers (or two or more primary
 feathers) at one location indicating predation or scavenging

Data recorded for each carcass included date and time collected, turbine number, species, sex
and age when identifiable, carcass location as latitude and longitude, distance and azimuth from
turbine, condition (live, intact, scavenged, dismembered, feather spot), and any comments
regarding possible cause of death or scavenging. Digital photographs were taken of the carcass,
any visible injuries, and surrounding habitat. Time since death for all carcasses was also
estimated and recorded (e.g., last night, two to three days). Criteria used to determine time since
death are listed in Appendix A.

Bat carcasses were collected under the Special Purpose Salvage Permit 18-044 from the Indiana
Department of Natural Resources (IDNR) and the WEST and USFWS Native Endangered and
Threatened Species Recovery permit TE234121-9. Any carcass with the potential to be a state-
or federally listed endangered or threatened species was reported to the appropriate agency
within 48 hours. A permitted bat biologist verified the species identification of all bat carcasses,
which were delivered to the USFWS Bloomington Field Office at the end of the study, along with
any tissue and fur samples taken from each carcass. A copy of the identification tag for each bat
carcass was kept with the carcass and tissue samples at all times.

Carcasses found in non-search areas (e.g., near a turbine not selected for standardized carcass
searches or outside of the search boundary for a selected turbine) were recorded as incidental
discoveries, collected, and documented in a similar fashion as those found during standard
searches. In addition to carcasses, all injured bats and birds were recorded and treated as a
fatality for the purpose of the analyses, but left in place.

Turbine Operation Schedule

Turbine cut-in speeds were raised to 5.0 m/s at the FRWF from August 1 – October 15.
Operational parameters were set so that the rotation of the turbine blades below cut-in wind speed
was feathered. Increasing cut-in speed and feathering turbine blades below cut-in speed were

WEST 5 April 2021
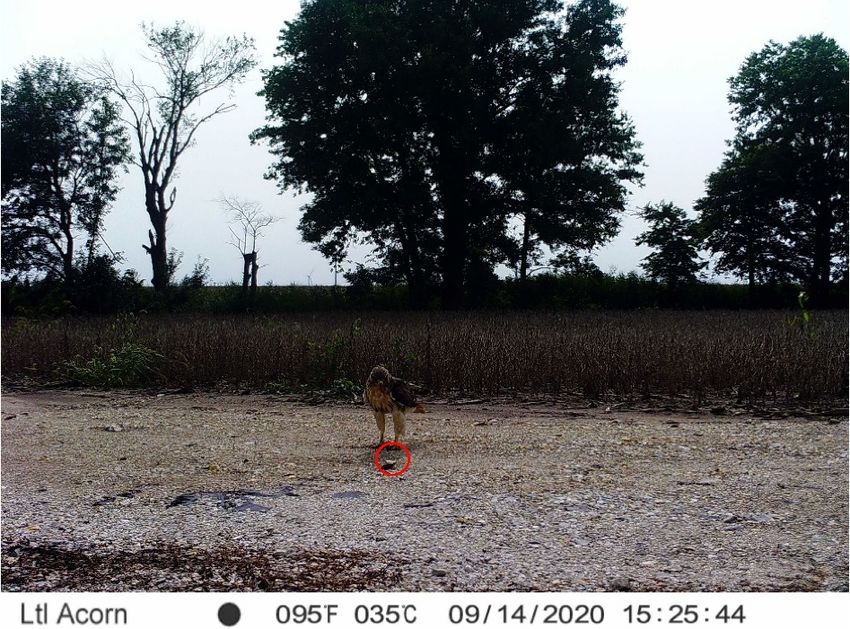
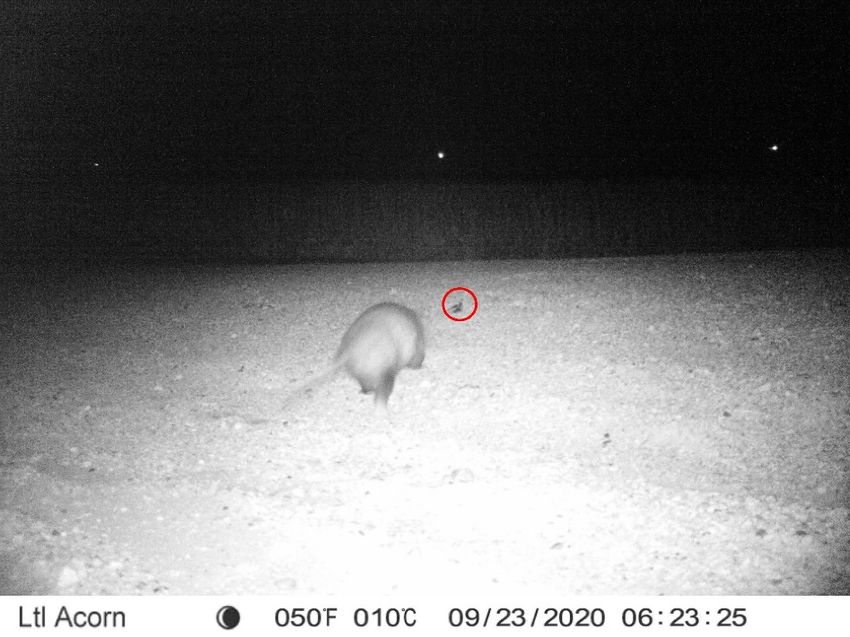
Fowler Ridge 2020 Bat Evaluation Monitoring Study Results

both implemented on a nightly basis from sunset to sunrise, and adjusted for sunset/sunrise times
weekly. Turbines were monitored and controlled based on wind speed on an individual basis (i.e.,
the entire facility did not alter cut-in speed at the same time; rather, operational changes were
based on wind speed conditions specific to each turbine). Turbines began operating under normal
conditions when the 5- to 10-minute rolling average wind speed was above 5.0 m/s; turbines were
feathered again if the 5- to 10-minute rolling average wind speed dropped below 5.0 m/s during
the course of the night. From April 1 – May 15, turbine cut-in speeds were not raised from the
manufacturer’s cut-in speed of 3.5 m/s, but turbine blades were feathered below manufacturer’s
cut-in speed.

Bias Trials

Searcher Efficiency Trials
The objective of the searcher efficiency trials was to estimate the percentage of carcasses
searchers found to account for detection bias in the bat fatality estimates. When possible, freshly
killed bats conclusively identified as non-Myotis or non-evening bat (Nycticeius humeralis) were
used for searcher efficiency and carcass persistence trials. Big brown bat (Eptesicus fuscus)
carcasses obtained from Indiana State University were used for bias trials when not enough fresh
carcasses were available, e.g. during the spring season.

Multiple searcher efficiency trials were conducted in each season. Across both seasons, 13 bats
were placed from zero to six days prior to searches in the spring, and 62 bats were placed from
zero to four days prior to searches in the fall to estimate the overall probability that a bat carcass
was available and detected (empirical pi). Searchers had multiple chances to find a trial carcass
on subsequent search days. The first day a searcher discovered a carcass was recorded to
estimate the overall probability that a carcass was available and detected. Bat carcasses were
placed throughout each study season by a technician not involved in the carcass search effort,
and were randomly placed within a turbine’s searchable area. Searchers had no knowledge of
the number, placement, or timing of carcasses placed at turbines. Data recorded for each trial
carcass included date of placement, species, turbine number, the distance and azimuth from the
turbine, and date the carcass was found. Carcasses were identified as bias trial carcasses
through the placement of a small, indistinct black zip tie on the bat’s forearm and were collected
when found.

Carcass Persistence Trials
The objective of carcass persistence trials was to estimate the average length of time (in days) a
carcass persisted in the field (i.e., before a carcass was no longer available for detection).
Carcasses could be removed by scavenging or rendered undetectable by typical farming or wind
farm maintenance activities. Carcass persistence trials were conducted when carcass searches
occurred.

Persistence trials were conducted during both spring and fall to incorporate the effects of varying
weather and scavenger densities. Thirty-five bat carcasses were monitored to estimate
persistence rates. Carcasses were checked on days 1, 2, 4, 6, 8, 10, 12, 18, and 24 after

WEST 6 April 2021
Fowler Ridge 2020 Bat Evaluation Monitoring Study Results

placement to calculate average carcass persistence rates. Day 1 was defined as the day after a
carcass was placed. The schedule varied slightly depending on weather and coordination with
other survey work. Trial carcasses were left at the placement location until they were removed by
scavenging or other means, completely decomposed, or the end of the carcass persistence trial,
whichever occurred first. Any evidence of carcasses that remained at the end of the 24-day period
was removed.

Trail cameras were used in conjunction with standard carcass persistence monitoring to
determine if more precise removal times could be achieved, as well as collect data on scavengers
that are most active at the FRWF (Rosa et al. 2019). Three infrared trail cameras, model LTL
Acorn 5210A, were positioned at three different turbine types to collect photos of scavenging
events (Clipper Turbine 639, GE Turbine 7, and Siemens Turbine S12). The trail cameras were
programmed to take a burst of three pictures at every trigger event, separated by five minutes to
reduce the risk of filling the memory card or depleting the batteries.

Quality Assurance and Quality Control

WEST implemented quality assurance and quality control (QA/QC) measures at all stages of the
study, including in the field, during data entry and analysis, and report writing. All WEST field staff
were trained in proper survey techniques and all data collected were recorded in a tablet,
electronically. Data were reviewed before they were submitted for data entry. If errors or
anomalies were found, follow-up measures were implemented including discussions and review
of field data with searchers and/or Project managers.

WEST data entry staff were trained on proper data entry procedures. System controls were
implemented to ensure correct data were entered; however, if any errors, omissions, or problems
were identified in later stages of analysis, they were traced back to the raw data where appropriate
changes and measures were implemented. Data were entered into a MS SQL database and were
QA/QC’d throughout the course of the study. Statisticians provided an extra level of QA/QC to
ensure proper protocols were followed and data collected were congruent with the objectives of
the study.

Statistical Analysis

Bat Fatality Rate Estimation
Fatality estimates for bats were calculated based on:
 • Observed number of bat carcasses found in search areas estimated to have been killed
 during the monitoring period
 • Persistence rates combined with searcher efficiency, expressed as the estimated average
 probability a bat carcass is expected to be available for detection and was detected by the
 searchers during combined bias trials
 • The search area adjustment factor for bat carcasses landing outside of searched roads
 and pads

WEST 7 April 2021
Fowler Ridge 2020 Bat Evaluation Monitoring Study Results

Carcasses found in a search area were included in the fatality analysis if the bat was estimated
to have perished during either monitoring period (i.e., on or after the evening of May 4 for spring
surveys and July 31 for fall surveys), regardless of whether they were found during a scheduled
search or incidentally at some other time. We assumed that all carcasses found incidentally in
search areas would have been found at the next search if they had not been found incidentally.
Carcasses found outside of search areas were not included in fatality estimates.

The probability of carcass availability and detection ( ) was calculated based on the results of
combined bias trials measuring searcher efficiency and carcass persistence. Trial carcasses were
placed in search areas throughout each monitoring period and left until they were either found by
searchers or removed by some other means, such as scavenging. The ratio of the number found
to the number placed was calculated for each number of days prior to the search the trial carcass
was placed. The average of the ratios was used as an empirical pi estimate of the probability of
availability and detection.

An adjustment factor (r) of 6.56 was used to adjust for carcasses estimated to occur outside of
searched roads and pads for Fowler Ridge I–III Wind Farms (Fowler I–III), to determine total
estimated bat fatality during the fall migration period. This area adjustment factor was an average
of the road and pad adjustment factors from 2011 and 2012 at Phases I, II, and III of the FRWF
(Good et al. 2011, 2012).

The road and pad area of each turbine at Phase IV was smaller compared to Phases I, II, and III,
and required a different adjustment factor in order to accurately estimate bat fatality rates. An
adjustment factor (r) of 26.38 was used to adjust for carcasses that likely occurred outside of
searched roads and pads for Fowler Ridge IV Wind Farm (Fowler IV) to determine the total
estimated bat fatality rate during the spring and fall migration period (Good et al. 2018).

The adjusted estimate for the number of fatalities per turbine was calculated as follows:

Due to the differences in MW ratings for each turbine type, bat fatality rates were calculated for
each type of turbine present, and a weighted average was used to calculate the facility wide bat
fatality rate (bats/turbine/study period and bats/MW/study period). The proportion of each turbine
type at the FRWF were used as weights for calculating the overall bat fatality rate for the FRWF.

Carcass Persistence Rates
Definition of Variables
The following variables were used to calculate carcass persistence rates:

s the number of carcasses used in persistence trials
sc the number of carcasses in persistence trials that remain in the study area after 24 days

WEST 8 April 2021
Fowler Ridge 2020 Bat Evaluation Monitoring Study Results

tj the time (in days) carcass j remains in the study area before it is removed, as determined
 by the persistence trials
 ̅ the average time (in days) a carcass remains in the study area before it is removed, as
 determined by the persistence trials
Mean carcass persistence time ( ̅) was calculated as the average length of time, in days, a
carcass remained in the study area before it was removed:

 ∑ =1
 ̅ =
 −

Between Years Comparisons
Percent change in fatality rates between 2020 (spring and fall combined) and the baseline years
(2010 and 2011) was calculated as the percent difference between estimates, and compared to
the anticipated 50% reduction in fatality rates due to applied minimization measures.

RESULTS

The following sections contain the results of studies conducted under ITP permit TE95012A-1.
Per the requirements of this permit, information regarding the date, locations, and species of bats
(and birds) encountered can be found in Appendix B.

Bat and Bird Carcass Surveys

There were 2,635 surveys conducted on roads and pads at 114 turbines from May 4 – May 15,
and from August 1 – October 15, 2020. Due to turbine maintenance or severe weather,
101 surveys (3.6%) were missed. Overall, 124 bat carcasses and 18 bird carcasses were found
during the survey (Table 3, Appendix B).

Species Composition
No Indiana bats or other Myotis species were found during the study. The most commonly found
bat species were eastern red bat (Lasiurus borealis; 63 carcasses; 51.8%), silver-haired bat
(Lasionycteris noctivagans; 39 carcasses; 31.4%), and hoary bat (Lasiurus cinereus;
12 carcasses; 9.7%). Four Seminole bat (L. seminolus) carcasses (3.2%) and four, big brown bat
carcasses were also found (3.2%; Table 3). One bat carcass was heavily scavenged and could
only be identified to the Lasiurus genus.

Eighteen bird carcasses found during the survey period represent 14 known bird species
(Table 4). No eagles or any bird species listed as threatened or endangered by IDNR (2019), or
the federal Endangered Species Act (1973) were found (USFWS 2019).

WEST 9 April 2021
Fowler Ridge 2020 Bat Evaluation Monitoring Study Results

 Table 3. Total number and percent composition of bat carcasses found at the Fowler Ridge Wind Farm from May 4 – May 15 and
 August 1 – October 15, 2020.
 Number with Percent
 Percent Estimated Composition Percent
 Number Composition Number Percent Time of with Estimated Number of Composition
 Included Included in Found Composition Death Time of Death All of All
 in Fatality Fatality Outside Found Outside Outside Study Carcasses Carcasses
 Species Estimate Estimate* Plot Outside Plot* Study Period Period* Found Found*
 eastern red bat 55 56.7 9 36.0 0 0 64 51.6
 silver-haired bat 26 26.8 12 48.0 1 50.0 39 31.4
 hoary bat 9 9.3 3 12.0 0 0 12 9.7
 Seminole bat 4 4.1 0 0 0 0 4 3.2
 big brown bat 3 3.1 1 4.0 0 0 4 3.2
 unidentified Lasiurus bat 0 0 0 0 1 50.0 1 0.8
 Totals 97 100 25 100 2 100 124 100
 * Totals may not add to 100% due to rounding.

WEST 10 April 2021
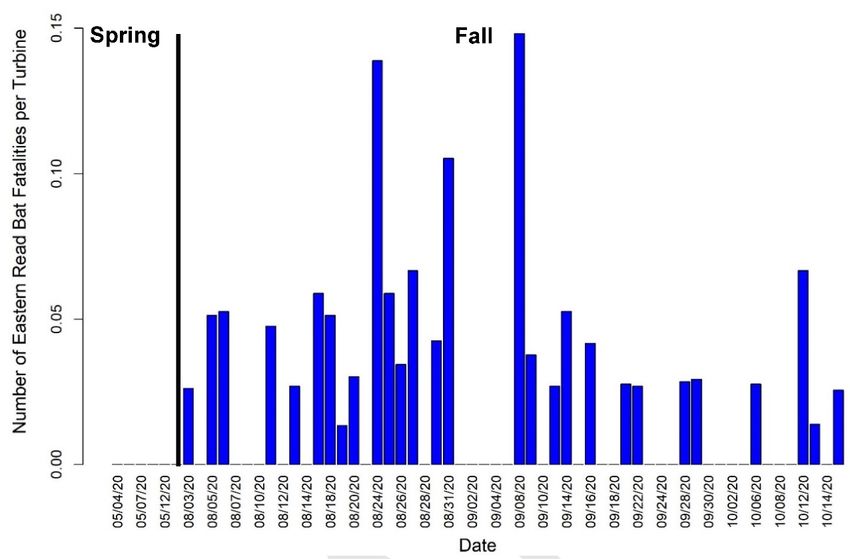
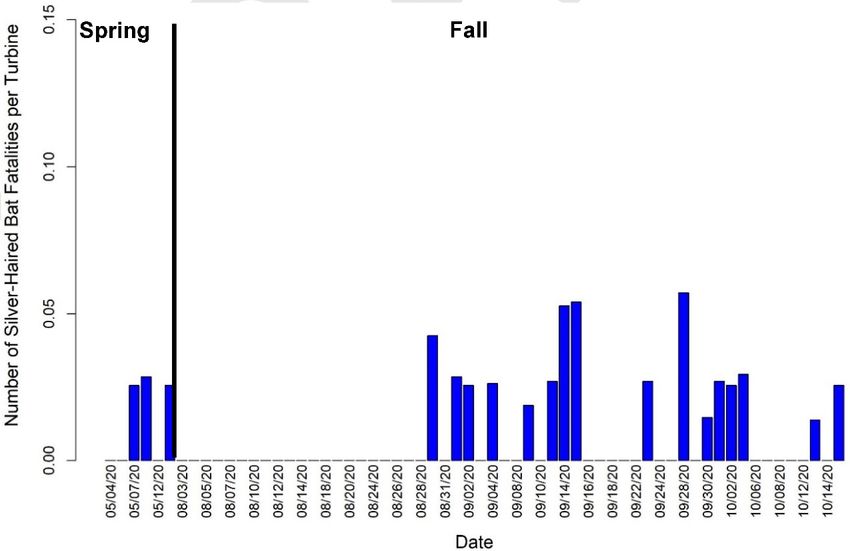
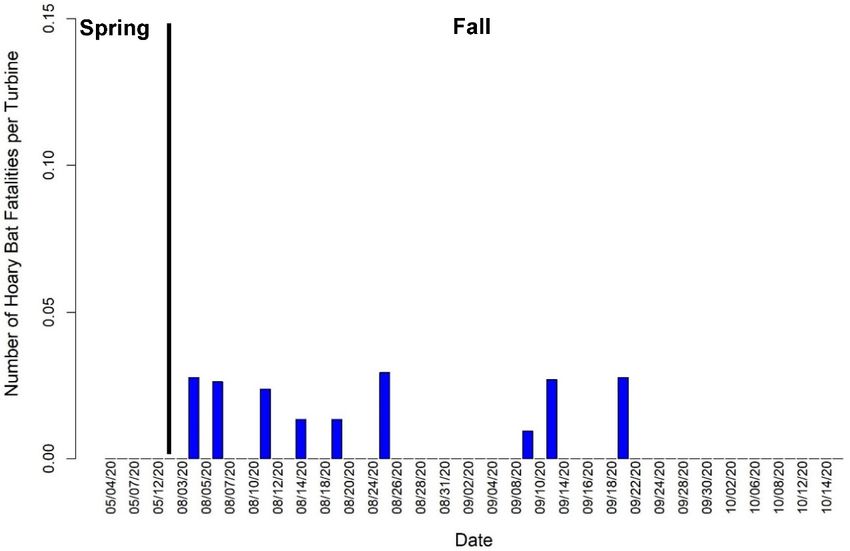
Fowler Ridge 2020 Bat Evaluation Monitoring Study Results

 Table 4. Total number and percent composition of bird carcasses found at
 the Fowler Ridge Wind Farm from May 4 – May 15 and August 1 –
 October 15, 2020.
 Species Number Percent Composition*
 mourning dove 4 22.2
 horned lark 2 11.1
 American redstart 1 5.6
 bay-breasted warbler 1 5.6
 black-and-white warbler 1 5.6
 blue jay 1 5.6
 European starling 1 5.6
 house sparrow 1 5.6
 killdeer 1 5.6
 red-breasted nuthatch 1 5.6
 red-eyed vireo 1 5.6
 rock pigeon 1 5.6
 ruby-throated hummingbird 1 5.6
 turkey vulture 1 5.6
 Totals 18 100
 * Totals may not add to 100% due to rounding.

Estimated Time since Death
The majority of bat carcasses found on search plots and included in the analyses had an
estimated time of death of less than a week (94 carcasses; 96.9%; Table 5) A little more than half
of the bat carcasses were estimated to have been killed the night before the search (57.7%), while
only one bat carcass (1.0%) had an estimated time of death beyond seven days (Table 5). Two
bats were found injured and were not collected, both were included in the fatality estimates.

 Table 5. Estimated time since death of bat carcasses found on search plots
 and estimated to have been killed at the Fowler Ridge Wind Farm
 from May 4 – May 15 and August 1 – October 15, 2020.
 Estimated Time Since Deatha Number of Carcasses Percent Composition
 Last night 56 57.7
 2–3 days 33 34.0
 4–7 days 5 5.2
 8–14 days 1 1.0
 Greater than 14 days 0 0
 Greater than 30 days 0 0
 Unknown 0 0
 Injured 2 2.1
 a: Estimated time since death criteria described in Appendix A.

Timing of Bat Carcasses
Eastern red bats fatalities in search areas were found throughout the fall season with peaks
occurring during the last week of August and the second week of September (Figure 2). Silver-
haired bats were the only bat species found in search areas in the spring, and they occurred
regularly throughout the fall, after the last week of August (Figure 3). Hoary bat fatalities were
consistently at low levels from early August through the middle of September (Figure 4).

WEST 11 April 2021
Fowler Ridge 2020 Bat Evaluation Monitoring Study Results

 Figure 2. Timing of eastern red bat carcasses found on search plots during scheduled
 searches at the Fowler Ridge Wind Farm from May 4 – May 15 and August 1 –
 October 15, 2020, that were included in fatality estimates.

 Figure 3. Timing of silver-haired bat carcasses found on search plots during scheduled
 searches at the Fowler Ridge Wind Farm from May 4 – May 15 and August 1 –
 October 15, 2020, that were included in fatality estimates.

WEST 12 April 2021
Fowler Ridge 2020 Bat Evaluation Monitoring Study Results

 Figure 4. Timing of hoary bat carcasses found on search plots during scheduled
 searches at the Fowler Ridge Wind Farm from May 4 – May 15 and August 1 –
 October 15, 2020, that were included in fatality estimates.

Distribution of Bat Carcasses
Almost 95% of bat carcasses were found within 50 m (164 ft) of turbines, with the highest
percentage (36.1%) of carcasses found between zero to 10 m (zero to 33 ft), followed by 20.6%
found between 10–20 m (33–66 ft; Table 6, Figure 5). This was a function of the amount of
searchable area present because roads and pads comprise a higher percentage of the area
closer to the turbines.

 Table 6. Distribution of distances from turbines of bat carcasses found on search plots
 during scheduled searches at the Fowler Ridge Wind Farm from May 4 – May 15
 and August 1 – October 15, 2020, that were included in fatality estimates.
 Distance from Turbine (meters) Number of Carcasses Percent Composition
 0 to 10 35 36.1
 10 to 20 20 20.6
 20 to 30 16 16.5
 30 to 40 13 13.4
 40 to 50 8 8.2
 50 to 60 2 2.1
 60 to 70 1 1.0
 70 to 80 2 2.1

WEST 13 April 2021
Fowler Ridge 2020 Bat Evaluation Monitoring Study Results

 Figure 5. Distribution of distances from turbines of bat carcasses found on search plots during
 scheduled searches at the Fowler Ridge Wind Farm from May 4 – May 15 and August 1
 – October 15, 2020, that were included in fatality estimates.

Bat Carcasses by Turbine Type
More carcasses were found during the fall compared to the abbreviated spring season (Table 7).
During the abbreviated spring monitoring season, the highest observed fatality rate occurred at
Clipper turbines (0.13 observed bat carcass per turbine) followed by Siemens turbines (0.05).
During the fall monitoring season, the highest observed fatality rate was also at Clipper turbines
(2.0) followed by Vestas turbines (0.92).

Table 7. Total number of carcasses found and unadjusted fatality rate by season at the Fowler
 Ridge Wind Farm from May 4 – May 15 and August 1 – October 15, 2020.
 Carcasses Found On Plot Number of Observed Fatalities
Season During Search or Incidentally Turbines Searched per Turbine
Spring 3 114 0.03
Fall 94 114 0.82

Bias Trials

Searcher Efficiency Trials
During the spring season, 10 of the 13 carcasses placed for bias trials were found at the first
scheduled search, with one additional bat found after multiple searches, resulting in an overall
probability of a carcass being available and detected of 81.3% (Table 8). The percent found for

WEST 14 April 2021
Fowler Ridge 2020 Bat Evaluation Monitoring Study Results

the season was calculated as an average across the number of days prior to search values.
During the fall season, 36 of 62 bias trial carcasses placed were found at the first scheduled
search, with two additional bats found after multiple searches, resulting in an overall probability
of a carcass being available and detected of 59.2% (Table 8).

 Table 8. Searcher efficiency based on empirical pi methodology for post-
 construction fatality monitoring at the Fowler Ridge Wind Farm from
 May 4 – May 15 and August 1 – October 15, 2020.
 Number of Days Number Number Found Total Percent
 Prior to Search* Placed on First Search Found Found
 Spring
 0 2 2 2 100
 1 2 2 2 100
 2 2 2 2 100
 3 2 1 2 100
 4 2 1 1 50.0
 5 1 1 1 100
 6 2 1 1 50.0
 Total 13 10 11 81.3
 Fall
 0 20 17 17 85.0
 1 8 4 4 50.0
 2 11 7 8 72.7
 3 15 4 5 33.3
 4 8 4 4 50.0
 Total 62 36 38 59.2
 * Number of days prior to search less in fall than spring due to twice-weekly searches.

WEST 15 April 2021
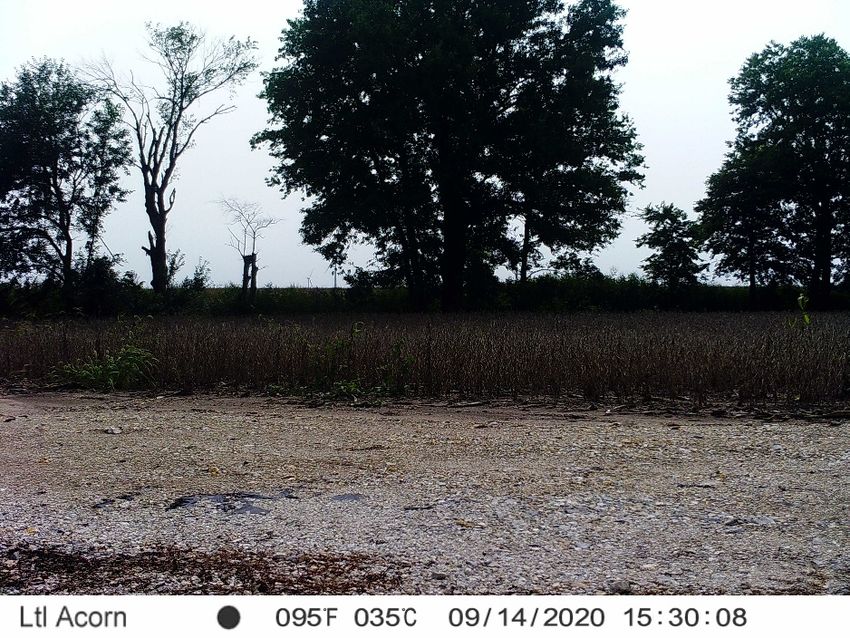
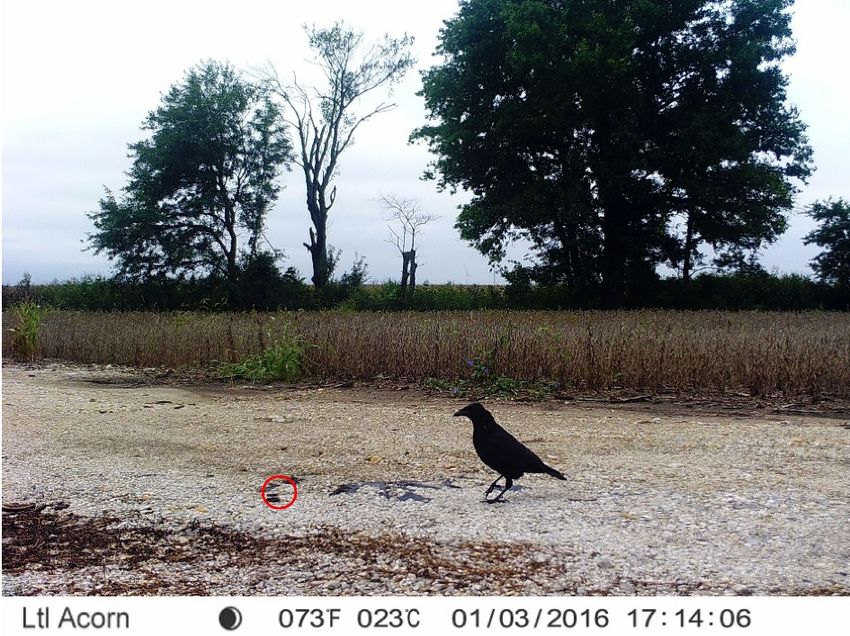
Fowler Ridge 2020 Bat Evaluation Monitoring Study Results

Carcass Persistence Trials
Thirty-five bats were used to measure carcass persistence rates, split between the spring and fall
seasons. The average length of persistence for bat carcasses in 2020 was 4.2 days in the spring
and 11.7 days in the fall. Carcass persistence in the spring of 2020 was lower than the spring of
2018 (13.4 days) and spring of 2019 (8.5 days). Fall persistence rates in 2020 were within the
range of rates recorded previously at FRWF. A summary of carcass persistence at FRWF over
the past 10 years shows year-to-year variation (Table 9).

 Table 9. Carcass persistence rates reported at the Fowler Ridge Wind Farm
 from April 1 – May 15 (Spring) and August 1 – October 15 (Fall)
 from 2010 – 2020.
 Year Spring (days) Fall (days)
 2010 – 10.3
 2011 – 15.1
 2012 – –
 2013 – 5.8
 2014 – 19.4
 2015 – 13.9
 2016 – 20.8
 2017 – 10.7
 2018 13.4 6.8
 2019 8.5 4.1
 2020 4.2 11.5

Three trail cameras recorded the timing of the removal of several bias trial carcasses during the
fall. Ten carcasses were placed and six scavenger removal events were recorded by the cameras.
A technician checked six of the placed carcasses as part of the regular carcass persistence trials.
The remaining four carcasses were placed after the removal of the original trial carcass at turbines
with cameras to increase the sample size. Virginia opossums (Didelphis virginiana) removed three
trial carcasses at Clipper Turbine 639, while the camera at GE Turbine 7 recorded trial carcass
removals by one each of raccoon (Procyon lotor), American crow (Corvus brachyrhynchos), and
red-tailed hawk (Buteo jamaicensis) (Appendix C). Two scavenging events were not detected by
the camera due to the distance between the camera and the carcass. The searcher recorded
these carcasses as missing when checked, but the removal was not detectable by the camera
because the carcasses were placed greater than five m from the camera. One trial carcass at
Siemens Turbine S12 was removed from camera view due to a bulldozer moving gravel, but the
technician confirmed the carcass was still present on the next check day. One carcass was never
removed, by any means, before the end of the trial period.

The results of the trial suggest that game cameras can be used to measure carcass persistence
at FRWF, if cameras are placed no farther than five m from the carcass. Use of game cameras
could provide a more cost effective and more precise method for measuring carcass persistence.

Estimated Fatality Rates

Three of seven bat carcasses found during the spring survey period were included in the analyses.
Three carcasses were excluded from the analysis because they were found outside the search

WEST 16 April 2021
Fowler Ridge 2020 Bat Evaluation Monitoring Study Results

area at a normally searched turbine, and one was excluded because it was estimated to have
perished before May 4. For the fall surveys, 94 bat carcasses were included in the analyses and
23 bat carcasses were excluded because they were incidental finds at non-searched turbines
(n=14), found outside the search area at a normally searched turbine (n=8), or were estimated to
have perished before July 31 (n=1; Appendix B).

An observed fatality rate of 0.03 bat per turbine was calculated for the spring (Table 10) and
0.82 bat per turbine in the fall (Table 11). The observed fatality rate was then divided by the
empirical probability of availability and detection (0.81 for spring and 0.59 for fall). This value was
multiplied by the road and pad area adjustment factor (6.56 for Fowler I–III, 26.38 for Fowler IV)
to obtain the per turbine adjusted fatality estimate for each type of turbine. An additional
adjustment was applied to the spring estimate to account for the shorter survey period. We
adjusted the spring estimate by assuming the two rounds of surveys we completed during the last
two weeks of spring (May 4 – May 15) were representative of the spring study period. Seven
rounds of surveys would have been conducted in the spring, one for each week. The fatality
estimate from May 4 – May 15 was adjusted upwards by 71% (we surveyed 29% of the spring
period) to account for the missed surveys.

Table 10. Number of bat fatalities per turbine per study period for the Fowler Ridge Wind Farm from
 April 1 – May 15, 2020. An adjustment of 0.29 was applied to account for the shorter study
 period.
 Point Standard 90% Confidence Interval
Estimator Estimate Deviation Lower Limit Upper Limit
 Fowler I–III 6.56 – – –
Area Adjustment
 Fowler IV 26.38 – – –
Observed fatalities per turbine* 0.03 – – –
Observed fatalities per turbine adjusted for missed
 0.11
spring surveys
Empirical pi 0.81 0.08 0.69 0.94
Estimated number of fatalities per turbine* 1.24 – – –
* Standard deviation and confidence intervals not calculated due to the small number of carcasses found.

Table 11. Number of bat fatalities per turbine per study period for the Fowler Ridge Wind Farm from
 August 1 – October 15, 2020.
 Point Standard 90% Confidence Interval
Estimator Estimate Deviation Lower Limit Upper Limit
 Fowler I–III 6.56 – – –
Area Adjustment
 Fowler IV 26.38 – – –
Observed fatalities per turbine 0.82 0.11 0.65 1.01
Empirical pi 0.59 0.05 0.52 0.67
Adjusted number of fatalities per turbine 13.09 2.05 9.99 16.87

The adjusted fatality estimate for the facility was weighted by the number of each turbine type
present in the FRWF. The adjusted fatality estimate for the spring was 1.24 bat
fatalities/turbine/study period, or 0.53 bat fatality/MW/study period (Table 12). The adjusted

WEST 17 April 2021
Fowler Ridge 2020 Bat Evaluation Monitoring Study Results

fatality estimate for the fall was 13.09 bat fatalities/turbine/study period or 6.87 bat
fatalities/MW/study period (Table 13).

The facility wide fatality rate was calculated using a weighted average across turbine type due to
differences in MW ratings for turbine types. Past studies at FRWF have suggested that bat fatality
rates may vary by MW ratings, how they operate, rotor swept area, or a combination of factors
(Good et al. 2012). The reasons for why fatality rates may vary between turbine types are unclear.
Previous research at FRWF, and the current monitoring study, were not designed to conclusively
determine if certain brands of turbines result in higher or lower mortality. Survey methodology
may explain the differences observed. For example, two different methods were used to calculate
area corrections at Phases I, II and III (which contain 3 turbine types), compared to the area
correction method used to estimate Phase IV mortality rates. All turbines operate under the same
basic principles, and it is inappropriate to conclude that certain turbine brands have higher or
lower mortality rates based on the results of monitoring at FRWF.

Table 12. Adjusted bat fatality estimates (empirical pi) for different turbine types within the Fowler
 Ridge Wind Farm from April 1 – May 15, 2020. 1
Turbine Type Mean 90% Confidence Interval2
Number of fatalities/turbine/year
Siemens 5.83 –
Vestas 0 –
GE 0 –
Clipper 3.53 –
All Turbines 1.24 –
Number of fatalities/megawatt/year3
Siemens 2.53 –
Vestas 0 –
GE 1.41 –
Clipper 1.41 –
All Turbines 0.53 –
1 Thisstudy was not designed to determine if bat fatality rates differ between turbine models, and this table should not
 be used to inform management actions or assessments at other wind-energy facilities.
2 Confidence intervals not calculated due to the small number of carcasses found.

3 Estimates are calculated by turbine type due to differences in MW ratings by turbine type

WEST 18 April 2021
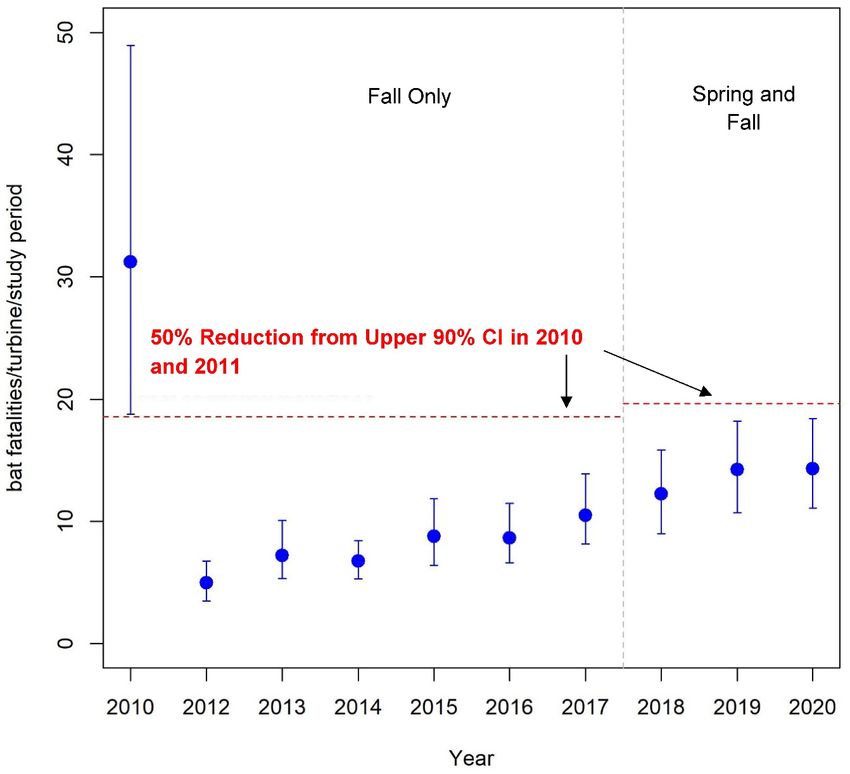
Fowler Ridge 2020 Bat Evaluation Monitoring Study Results

Table 13. Adjusted bat fatality estimates (empirical pi) for different turbine types within the Fowler
 Ridge Wind Farm from August 1 – October 15, 2020. 1
Turbine Type Mean 90% Confidence Interval
Number of fatalities/turbine/year
Siemens 28.55 18.34–39.15
Clipper 22.15 7.95–40.20
Vestas 10.22 6.86–14.44
GE 6.72 3.59–10.39
All Turbines 13.09 9.99–16.87
Number of fatalities/megawatt/year2
Siemens 12.41 7.97–17.02
Clipper 8.86 3.18–16.08
Vestas 6.20 4.16–8.75
GE 4.48 2.39–6.93
All Turbines 6.87 5.25–8.82
1 Thisstudy was not designed to determine if bat fatality rates differ between turbine models, and this table should
not be used to inform management actions or assessments at other wind-energy facilities.
2 Estimates are calculated by turbine type due to differences in MW ratings by turbine type

End-of-year Adaptive Management Threshold
The end-of-year adaptive management threshold, as described within the HCP, is 19.64 bat
fatalities/turbine/year, which is based on the upper 90% confidence interval (CI) of the average of
2010 and 2011 spring and fall bat mortality estimates, reduced by 50% (39.28 bat
fatalities/turbine/year ÷ 2). The 2020 fatality estimate with turbines feathered until wind speeds
reached 3.5 m/s in the spring and 5.0 m/s in the fall was 14.32 bat fatalities/turbine/study period
(90% CI 11.09–18.41), which was 27% lower than the end-of-year adaptive management
threshold, and 64% lower than the mean spring and fall fatality estimate from 2010 and 2011 with
turbines that operated at manufacturer cut-in speed. The end-of-year threshold for triggering
adaptive management was not met in 2020 (Figure 6).

Within-season Adaptive Management
The HCP includes an active adaptive management approach that facilitates responsiveness in
management actions based on results from annual take compliance monitoring to ensure permit
compliance. Within-season adaptive management thresholds were calculated to serve as an early
indicator if adjustments to minimization efforts were necessary before the conclusion of the
monitoring year. Per the HCP, within-season adaptive management thresholds were based on
the predicted number of bat carcasses that would be found that would equal the upper quartile
(i.e., 75th percentile) of estimated spring and fall bat mortality in 2010 and 2011 at control turbines
with minimization measures in place, which equals 11.8 Indiana bats per year for the entire facility.

The HCP prescribes a sampling approach utilizing roads and pads to calculate fatality estimates.
Per the HCP, to determine the number of bat carcasses of all species found that would equate to
the adaptive management threshold for within-season Indiana bat fatality, bias correction factors
from the previous year’s monitoring results were applied (Tables 14a and 14b). The within-season
adaptive management threshold for 2020 was 130 bat carcasses, spring and fall combined. There
were 97 bat carcasses found on search plots that were estimated to have been killed during the

WEST 19 April 2021
Fowler Ridge 2020 Bat Evaluation Monitoring Study Results

study’s two monitoring periods. Figure 7 illustrates the within-season tracking tool that was used
to determine if a fatality was approaching within-season adaptive management thresholds. The
weekly 2020 estimated bat fatality rate shown in Figure 7 was a prediction calculated using the
2019 bias trial data. The final 2020 bat fatality estimate was based on 2020 bias trial results.
Adaptive management thresholds were not exceeded at any time during the study, and no
changes to minimization efforts were required during 2020.

 Figure 6. A comparison of estimated bat fatality rates and 90% confidence intervals (CIs)
 for the Fowler Ridge Wind Farm.
 Note: The 2010 and 2011 combined spring and fall estimate represents turbines operating at manufacturer
 cut-in speeds. The 2012 – 2017 estimates represent data collected at turbines feathered below 5.0
 meters/second (m/s) in the fall only. The 2018 – 2020 estimates represent turbines feathered below
 5.0 m/s in the fall and 3.5 m/s in the spring. The red dotted line from 2010 – 2017 represents the
 end-of-year adaptive management thresholds, which is a 50% reduction of the upper 90% CI of bat
 fatality rates compared to the 2010 and 2011 combined fatality estimates.

WEST 20 April 2021
Fowler Ridge 2020 Bat Evaluation Monitoring Study Results

 Figure 7. Weekly per-turbine fatality rates (number of bat carcasses found per turbine) at the
 Fowler Ridge Wind Farm in 2020. This graph was used to determine if weekly fatality rates
 were approaching the 50% adaptive management threshold. Fatality rates for 2020 shown
 above were based on 2019 bias trial results.

WEST 21 April 2021
Fowler Ridge 2020 Bat Evaluation Monitoring Study Results

Table 14a. Variables used to calculate the within-season adaptive management threshold for 420 operational turbines in spring 2020
 (Phases I, II, III, and IV).
Parameter Fowler I–III Fowler IV Descriptions of Data Sources
Adaptive management threshold for Upper quartile (i.e., 75th percentile) of estimated spring bat mortality in 2010 and
 0.60
 Indiana bats 2011 at control turbines with minimization measures in place.
 Percentage based on total number of Indiana bats found during searches over
Percent of all Indiana bat fatalities 0.16
 total bats found, as described within the Habitat Conservation Plan.
Estimated upper quartile of total
 fatalities during the period for
 378 Calculated—0.60/0.0016
 which adaptive management
 thresholds are based
Number of turbines 355 65 Fowler Phases I, II, III, and IV.
Estimated upper quartile of all bat
 fatality rates per turbine during
 Estimated by dividing the bat mortality count (378) by the number of operational
 the period for which adaptive 0.90
 turbines (420).
 management thresholds are
 based
 Estimated probability of carcasses being available and detected based on
Empirical pi estimate 0.62 Fowler 2019 empirical bias trials from weekly road and pad searches; will be
 adjusted annually for subsequent years.
 Phases I, II, and III estimated based on number of bats found on road and pads of
 cleared plots in relation to the total number of bats found at cleared plots in
Road and pad correction factor 6.56 26.38 2010 and 2011. Phase IV based on road and pad area searched measured at
 Phase IV and modeled carcass density distribution based on carcass distance
 data collected at Fowler from 2012 – 2016 on roads and pads.
Predicted upper quartile of number of
 bats found per searched turbine Predicted based on estimated fatality rate per turbine (0.90), multiplied by
 during the period for which 0.02 0.01 empirical pi (0.62), divided by road and pad correction factor (6.56 or 26.38),
 adaptive management thresholds and divided by the seasonal adjustment factor (0.29).
 are based
 Predicted based on estimated number of bats found per turbine (0.02 or 0.01)
Total bats found in one spring season
 1.82 1.33 multiplied by the number of turbines searched (75 or 39). Calculated value
 based on turbines searched
 represents adaptive management threshold for 2020.
Total Bats Found Threshold 2.06 Sum of expected bat mortality from Phases I, II, III, and IV during the Spring

WEST 22 April 2021
You can also read