Determinants on COVID-19 Case Fatality Rates of Cities in China: A Logit-NB Hurdle Model Analysis - Research Square
←
→
Page content transcription
If your browser does not render page correctly, please read the page content below
Determinants on COVID-19 Case Fatality Rates of
Cities in China: A Logit-NB Hurdle Model Analysis
Hanchen Yu
Arizona State University
Xin Lao ( laoxin2017@cugb.edu.cn )
China University of Geosciences
Hengyu Gu
Peking University
Zhihao Zhao
China University of Geosciences
Honghao He
Peking University
Research Article
Keywords: COVID-19, Case Fatality Rate, Hurdle model
DOI: https://doi.org/10.21203/rs.3.rs-179394/v1
License: This work is licensed under a Creative Commons Attribution 4.0 International License.
Read Full License
Page 1/21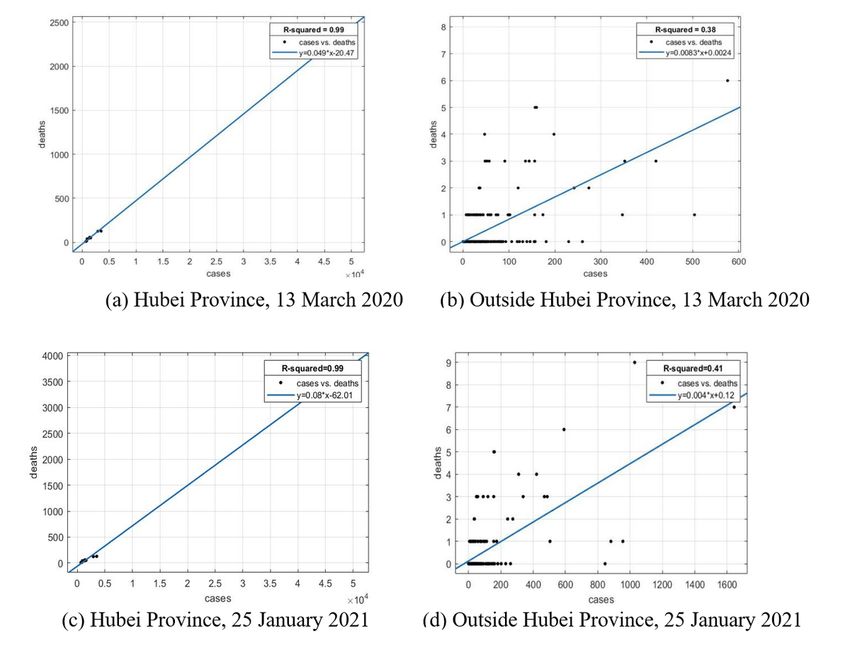
Abstract
Background: The ongoing Coronavirus Disease 2019 (COVID-19), a global pandemic with high
infectiousness and high mortality, has seriously threatened human health, life safety and caused
enormous economic losses. This study investigates the in uencing factors on the case fatality rate (CFR)
of COVID-19 at the city level in China.

Methods: A logistic-negative binomial (Logit-NB) hurdle model is employed to examine the determinants
on the probability of death and the value of CFR with COVID-19, based on con rmed cases and deaths by
13 March 2020 and 25 January 2021 at the city level in China and related environmental, demographic,
and socioeconomic data.

Results: We found that the probability of death from COVID-19 will increase by 1% with 1 newly increased
con rmed case and increase by 4% in response to a rise of 1 unit in the air quality index. CFR will feebly
increase with the number of con rmed cases, with the estimator being 2.81E-05. As the number of
doctors increases by 10,000, CFR will decrease by 0.18%. Each 1% increase in the humidity leads to a
0.02% decrease in CFR, and each 1-unit increase in the population density causes a 0.09% decline in CFR.
The comparison between the two research periods con rms the robustness of the results.

Conclusions: The number of con rmed cases and the air quality are closely associated with the death
probability, while the number of con rmed cases, the medical resources, the humidity, and the population
density signi cantly affect the CFR. Furthermore, the air quality and population density stand out in the
 rst wave of epidemic outbreak, while they become non-signi cant in the second wave.

Background
The ongoing coronavirus disease 2019 (COVID-19), as a rapidly spreading global pandemic, comes as a
big blow to the world's economic and social development and has become a global health concern. Case
fatality rate (CFR), known as the proportion of deaths from a kind of disease to the number of con rmed
cases of this disease (the proportion of infected people who die), is an important indicator to measure the
severity degree of the epidemic [1], as well as a re ection of the government capacity to prevent and
control the epidemic [2]. Outbreaking in Wuhan, China, in January 2020, the virus rapidly spread through
Hubei Province and the rest of China. It then became under control within 2 months, through stringent
prevention and control measures taken by Chinese governments, such as lockdown, wearing face masks,
self-quarantine, the detection and isolation of infected individuals, contact-tracing, social distancing,
tra c restrictions, and community containment [3]. The virus COVID-19, however, is now affecting
countries all over the world. As of 25 January 2021, 98,977,480 con rmed cases and 2,126,232 deaths
worldwide, covering 224 countries and regions. Therefore, it is quite necessary to investigate
determinants on COVID-19 CFRs of cities in China. China’s experience in controlling the spread of the
virus and reducing mortality can help inform other countries to better cope with the local epidemic
outbreaks.

                                                 Page 2/21
The fatality rate of COVID-19 is affected by multiple factors, including air pollution, climatic conditions,
demographic characteristics, socioeconomic factors, and the controlling measures. Many scholars focus
on the close association between air pollution and COVID-19 cases and mortality rates [4–10]. As an
essential environmental factor, climatic conditions also in uence the death rates of COVID-19 [11], mainly
measured by temperature and air humidity [12–14]. Demographic characteristics have remarkable effects
on the mortality of patients with COVID-19: age is the dominant factor; besides, gender, race, ethnicity,
medical history (such as comorbidity and obesity), and neighborhood characteristics also play a
signi cant role in determining the CFR [15–18]. The socioeconomic factors exert speci c impacts on the
COVID-19 spread, including income, unemployment, inequality, poverty, total population, population
density, human mobility, medical resources [17, 19–21]. Finally, the government actions (such as
containment measures, travel restrictions, and social distancing policies) prove to be effective in
mitigating the spread of the disease and reducing the con rmed cases and deaths [22–24].
Scholars employ traditional statistical methods (such as multivariate and panel regression) to reveal the
effects of demographic and clinical characteristics on the mortality of patients with COVID-19 [25–28]. At
the regional level, scholars use GIS-based spatial analysis methods and spatial regression models to
evaluate the impacts of environmental conditions, socioeconomic factors, demographic features (age,
sexual, racial, and ethnic structure) on the spatial distribution of COVID-19 cases and deaths, based on
the data of country level, state level, county level, or city level [16, 17, 20, 22, 29, 30].
The CFR of COVID-19 in China (4.79% on 25 January 2021)is more than double of the worldwide CFR
(2.15% on 25 January 2021). One of reasons why China's CFR is so high may be that people knew little
about the virus early in the epidemic. The studies on the determinants of China’s COVID-19 mortality
focus more on the individual level from patients' perspective in Wuhan of Hubei Province [28, 31–33].
There are relatively few studies at the city level in China, which mainly concern the impacts of air
pollution, climatic factors, and medical resources [34–36]. It is signi cant to analyze the in uence factors
at the city level, as Chinese city governments have played an important role in taking timely measures to
mitigate the spread of the epidemic. Besides environmental factors and medical factors, demographic
characteristics and socioeconomic factors also need to be considered. Since China has successfully
controlled the spread of the virus by 13 March 2020, the CFRs of COVID-19 in many cities outside Hubei
Province are zero, and the zero-in ated models will better t the data [37, 38]. This study employs a Logit-
NB hurdle model to examine the determinants on COVID-19 CFRs of cities in China and provides evidence
for responding to the public health crisis in the future. Speci cally, we will address the following
questions:
(1) Does the probability of death from COVID-19 and the CFR value belong to two different processes?
(2) If they are different processes, what are the respective determinants on them?
Methods
Page 3/21Data Collection
The data of COVID-19 cumulative con rmed cases and deaths are collected from the China National
Health Commissions (CNHC, http://www.nhc.gov.cn) and the provincial Health Commissions by 13
March 2020 and 25 January 2021. The dataset covered 280 prefecture-level cities that have public data
online. The case fatality rate (CFR -spring and CFR-2021) of COVID-19, as the dependent variable in this
study, is measured by the number of deaths per 100 con rmed COVID-19 cases by 13 March 2020 and 25
January 2021, respectively. The cumulative CFR on 13 March 2020 and 25 January 2021, respectively,
represents the rst and second waves of COVID-19 spread. In the rst wave of a massive disease
outbreak, Chinese governments have no experiences in dealing with this epidemic, and it takes 2 months
to control the spread of the virus; while in the second wave, Chinese governments have enough
experiences in prevention and control measures, contributing to the rapid containment of sporadic
outbreaks. The comparison of the con rmed cases and CFR between these 2 research periods can better
reveal the in uence factors on CFR in the whole process of responding to COVID-19 and the effect of
disease controlling experiences. When the pandemic is still ongoing, the current CFR will not re ect the
real situation because the infected people are likely to die in the future. Until 13 March 2020, however, the
rst wave of epidemic spread has been curbed in China, and the con rmed cases and deaths do not grow
considerably. Between 13 March 2020 and 25 January 2021, the con rmed cases with COVID-19 have
grown very slowly, not to mention the CFR. Therefore, the CFR is a reasonable indicator to measure the
developing state of the epidemic. The CFR by 13 March 2020 varies signi cantly from city to city, with 65
non-zero CFR and 215 zero CFR. By 25 January 2021, the number of cities with non-zero CFR has
increased to 68.
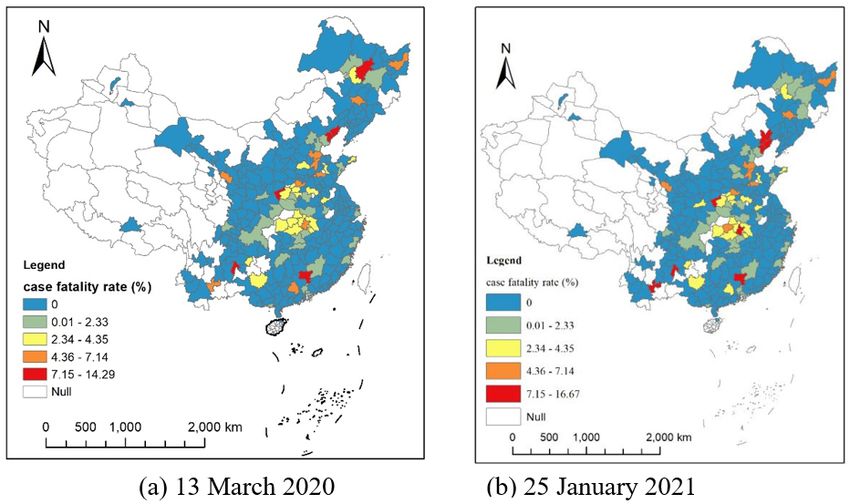
The spatial distribution of COVID-19 CFRs is shown in Fig. 1. As shown in Fig. 1a and Fig. 1b, the
distribution at both times is similar. There exists signi cant spatial autocorrelation in CFR. The highest
CFR values are mainly concentrated in Hubei Province cities, ranging from 2–7% on 13 March 2020. The
spatial distribution of CFR in cities outside Hubei Province is relatively random and uctuates
considerably, ranging from 0 to 15%, due to a greater uncertainty of statistical inference caused by a
smaller number of deaths. The con rmed cases in those cities are relatively smaller (even single digits),
easily leading to extremely high CFR values (as shown in several spots of red color in Fig. 1). COVID-19
cases versus deaths in Hubei Province and other provinces are shown in Fig. 2. The slope in Fig. 2
represents the average CFR. The average CFR in Hubei Province has increased from 4.9–8.0%, while it
decreased from 0.83–0.4% in other provinces. Cities in Hubei Province had much more cases and much
higher CFR than other cities. There exists a signi cant linear relationship between the number of
con rmed cases and death cases with a high value of R2 in Hubei Province (Fig. 2a), illustrating that the
CFR of each city in Hubei Province is consistent. The scatterplot of cities outside Hubei Province presents
a roughly linear relationship, whereas a great disturbance on CFR emerges, resulting from the death cases
ranging from 0 to 6.
Statistical analysis
Page 4/21Since the numbers of deaths in 215 out of 280 Chinese cities are zero in 2010, there exists an obvious
zero-in ation problem in the regression of the CFR. However, extant studies on the CFR often ignored the
zero-in ation problem, which led to statistical biases [37, 38]. There are two reasons for the zero-in ation
problem:
(1) The epidemic in China was under control. 84% of the cases occurred in Hubei Province until 13 March
2020. The average con rmed cases inside and outside Hubei Province were 5916.6 and 46.3,
respectively. In contrast, there were fewer cases distributed in other regions. The slope in Fig. 2b
represents the CFR, which is 0.83%. Hence, the average deaths in those cities were 46.3*0.83%=0.38. The
average number of deaths was less than 1, resulting in no deaths in most cities.
(2) Some cities did not have the medical conditions to receive critically ill patients. Many critically ill
patients were sent to surrounding cities with better medical resources.
A hurdle model is employed in this research to deal with the zero-in ation problem. It is a two-part model
that speci es one process for zero counts and another process for positive counts. The rst part we used
is a binary logistic model, which estimates the probability of attaining non-zero CFR predictors. The
second part we used is a truncated negative binomial regression model, which estimates the predictors of
the non-zero CFR values. The truncated negative binomial regression model will be better to explain the
CFR, considering that the overdispersion problem may happen in a Poisson model. Therefore, the Logit-
NB hurdle model employed in this study is demonstrated as follows:
where Y1 signi es the probability of whether there is a death case in a city, assigned as 1 when the
answer is yes, otherwise 0; Y2 denotes the CFR; yi is the dependent variable of city i, xi is the explanatory
variable vector of city i, α and β are parameters. Various medical, environmental, demographic, and
socioeconomic factors were compiled and considered explanatory variables in Table 1.
Based on the extant literature, the in uence factors on the CFR with COVID-19 consist of medical factors,
environmental factors, demographic characteristics, and socioeconomic factors. The medical factors
include the number of con rmed COVID-19 cases and the number of doctors. The former indicator is
gathered from the National Health Commission and the Provincial Health Commissions, closely
Page 5/21associated with the CFR shown in Fig. 2. The latter indicator is a good proxy to assess the healthcare
capacity (medical resource availability and accessibility), explaining different mortality rates in different
regions [39]. The environmental factors are composed of air quality (or pollution) and climatic conditions.
AQI represents air quality, and climatic conditions are measured by humidity and temperature.
Demographic characteristics consist of age, ethnicity, gender structures, the proportion of the population
with non-agricultural hukou and population density, directly connected to the COVID-19 mortality [18].
Socioeconomic factors incorporate GDP per capita, the percentage of unemployment, and the insurance
coverage, which re ect people's socioeconomic status that will in uence their health outcomes [20].
Regarding the speci c data sources, the number of doctors, the population density, GDP capita, the
percentage of unemployment and the percentage of employees joining the urban basic medical care
system are collected from China City Statistical Yearbook 2019, which records the newest available data
of cities in 2018. The AQI daily observation data is acquired from the Ministry of Ecology and
Environment of the People’s Republic of China, and the average daily values of each city during the 2
research periods (from 1 January 2020 to 13 March 2020, and from 1 January 2020 to 1 January 2021)
are calculated. Similarly, the average humidity (%) and the average temperature (Celsius) during the
research period are gathered from the China Meteorological Administration. The average age of residents,
the proportion of ethnic minorities, the percentage of males, and the proportion of the population with
non-agricultural hukou derive from the Sixth National Population Census of China, which records the
demographic data of 2010 and is the latest data available in public because China conducts national
population census every ten years. All data that support the ndings of this study are secondary data,
and no human participants are involved.
Page 6/21Table 1
Description of explanatory variables
Category Variable name Description Data sources
Medical Cases-spring Cumulative number of National Health Commission
factors con rmed COVID-19 cases by and the Provincial Health
13 March 2020 Commissions
Cases-2021 Cumulative number of National Health Commission
con rmed COVID-19 cases by and the Provincial Health
25 January 2021 Commissions
Doctors Number of doctors (10,000 China City Statistical
doctors) Yearbook 2019
Environmental AQI-spring Average Air Quality Index from Ministry of Ecology and
factors 1 January 2020 to 13 March Environment of People’s
2020 Republic of China
AQI-2020 Average Air Quality Index in Ministry of Ecology and
2020 Environment of People’s
Republic of China
Humidity- Average humidity from 1 China Meteorological
spring January 2020 to 13 March Administration
2020 (%)
Humidity-2020 Average humidity in 2020 (%) China Meteorological
Administration
Temperature- Average temperature from 1 China Meteorological
spring January 2020 to 13 March Administration
2020 (Celsius)
Temperature- Average temperature in 2020 China Meteorological
2020 (Celsius) Administration
Demographic Age Average age of residents Sixth National Population
characteristics Census of China
Ethnicity Proportion of ethnic minorities Sixth National Population
(%) Census of China
Gender Percentage of males (%) Sixth National Population
Census of China
Urban Proportion of the population Sixth National Population
with non-agricultural hukou (%) Census of China
Density Population density (100 China city statistical
people/km2) yearbook 2019
Socioeconomic Insurance Percentage of employees China city statistical
factors joining the urban basic medical yearbook 2019
care system (%)
Page 7/21Category Variable name Description Data sources
Unemployment Percentage of Unemployment China city statistical
(%) yearbook 2019
GDP GDP per capita China city statistical
yearbook 2019
Results
To test the multicollinearity in the regression model, we calculated the variance in ation factor (VIF) and
found that each variable's VIF value is less than 3, indicating that there is no multicollinearity in our
model. A series of control variables have been incorporated into the model, and the dependent variable is
lagged from the independent and control variables, thus reducing the possible endogeneity problem to
some extent. The descriptive statistical analysis of all variables is shown in Table 2. In both parts of the
Logit-NB hurdle models, we established the CFR models in 2020 and 2021 as the dependent variables.
The Cases, AQI, Humidity, and Temperature variables are different in the 2 research periods while others
are constant.
Page 8/21Table 2
Descriptive statistical analysis
Variables Mean Min Max SD
CFR-spring 0.81 0.00 14.29 1.99
Cases-spring 276.91 0.00 49995.00 3000.03
CFR-2021 0.83 0.00 16.67 2.16
Cases-2021 299.74 0.00 50355.00 3023.17
Doctors 1.20 0.10 10.94 1.21
AQI-spring 57.23 23.24 105.52 17.73
Humidity-spring 66.14 31.66 90.60 14.16
Temperature-spring 7.13 -7.82 23.48 6.58
AQI-2020 56.62 23.73 99.94 16.18
Humidity-2020 65.49 30.15 85.46 13.10
Temperature-2020 16.56 2.01 27.89 5.30
Age 35.87 29.92 43.13 2.48
Ethnicity 92.20 11.89 99.99 16.07
Gender 51.38 47.27 99.10 3.00
Urban 30.44 8.21 86.23 15.46
Density 4.40 0.06 25.42 3.43
Insurance 0.73 0.17 10.32 0.65
Unemployment 2.38 0.19 12.42 1.45
GDP per capita 5.34 1.19 16.74 2.99
The rst part of the hurdle model is a binary logistic model, with regression results displayed in Table 3.
The binary logistic model explains whether a city has a death case with COVID-19. Model 1 represents the
model using the CFR by 13 March 2020 (CFR-spring), and Model 2 represents the model using the CFR by
25 January 2021 (CFR − 2020). We used the average AQI, humidity, and temperature from 1 January
2020 to 13 March 2020 for Model 1 (AQI-spring, Humidity-spring, and Temperature-spring), and the yearly
average AQI, humidity, and temperature in 2020 for Model 2 (AQI-2020, Humidity-2020, and Temperature-
2020). The value of R2 in Model 1 is 0.32, indicating that the binary logistic model has speci c
explanatory power for whether a city has a death case. Among the explanatory variables, the regression
coe cients of the number of con rmed cases (Cases-spring) and the air quality index (AQI-spring) are
signi cant, while other variables are not signi cant. The estimator of Cases-spring is 1.01, meaning that
the new odds will be 1.01 times the original odds, with the number of con rmed cases increasing by 1.
Page 9/21The probability of death's appearance will increase by 1% with 1 newly increased con rmed case. It
indicates that the mortality rate for each new case in a city is 1%, which is near to the CFR of 0.83% in
Fig. 2b. The air quality index exerts positive impacts on the appearance of death: the new odds of death
will increase by 4% compared with the original odds, in response to a rise of 1 unit in the air quality index.
It indicates that air quality worsening (air pollution) will increase the mortality risk, consistent with the
extant research [40, 41]. In the logistic part of the hurdle model, the regression result of Model 2 is very
similar to that of Model 1, which proves our results' robustness. The only difference between 2 models is
that the air quality is not signi cant in Model 2.
Page 10/21Table 3
First part: Regression estimates of the logistic model
Model 1: CFR-2020 Model 2: CFR-2021
Explanatory variable Odds ratio z-value Odds ratio z-value
Cases-spring 1.01*** 3.16
Cases-2021 1.01*** 3.18
Doctors 1.38 1.33 1.59 1.85
AQI-spring 1.04** 2.21
Humidity-spring 1.03 1.67
Temperature-spring 0.99 -0.12
AQI-2020 1.02 1.03
Humidity-2020 1.01 0.63
Temperature-2020 0.99 -0.29
Age 0.83 -1.84 0.83 -1.79
Ethnic 0.99 -0.53 1.00 -0.2
Gender 0.80 -0.84 0.81 -0.86
Urban 1.00 0.2 1.00 0.26
Density 0.97 -0.36 0.97 -0.39
Insurance 1.06 0.25 0.97 -0.11
Unemployment 1.02 0.14 1.05 0.35
GDP per capita 1.05 0.67 1.06 0.71
Intercept 1.11 0.03 2.37 0.25
R2 0.32 0.27
Number of observations 280 280
Note: **p < 0.05; ***p < 0.01
The second part of the hurdle model is a negative binomial model, which is demonstrated in Table 4. The
negative binomial model explains the non-zero CFRs of COVID-19. Among all variables, the medical
factors are important determinants of CFR-spring, with the estimators of the number of con rmed cases
(Cases-spring) and the number of doctors (Doctors) statistically signi cant. Among environmental
factors, the impact of humidity is signi cant. The population density (Density) is the only signi cant
variable among demographic variables in Model 1. The socioeconomic factors are non-signi cant. The
Page 11/21estimator of Cases-spring is 0.00003, signifying that the CFR will feebly increase with the number of
con rmed cases. As the number of doctors increases by 10,000, the CFR will decrease by 0.18%,
demonstrating that better medical resources will reduce the mortality risks. Humidity-spring negatively
in uences death rates: each 1% increase in Humidity-spring leads to a 0.02% decrease in CFR-spring.
Therefore, under all other factors being equal, the CFR-spring will be relatively lower in the southeastern
region. The population density (Density) exerts negative impacts on CFR-spring. This can be attributed to
the fact that the larger cities with higher population density usually have better healthcare systems at
higher density locations [42], and it is more convenient to obtain timely detection and treatment for the
infected people. Model 2 is similar to Model 1, except that Density is signi cant in Model 1 while non-
signi cant in Model 2. The results con rm their robustness. The absolute values of estimators of Cases,
Doctors, and Humidity in Model 2 are all larger than those in Model 1, implying that the accumulated
experience in response to the public health crisis does have speci c effects on reducing CFR.
Page 12/21Table 4
Second part: Negative binomial regression estimates for cities with non-zero
CFR
Model 1: CFR-2020 Model 2: CFR-2021
Explanatory variable Coe cient z-value Coe cient z-value
Cases-spring 0.00003** 2.5
Cases-2021 0.00005*** 4.27
Doctors -0.18** -2.38 -0.39*** -3.89
AQI-spring 0.01 -0.49
Humidity-spring -0.02** -2.5
Temperature-spring -0.02 -0.96
AQI-2020 -0.01 -1.16
Humidity-2020 -0.04*** -3.42
Temperature-2020 0.01 0.50
Age -0.01 -0.22 0.04 0.79
Ethnic -0.01 -0.91 -0.01 -1.33
Gender -0.08 -0.65 -0.05 -0.34
Urban 0.001 -0.1 0.00 -0.15
Density -0.09** -2.1 -0.06 -1.14
Insurance 0.35 1.12 -0.01 -0.04
Unemployment 0.06 0.67 0.05 0.55
GDP per capita -0.02 -0.55 -0.02 -0.48
Intercept 8.55 1.18 6.84 0.87
R2 0.14 0.16
Number of observations 65 68
Note: **
p < 0.05; ***p < 0.01
Discussion
Given the enormous damages to human society caused by the spread of COVID-19, robust scienti c
evidence will signi cantly contribute to the epidemic responses, especially the successful disease
Page 13/21prevention and control experiences in China. Therefore, it is crucial to clarify the in uence factors that
signi cantly affect the CFR with COVID-19 by conducting a multi-city study in China.
In this study, a Logit-NB hurdle model is employed to deal with the zero-in ation problem since nearly 3
quarters of cities have zero-value CFR, which dramatically reduces the estimation bias and improves the
explanatory power and goodness of t of the model. The Logit-NB hurdle model also re ects the 2
different CFR determinations: whether there is a death from COVID-19 in a city and how high the non-zero
value of CFR in a city is. During these 2 different processes, the in uence factors are different. The
application of the Logit-NB hurdle model in CFR research with COVID-19 will provide methodological
guidance for epidemic response.
Regarding the determinants, the number of con rmed cases is the only signi cant variable in both 2 parts
of the Logit-NB hurdle model, which is much in evidence since it is the denominator of CFR. In the rst
process of the Logit-NB hurdle model, the air quality impacts death probability, while the medical
resources, the humidity, and the population density matter in the second process of the Logit-NB hurdle
model. As it is known to all, air quality plays a vital role in the spread of COVID-19 because aerosol is a
potential transmission route for COVID-19, embodied in the level of airborne PM pollution [34]. The air
quality has affected the mortality probability in the last year due to its direct effects on the con rmed
cases with COVID-19. The medical resources and the humidity are both crucial factors in determining CFR
in different cities. The timely supply of medical resources (including medical staff and facilities) is the
key to controlling the 2 waves of outbreaks effectively in China. As an important climatic factor, humidity
has signi cant negative in uences on CFR, which follows the previous literature results [40]. However, the
socioeconomic factors and demographic characteristics do not affect the death probability and CFR,
except for the population density. The fact that people in China all enjoy free medical treatment services
for COVID-19 signi cantly contributes to reducing CFR, no matter which levels of cities they are in and
which kinds of groups they belong to.
The air quality and population density exert signi cant impacts on the mortality risk and CFR in the rst
wave of epidemic outbreak, while they are non-signi cant in the second wave. The underlying reason is
complicated, and we tried to gure it out from the newly increased con rmed cases and death cases
between 13 March 2020 and 25 January 2021. We found the death cases are mainly concentrated in
Hubei Province and very few in other provinces (only single digits). There are 360 newly increased
con rmed cases in Hubei Province from 13 March 2020 to 25 January 2021, while 1435 newly increased
deaths emerge during the same period. It indicates that most of the new death cases on 25 January
2021, resulting from the con rmed cases on 13 March 2020. In other words, the emergence of COVID-19
deaths in the second research period lags behind the con rmed cases. The critical patients with COVID-
19 in the rst period are mainly affected by this acute respiratory disease and more sensitive to the air
quality, so the worsening of air quality will directly increase the mortality risk. However, the critical
patients in the second period have been suffering from COVID-19 for some time and maybe die from
other comorbidities that are less in uenced by the air quality. Regarding the population density, in the
initial stage of the epidemic outbreak, when there is a lack of experience in responding to the epidemic,
Page 14/21the cities with higher population density usually are larger cities where people have better access to
medical resources, thus leading to a relatively lower CFR. During the second period, cities in China have
accumulated enough experience and are better prepared for the next outbreak with necessary medical
resources, making the population density not important anymore.
The main ndings of this study have certain policy implications: To begin with, given the importance of
the number of con rmed cases in determining CFR, the proposal of “ atten the curve” [43] is still vital to
help save lives and decrease CFR, by taking lockdown and social distancing measures to reduce the
number of infected people in countries most affected by COVID-19, when limited by the current medical
resources. Considering the 2 different processes in the Logit-NB hurdle model, the governments should
attach importance to the air quality when preventing the emergence of death from this disease and
emphasize the availability and accessibility of medical resources when the aim is to reduce the mortality
rate. Finally, the estimators in Model 2 have shown greater effects than those in Model 1, signifying the
accumulated experiences' in uence. The containment policies in China, including the immediate
lockdown, community containment, self-quarantine, contact-tracing, as well as the free detection and
medical treatment of this infectious disease for all residents, prove to be very effective in controlling the
spread of the virus and reducing the CFR [44], which can also provide valuable references for other
countries in the ght against the pandemic.
Despite its methodological contributions and practical implications, there still exist some de ciencies in
this study. The dependent variable re ects the con rmed cases and CFR on 13 March 2020 and 25
January 2021, while some explanatory variables only re ect the annual average limited by the data
accessibility. What is more, among explanatory variables, the city-level socioeconomic data from China
City Statistical Yearbook 2019 records the situation of 2018. The Sixth National Population Census's
demographic data records the conditions of 2010, which are all the most recent data available publicly in
China.
Conclusion
Despite these limitations, this study discovered whether there emerges a death case and how high the
CFR is proving to be 2 different processes. The death probability determinants are the number of
con rmed cases and the air quality, while the determinants on the CFR include the number of con rmed
cases, the medical resources, the humidity, and the population density. Besides, the air quality and
population density have marked effects on the death probability and CFR in the rst wave of epidemic
outbreak, while they are not signi cant in the second wave. This study contributes to the growing
literature on determinants of CFR with COVID-19 and has signi cant practical implications.
Abbreviations
COVID-19: Coronavirus disease 2019; PM: Particulate matter; CFR: Case fatality rate; Logit-NB: logistic-
negative binomial
Page 15/21Declarations
Acknowledgements
Not applicable.
Author’s contributions
YH contributed to idea formulation, study design, methodology, data collection and analysis; LX
contributed to data interpretation and manuscript writing; GH contributed to discussion, review and
editing of writing; ZZ contributed to the collection of literature and data. HH contributed to the data
collection. All authors reviewed and provided input to the writing, editing, and nalization of the paper.
The authors read and approved the nal manuscript.
Funding
The authors would like to acknowledge the support of the US National Science Foundation (NSF Grant
1758786), the National Social Foundation of China (Grants 17ZDA055), and the nancial support of the
Spatial Analysis Research Center (SPARC) in Arizona State University’s School of Geographical Sciences
and Urban Planning for nancial support.
Availability of data and materials
The data that support the ndings of this study are secondary data and no human participants are
involved. The data are available with the identi er(s) at the private link:
https:// gshare.com/s/1d536f0639eb36c0cf0a
Ethical approval and consent to participate
Not applicable.
Consent for publication
Not applicable.
Competing interests
The authors declare that they have no con ict of interest.
Page 16/21References
1. Mi Y, Huang T, Zhang J, et al. Estimating the instant case fatality rate of COVID-19 in China[J].
International Journal of Infectious Diseases, 2020, 97: 1-6.
2. Staadegaard L, Taylor R J, Spreeuwenberg P, et al. Monitoring the mortality impact of COVID-19 in
Europe: What can be learned from 2009 in uenza H1N1p mortality studies?[J]. International Journal
of Infectious Diseases, 2020, 102: 115-117.
3. Zhang X, Tang M, Guo F, et al. Associations between air pollution and COVID-19 epidemic during
quarantine period in China[J]. Environmental Pollution, 2020, 268: 115897.
4. Ali S M, Malik F, Anjum M S, et al. Exploring the linkage between PM2. 5 levels and COVID-19 spread
and its implications for socioeconomic circles[J]. Environmental Research, 2020: 110421.
5. Bashir M F, Bilal B J M A, Komal B. Correlation between environmental pollution indicators and
COVID-19 pandemic: A brief study in Californian context[J]. Environmental Research, 2020: 109652.
6. Filippini T, Rothman K J, Cocchio S, et al. Associations between mortality from COVID-19 in two
Italian regions and outdoor air pollution as assessed through tropospheric nitrogen dioxide[J].
Science of The Total Environment, 2020: 143355.
7. Frontera A, Cianfanelli L, Vlachos K, et al. Severe air pollution links to higher mortality in COVID-19
patients: the “double-hit” hypothesis[J]. Journal of Infection, 2020.
8. Marquès M, Rovira J, Nadal M, et al. Effects of air pollution on the potential transmission and
mortality of COVID-19: A preliminary case-study in Tarragona Province (Catalonia, Spain)[J].
Environmental Research, 2020, 192: 110315.
9. Saez M, Tobias A, Barceló M A. Effects of long-term exposure to air pollutants on the spatial spread
of COVID-19 in Catalonia, Spain[J]. Environmental research, 2020, 191: 110177.
10. Sasidharan M, Singh A, Torbaghan M E, et al. A vulnerability-based approach to human-mobility
reduction for countering COVID-19 transmission in London while considering local air quality[J].
Science of The Total Environment, 2020: 140515.
11. Bashir M F, Ma B, Komal B, et al. Correlation between climate indicators and COVID-19 pandemic in
New York, USA[J]. Science of The Total Environment, 2020: 138835.
12. Ma Y, Zhao Y, Liu J, et al. Effects of temperature variation and humidity on the death of COVID-19 in
Wuhan, China[J]. Science of The Total Environment, 2020: 138226.
13. Biktasheva I V. Role of a habitat's air humidity in Covid-19 mortality[J]. Science of The Total
Environment, 2020: 138763.
14. Meo S A, Abukhalaf A A, Alomar A A, et al. Climate and COVID-19 pandemic: effect of heat and
humidity on the incidence and mortality in world's top ten hottest and top ten coldest countries[J].
Eur Rev Med Pharmacol Sci, 2020, 24(15): 8232-8238.
15. Bryan M S, Sun J, Jagai J, et al. COVID-19 mortality and neighborhood characteristics in Chicago[J].
Annals of epidemiology, 2020.
Page 17/2116. Mollalo A, Vahedi B, Rivera K M. GIS-based spatial modeling of COVID-19 incidence rate in the
continental United States[J]. Science of The Total Environment, 2020: 138884.
17. Sannigrahi S, Pilla F, Basu B, et al. Examining the association between socio-demographic
composition and COVID-19 fatalities in the European region using spatial regression approach[J].
Sustainable cities and society, 2020, 62: 102418.
18. Wang K, Wu C, Xu J, et al. Factors affecting the mortality of patients with COVID-19 undergoing
surgery and the safety of medical staff: A systematic review and meta-analysis[J]. EClinicalMedicine,
2020: 100612.
19. Goutte S, Péran T, Porcher T. The role of economic structural factors in determining pandemic
mortality rates: evidence from the COVID-19 outbreak in France[J]. Research in International
Business and Finance, 2020, 54: 101281.
20. Sun Y, Hu X, Xie J. Spatial inequalities of COVID-19 mortality rate in relation to socioeconomic and
environmental factors across England[J]. Science of The Total Environment, 2020: 143595.
21. Whittle R S, Diaz-Artiles A. An ecological study of socioeconomic predictors in detection of COVID-19
cases across neighborhoods in New York City[J]. medRxiv, 2020.
22. Chaudhry R, Dranitsaris G, Mubashir T, et al. A country level analysis measuring the impact of
government actions, country preparedness and socioeconomic factors on COVID-19 mortality and
related health outcomes[J]. EClinicalMedicine, 2020, 25: 100464.
23. Sun Z, Zhang H, Yang Y, et al. Impacts of geographic factors and population density on the COVID-19
spreading under the lockdown policies of China[J]. Science of The Total Environment, 2020, 746:
141347.
24. Figueiredo A M, Daponte Codina A, Figueiredo M, et al. Impact of lockdown on COVID-19 incidence
and mortality in China: an interrupted time series study[J]. Bull World Health Organ, 2020.
25. Brandén M, Aradhya S, Kolk M, et al. Residential context and COVID-19 mortality among adults aged
70 years and older in Stockholm: a population-based, observational study using individual-level
data[J]. The Lancet healthy longevity, 2020, 1(2): e80-e88.
26. Skrip L, Derra K, Kaboré M, et al. Clinical Management and Mortality among COVID-19 Cases in Sub-
Saharan Africa: A retrospective study from Burkina Faso and simulated case data analysis[J].
International Journal of Infectious Diseases, 2020, 101:194-200.
27. Rodriguez-Nava G, Yanez-Bello M A, Trelles-Garcia D P, et al. Clinical characteristics and risk factors
for mortality of hospitalized patients with COVID-19 in a community hospital: A retrospective cohort
study[J]. Mayo Clinic Proceedings: Innovations, Quality & Outcomes, 2020.
28. Yu C, Lei Q, Li W, et al. Clinical Characteristics, Associated Factors, and Predicting COVID-19 Mortality
Risk: A Retrospective Study in Wuhan, China[J]. American Journal of Preventive Medicine, 2020.
29. Fielding-Miller R K, Sundaram M E, Brouwer K. Social determinants of COVID-19 mortality at the
county level[J]. medRxiv, 2020.
30. Andersen L M, Harden S R, Sugg M M, et al. Analyzing the spatial determinants of local Covid-19
transmission in the United States[J]. Science of the Total Environment, 2020, 754: 142396.
Page 18/2131. Chen L, Liu S, Tian J, et al. Disease progression patterns and risk factors associated with mortality in
deceased patients with COVID‐19 in Hubei Province, China[J]. Immunity, in ammation and disease,
2020, 8(4): 584-594.
32. Wang K, Zuo P, Liu Y, et al. Clinical and laboratory predictors of in-hospital mortality in patients with
COVID-19: a cohort study in Wuhan, China[J]. Clinical infectious diseases, 2020.
33. Zhu G, Zhu Y, Wang Z, et al. The association between ambient temperature and mortality of the
coronavirus disease 2019 (COVID-19) in Wuhan, China: a time-series analysis[J]. BMC Public Health,
2021, 21(1): 1-10.
34. Wang B, Liu J, Li Y, et al. Airborne particulate matter, population mobility and COVID-19: a multi-city
study in China[J]. BMC public health, 2020, 20(1): 1-10.
35. Xie J, Zhu Y. Association between ambient temperature and COVID-19 infection in 122 cities from
China[J]. Science of the Total Environment, 2020, 724: 138201.
36. Yao Y, Pan J, Wang W, et al. Association of particulate matter pollution and case fatality rate of
COVID-19 in 49 Chinese cities[J]. Science of the Total Environment, 2020, 741: 140396.
37. Mukherji N. The Social and Economic Factors Underlying the Impact of COVID-19 Cases and Deaths
in US Counties[J]. medRxiv, 2020.
38. Wang L, Wang G, Gao L, et al. Spatiotemporal dynamics, nowcasting and forecasting of COVID-19 in
the United States[J]. arXiv preprint arXiv:2004.14103, 2020.
39. Ji Y, Ma Z, Peppelenbosch M P, et al. Potential association between COVID-19 mortality and health-
care resource availability[J]. The Lancet Global Health, 2020, 8(4): e480.
40. Fareed Z, Iqbal N, Shahzad F, et al. Co-variance nexus between COVID-19 mortality, humidity, and air
quality index in Wuhan, China: New insights from partial and multiple wavelet coherence[J]. Air
Quality, Atmosphere & Health, 2020, 13: 673-682.
41. Pansini R, Fornacca D. COVID-19 higher induced mortality in Chinese regions with lower air quality[J].
medRxiv, 2020.
42. Hamidi S, Sabouri S, Ewing R. Does density aggravate the COVID-19 pandemic? Early ndings and
lessons for planners[J]. Journal of the American Planning Association, 2020, 86(4): 495-509.
43. Godoy M. Flattening A Pandemic's Curve: Why Staying Home Now Can Save Lives[J]. National Public
Radio, March, 2020, 13.
44. Maier B F, Brockmann D. Effective containment explains subexponential growth in recent con rmed
COVID-19 cases in China[J]. Science, 2020, 368(6492): 742-746.
Figures
Page 19/21Figure 1
COVID-19 CFRs at the city level Note: The designations employed and the presentation of the material on
this map do not imply the expression of any opinion whatsoever on the part of Research Square
concerning the legal status of any country, territory, city or area or of its authorities, or concerning the
delimitation of its frontiers or boundaries. This map has been provided by the authors.
Page 20/21Figure 2
Scatterplot of COVID-19 deaths against cases at the city level
Page 21/21You can also read