NORD/LB Group Presentation - August 2018
←
→
Page content transcription
If your browser does not render page correctly, please read the page content below

NORD/LB Group Presentation
August 2018

              1
Agenda.

NORD/LB at a glance       3
Financials                10
Segments                  18
Outlook                   33
Appendix                  38

                      2
NORD/LB at a glance

Established commercial bank in northern Germany.

                      Successful universal bank for over 250 years in the market

                      Among the top seven German banks

                      Market leader in Northern Germany in its business units private, commercial and corporate customers

                      Excellent knowledge in renewable energy and infrastructure projects

                      Over 30 years of experience in ship and aircraft finance

                      Represented in important financial centres worldwide

                      Member of the extended Guarantee Funds of landesbanks and savings banks

                                                                 3
NORD/LB at a glance

        Ownership structure and regional network.

                           Strong support from our owners¹                                              Headquarters and ownership region

                                                           Special Purpose Holding Association of
                                                           the Mecklenburg-Western Pomerania
         Saxony-Anhalt Savings                             Savings Banks
      Banks Holding Association
                                                    3.7%
                                             5.3%                                                                  Hanover
                                                                                                                        Brunswick
                                                                                                                             Magdeburg

         Lower Saxony
Savings Banks and Giro       26.4%
           Association

                                      5.6%                          59.1%

         State of Saxony-Anhalt
                                                                        State of Lower Saxony

 ¹ Total differences are rounding differences
                                                                                                    4
NORD/LB at a glance

      Represented in important financial and trade centres worldwide.

                                                                                                                       Head offices
                                                                                                                       Hanover, Brunswick, Magdeburg
                                                                                                                       Branches worldwide
                                                                                                                       London, New York, Singapore,
                           New York
                                                                                                                       Shanghai
                                                                                                                       German branches
                                                                                                                       Bremen, Duesseldorf, Hamburg,
                                                                                                                       Munich, Oldenburg Schwerin,
                                                                                                                       Stuttgart and approx. 100 branches
                                                                                                                       of Braunschweigische
                                                                                                                       Landessparkasse
                                                                                                                       Subsidiaries and bank holdings
                                                            London
                                                                                       Hamburg                         Deutsche Hypothekenbank,
                                                                              Oldenburg
                                                                                     Bremen
                                                                                                   Schwerin            NORD/LB Luxembourg Covered Bond
                                                                      Amsterdam
                                                                                              Brunswick                Bank
                                                                                   Hanover      Magdeburg     Warsaw
                                                                                    Duesseldorf
                                                                      Luxembourg
                                                                Paris             Frankfurt
                                                                                          Nuremberg                                          Shanghai
                                                                                    Stuttgart
                                                                                              Munich

                                                                                                                                 Singapore

Addresses and more details: www.nordlb.com/nordlb/about-us/locations-worldwide
                                                                                               5
NORD/LB at a glance

Our business segments.

                      Corporate                            Energy and                               Aircraft
                      Customers                           Infrastructure                           Customers
                                                            Customers
                      Corporate                                                                 Aircraft finance
                      customer                            Renewable                                Narrowbodies
                      business                            energy finance
                                                                                                   Widebodies
   Private and        Agricultural        Markets         Infrastructure   Ship Customers                          Real Estate
                                                                                                   Freighters
   Commercial         Banking                             finance                                                    Banking
                                                                           Ship finance            Regional Jets
    Customers         Finance with    Business with                                                                 Customers
                                                                              Container            Turboprops
                      public and         Institutional
    Private                                                                   Vessels              Helicopter
                      cooperative        customers                                                                 Commercial
    customer          housing                                                 Bulker               Spare Engines   real estate
    business                             Savings banks/
                      associations                                            Tanker               Finance and     finance
                                         financial
    Private           Syndication                                             Multi-Purpose        Operating       International
                                         institutions
    Banking           business with                                           Offshore Oil &       Lease           Social care
                                         Public-sector
    Commercial        associated                                              Gas                                  property
                                         customers
    customer          savings banks                                           Cruise/ Ferries                      finance
    business                             Municipal
                      Corporate          customers
    Insurance         Finance
    services for      Leasing
    private
    customers in
    cooperation
    with public
    insurances in
    Lower Saxony

                                                                6
NORD/LB at a glance

       Holding structure and brands.1

                                                                              Private and Commercial Customers
                                                                              Corporate Customers
                                                                              Markets
                                                                              Ship, Aircraft, Energy/Infrastructure, Real
                                                                              Estate Banking
                                                                              Leasing

                                                  100%2                                           3
                                                                                                                                          100%2

                                Commercial real estate                                   Private and commercial                        Loans
                                finance                                                  customers                                     Financial Markets & Sales
                                                                                                                                       Client services & B2B

¹ For additional information about subsidiaries and affiliated companies please consult https://www.nordlb.com/nordlb/about-us/investments/ or our Group Annual Reports 2017, note (84)
² NORD/LB ensures that the companies mentioned in the Annual Report 2017 note (75) are able to meet their obligations
³ Incorporated under public law with partial legal capacity
                                                                                                  7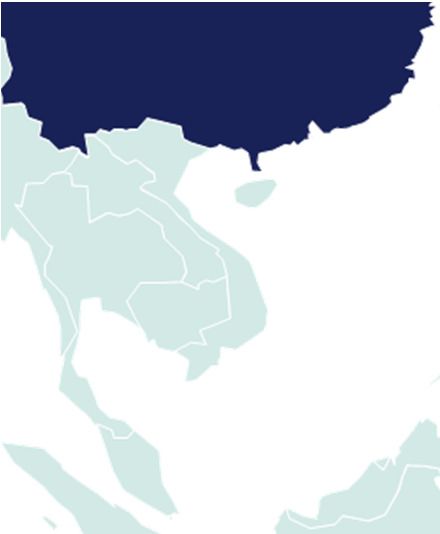
NORD/LB at a glance

     Our ratings.

                  NORD/LB credit ratings

                   Senior unsecured preferred debt with outlook                     Baa2, negative    A-, negative     A, positive
                   Deposits with outlook (long-term/short-term)                  Baa2/P-2, negative        A-/F1       A/R-1 (low)
                   Counterparty Risk Rating/Derivate
                                                                                      Baa2/P-2         A-(dcr)/-             -
                   counterparty rating (long-term/short-term)
                   Senior unsecured non-preferred debt with
                                                                                    Ba1, negative     A-, negative   A (low), positive
                   outlook
                   Subordinate/Tier 2                                                    B1                BB-         BBB (high)
                   Intrinsic financial strength   1                                      ba3                bb          BBB (low)
                   Tier 1                                                            Caa1 (hyb)              -               -
                   Public-Sector / Mortgage / Aircraft Pfandbriefe                  Aa1 / Aa1 / A3           -               -

                  NORD/LB sustainability ratings

                   Corporate Rating                                    C Prime                        AA             64 of 100 points

                   Unsecured Bonds                                   Neutral CCC
                   Public-Sector Pfandbriefe                         Positive BBB
                   Mortgage Pfandbriefe                               Positive BB
                   Shipping Pfandbriefe                                Positive B

1   Adjusted Baseline Credit Assessment / Viability Rating / Intrinsic Assessment
                                                                                                  8
Agenda.

NORD/LB at a glance       3
Financials                10
Segments                  18
Outlook                   33
Appendix                  38

                      9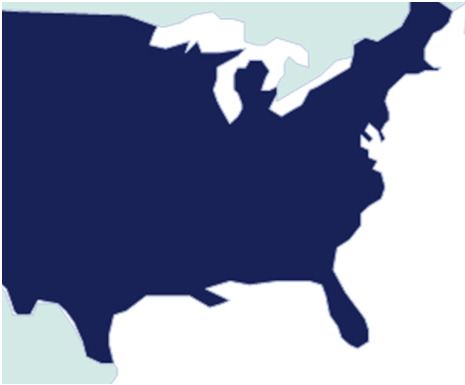
Financials

Good result and comfortable equity ratios with further reduced shipping portfolio.

   Common Equity        Capital ratio strengthened through disciplined RWA- and balance sheet management. Common
     Tier I ratio       Equity Tier 1 ratio at 12.8 per cent as at 31 Mar 2018, significantly above regulatory requirements
      > 11,0 %          (9.54 per cent)

                        Consolidated profit before taxes with €68m as at 31 Mar 2018. The previous year was impacted
 Consolidated profit
                        by profits from sale of promissory notes and amounted to €295m before taxes

                        The shipping portfolio was further reduced by €215m in the first quarter 2018 (as at
    Reduction of        31 March 2018 €11.6bn). The share of non-performing loans (NPL) should be reduced from
  shipping portfolio    €7.9bn to €5bn by the end of 2019

                        On track: balance sheet further decreased through reduction of the shipping portfolio and
    Transformation      securities portfolio to €159.7bn (€165.4bn as at 31 Dec 2017); capital ratios increased again

                                                    10
Financials
Income statement according to IFRS 9.
1 Jan - 1 Jan - Change
Income statement (in €m)
31 Mar 2018 31 Mar 20171 in % Decline in net interest income due to persistently low interest
Net interest income 352 406 -13 rates and decreasing average asset levels
Risk result 25 -101 >100 Risk result: The reversals are based i.a. on positive effects from
the disposal of ship exposures
Net commission income 18 43 -58
Profit/loss from financial Net commission income: Lower fee income, increased payments
instruments at fair value 3 114 -97 for guarantee premiums
(including hedge accounting)
Profit/loss from financial instruments at fair value (including
Disposal profit/loss from
financial assets not measured hedge accounting): Positive currency result (€33m) nearly
-6 224 >100 compensates negative trading p/l from currency derivatives
at fair value through
profit/loss (€-35m)
Profit/loss from investments -3 2 >100 Disposal profit/loss from financial assets not measured at fair
Profit/loss from investments value through profit/loss: Especially characterized by the
accounted for using the equity 5 3 67 repurchase of own issues; previous year includes profit from sales
method of promissory notes
Administrative expenses 291 318 -8
Administrative expenses: Lower allocations and contributions;
Other operating profit -35 -75 53 include the cost of the Landesbank's security reserve (previous
Earnings before year: full amount, only 25 percent this year in the first quarter2)
68 298 -77
reorganisation and taxes and ECB levy
Reorganisation expenses - 3 -100 The Other operating result is influenced in particular by the
Earnings before taxes 68 295 -77 annual contribution of the bank levy (€50m) in 2018
Income taxes 25 47 -47
Consolidated profit 43 248 -83
1 Some previous year figures were adjusted, see Annual Report 2017, Note (2)
2 According to IDW (Institute of Auditors) the contribution to the Landesbank‘s security reserve should be quarterly recognised in the financial statements
11Financials
Total assets further reduced.
Total assets slightly decreasing due to reduction of shipping
Balance sheet (in €m) 31 March 2018 portfolio
Trading assets: Slight decrease of customer loans and debentures,
effects from interest-rate and currency derivatives
Total assets 159,655
Financial assets at fair value through other comprehensive
income contain customer loans and assets at fair value, nearly
unchanged
Trading assets 9,717
Financial assets at amortised costs: Slight decrease of money
market biz with banks and customers
Financial assets at fair value through other
21,525 Designated financial liabilities at fair value through profit or
comprehensive income
loss: Slight increase, especially secured liabilities
Financial liabilities at amortised cost contain extraordinary
Financial assets at amortised costs 118,095
liabilities to customers and banks, issued bonds, Pfandbriefs and
money market bonds, slightly decreased due to lower funding
needs
Designated financial liabilities at fair value
7,411
through profit or loss Equity (balance sheet) strengthen by the increase of retained
earnings and revaluation of net liabilities from performance-
oriented pension plans
Financial liabilities at amortised cost 136,201
Equity (balance sheet) 6,008
12Financials
High quality of total portfolio: 79 per cent in the highest category.
5.5%
4.2% 4.7% 4.7% 4.9%
NPL ratio
in %
211.0 8.8
Total exposure1 4.1 194.8
193.7 9.1 10.7
3.3
3.7
187.4 8.8 182.2
in €bn 8.6 4.1 8.8
9.9 3.2 1.8 2.3 2.2
7.7 5.3 1.6 1.4
15.4 9.9 8.7 7.0 4.4
6.4 4.8
13.9 16.6 15.5
15.2
default (=NPL)
very high risk
high risk
increased risk 160.9
146.3 147.6 147.8 143.3
reasonable/satisfactory
good/satisfactory
very good to good
2014² 2015 2016² 2017 31 Mar 2018
1 Total differences are rounding differences
2 Figures were adjusted, see Interim Report as at 30 Jun 2015, page 28 and Interim Report as at 30 Sep 2017, page 32
13Financials
Capital ratios strengthened through active balance sheet management.
Capital ratios (transitional) Capital ratios (fully loaded)
CET1¹ TC² CET1¹ TC²
18.1% 18.9% 17.7% 18.8%
16.7% 16.3% 16.7%
15.2%
13.2% 12.4%
13.1% 11.3% 12.4% 12.8% 12.2% 11.9% 12.8%
10.7% 8.4% 9.9%
3
31 Dec 2014 31 Dec 2015 31 Dec 2016 31 Dec 2017 31 Mar 2018 31 Dec 2014 31 Dec 2015 31 Dec 2016 31 Dec 2017 3 31 Mar 2018
SREP minimum requirements (P2R) CET11 since 1.1.2018: 9.54 %
SREP minimum requirements (P2R) TC2 since 1.1.2018: 13.04 %
Risk-weighted assets (RWA) Common Equity Tier I
in €bn in €m
8,319
7,380
69.2 63.7 6,752
59.9 5,804 5,862
46.9 45.7
31 Dec 2014 31 Dec 2015 31 Dec 2016 31 Dec 2017 31 Mar 2018 31 Dec 2014 31 Dec 2015 31 Dec 16 31 Dec 17 31 Mar 18
1 CET1 - Common Equity Tier 1 2 TC - Total Capital) 3 Figures were adjusted
14Financials
Equity development.
NORD/LB Group –Equity development1
0.2% - 0.5% 0.6% 0.2%
12.2% 12.4% 12.8%
CET1 as at Correction CET1 as at Phase-in-effects Changes due to Further changes CET1 as at
31 Dec 2017 31 Dec 2017 since IFRS 9 31 Mar 2018
corrected 1 January 2018
Correction Adjustment of preliminary results by final figures from the annual financial statements (including final risk provisioning)
Further changes in Q1/2018 especially further decline of RWA
1 Total differences are rounding differences
15Financials
Leverage ratio and LCR increased slightly.
LCR1 Leverage Ratio
205% 206% 4.3%
3.5% 3.7% 3.4% 3.6%
97% 101% 110%
31 Dec 2014 31 Dec 2015 31 Dec 2016 31 Dec 2017 31 Mar 2018 31 Dec 2014 31 Dec 2015 31 Dec 2016 31 Dec 2017 31 Mar 2018
1 LCR – Liquidity Coverage Ratio
16Agenda.
NORD/LB at a glance 3
Financials 10
Segments 18
Outlook 33
Appendix 38
17Segments
Our solid and diversified business model proved its strength against market
distortions.
Energy and Real
in €m Private and Corporate Savings Ship Aircraft
Markets Infra- Estate
as at Commercial Customers Banks Customers Customers
structure Banking
31 Mar 2018 Customers Network
Customers Customers
Portfolio share1 8% 27 % 8% 3% 13 % 12 % 9% 13 %
Operative
17 68 25 5 38 34 18 32
earnings2
Loan loss
1 -2 0 0 -2 -8 -4 -7
provisions
Earnings before
16 70 25 5 40 42 22 39
taxes
Positive development of bank’s core business continues
A diversified portfolio of business segments with only marginal correlation is a key factor of business model’s stability
1 Risk-weighted assets €45.6m (Group Management/Others, Reconciliations: 9 %)
2 Operative earnings before taxes: €43m (Group Management/Others, Reconciliations: €193m)
18Segments
Positive development in segment results. Loan loss provisions still affected by ship
financing.
Operative earnings1,2 Loan loss provisions1 Earnings before taxes1,3
in €m in €m in €m
Private & Commercial
Customers 17 31 Mar 2018 1 16
31 Mar 2018 31 Mar 2018
Corporate Customers 68 -2 70
Markets 25 0 25
Savings Banks Network 5 0 5
Energy & Infrastructure
38 -2 40
Customers
Ship Customers 34 -8 42
Aircraft Customers 18 -4 22
Real Estate Banking
32 -7 39
Customers
-193 Group Controlling/ Others -2 -191
NORD/LB Group 43 -25 68
1 Minor differences might occur in the reproduction of mathematical operations
² Earnings before provisions, reorganisation and taxes ³ Before reorganisation
19Segments
Private and Commercial Customers. Deeply rooted in the home region.
Exposure by industry1 €m 31 Mar 2018
Earnings 58
as at 31 Mar 2018 Exposure at default: €7.9bn
Expenses 41
Operative earnings 17
Loan loss provisions 1
Other service Other 12% Earnings before taxes 16
industry 12%
Advice and service in nearly 100 locations as well as
online and by phone via BLSK.direkt
We offer customer-oriented consulting and selected
Land, housing
products and services for private and commercial
20%
customers within the region of Braunschweigische
Landessparkasse, in Hanover, in Hamburg as well as in
Bremen and Oldenburg
NORD/LB and Braunschweigische Landessparkasse offer
inheritance optimisation, trust management, portfolio
Public management and individual asset management for
Private administration, private banking clients
household 44% defence, social
insurance 12% Successful performance with partners like Öffentliche
Versicherung Braunschweig, LBS Nord (building society),
Deka, Deutsche Leasing, S-Kreditpartner and the
Versicherungsgruppe Hannover (insurance companies)
¹ The chart may include minor differences that occur in the reproduction of mathematical operations
20Segments
Corporate customer business. Stable and well diversified portfolio.
Exposure by industry1 €m 31 Mar 2018
as at 31 Mar 2018 Exposure at default: €25.7bn Earnings 103
Expenses 35
Operative earnings 68
Manufacturing Loan loss provisions -2
industry Earnings before taxes 70
14%
Service Stable business development with existing and new
industries/other
customers in the corporate customer segment
34%
Tailor-made financial solutions for SMEs – partly in close
Energy, water and
mining
cooperation with the Savings Banks
13% Strong position and high competence in acquisition finance
business confirmed
Construction Elevated market position as an important financer in the field
3% of agricultural banking
Financing Successful marketing of asset and structuring expertise in
institutes/ Trade, public housing segment
insurance maintenance and
companies repairs Successful strategic positioning with customers together with
13% Agriculture, 11% corporate finance (e.g. asset-liability management, capital-
Transport/ forestry and market financing, working-capital management and
communications fishing 7% purchasing receivables)
5%
For over 25 years we are one of the leading lenders for
leasing companies
¹ The chart may include minor differences that occur in the reproduction of mathematical operations
21Segments
Markets. Frequent issuer of benchmarks.
Benchmark issues 2017/2018 €m 31 Mar 2018
Earnings 52
Expenses 27
Operative earnings 25
Loan loss provisions 0
Earnings before taxes 25
EUR 500,000,000 EUR 300,000,000 EUR 500,000,000
0.625% 0.625% 0.375%
Public Sector Pfandbrief Public Sector Pfandbrief (Tap) Public Sector Pfandbrief
Jan 2017 – Jan 2027 Jan 2017 – Jan 2027 Oct 2017 – Oct 2024
Issuer of Pfandbriefe (public-sector, mortgage, ship and
Joint Bookrunner Joint Bookrunner Joint Bookrunner aircraft), Lettres de Gage (covered bonds according to
Luxemburg law), bearer bonds, promissory notes, money
market securities
Successful positioning as lead manager/arranger of bond
EUR 500,000,000 EUR 500,000,000
0.375%
EUR 500,000,000 issues, particularly covered bonds
0.250% 0.125%
Mortagage Pfandbrief
Lettres de Gage
Feb 2017 – Aug 2021 Jun 2017 – Jun 2025
Green Pfandbrief
Nov 2017 – Nov 2023
Comprehensive, customized range of money and capital
Joint Bookrunner Joint Bookrunner Joint Bookrunner market products in private placement segment
International funding programmes1:
€25bn euro MTN Programme, €10bn euro CP Programme,
€4bn euro French CD Programme, $3bn US dollar CP
EUR 1.000,000,000 USD 650,000,000 GBP 325,000,000 Programme
0.75% 2,875% 3m GBP Libor + 27bp
Mortgage Pfandbrief
Jan 2018 – Jan 2028
Lettres de Gage publiques
Feb 2018 – Feb 2021
Green Pfandbrief
Nov 2017 – Nov 2023
As at 31 March 2018 €29.0bn ECB eligible securities
Joint Bookrunner Joint Bookrunner Senior Co-Lead Manager concerning NORD/LB Group, thereof €21.8bn from
NORD/LB AöR
22Segments
Energy- and Infrastructure Customers. Stability and expansion in growth industries.
By industry1 €m 31 Mar 2018
Earnings 61
as at 31 Mar 2018 Exposure at default: €16.8bn
Expenses 23
Manufacturing Transportation Operative earnings 38
industry 4% Loan loss provisions -2
Supply and 1% Earnings before taxes 40
disposal 4%
Other energy Expansion and strengthening of our market position through
6% long-term expertise and customised structuring in
renewable energy finance; our focus is on energy from wind
Solar energy and solar, leading financer in European core markets
9%
Germany, France, Ireland and UK. Expansion of customer
base in North America and Asia in energy sector
Public Sector Wind onshore
5% 49% Concentration on social infrastructure projects in the fields
Media and IT
of education, accommodation, blue light and
1% transportation; Public Finance Initiative (PFI) as well as
public project finance business
Trade and Services
14%
Gas / biogas Financial Services
5% 2%
¹ The chart may include minor differences that occur in the reproduction of mathematical operations
23Segments
Industry outlook ships: shipping markets copes with progressive fleet growth.
Delivery schedule
Auslieferungszeitplan Demolitions
Verschrottungen
1200 500
431
408
1000
400
der Schiffe
316
Schiffe
800
of vessels
of vessels
300
600 214
194
no.Anzahl
200 171
Anzahl
400 141
102
no.
93 92
200 100 50 58
40
13 21
0 0
2016 2017 2018 2019 2020 2021 2014 2015 2016 2017 YTD (Q1) 2018
Container Bulker Tanker delivered
ausgeliefert Container Bulker Tanker
Multitude of deliveries planed in 2018 Decrease of demolitions reflect market recovery in the respective
sector
Significant increase in the tanker segment because of the contrary
development
450 7500+ TEU Idle Fleet 1.800.000
400 5100-7499 TEU 1.600.000 Harpex Baltic Dry (weekly)
3000-5099 TEU
350 1.400.000
300
2000-2999 TEU
1.200.000
1000 5.000
no. of vessels
1000-1999 TEU
250 1.000.000 800 4.000
TEU
500-999 TEU
200
total TEU (RHS)
800.000
600 3.000
150 600.000
100 400.000
400 2.000
50 200.000 200 1.000
0 0
0 0
Idle fleet in 1Q2018 with seasonal harmless increase
24Segments
Normal seasonality in Q1 2018 but fundamental backdrop remains firm.
Feeder Intermediate Neo-/Postpanamax Bulker Multi-Purpose
Containerships < 3K TEU Containerships 3-5,9K TEU Containerships >(6-14,9/ Heavy Lift & General Cargo
>15K TEU
Current market level: Current market level: Current market level: Current market level: Current market level:
medium medium medium medium low
Expected Expected Expected Expected Expected
market development: market development: market development: market development: market development:
up to 12 mths / 12-36 mths up to 12 mths / 12-36 mths up to 12 mths / 12-36 mths up to12 mths / 12-36 mths up to12 mths / 12-36 mths
slight increase / unchanged unchanged/ unchanged slight increase / unchanged slight increase / slight decrease unchanged / slight increase
Crude oil Product Other Cruise ships Off shore
tankers tankers tankers and ferries
Current market level: Current market level: Current market level: Current market level: Current market level:
low weak weak high low
Expected Expected Expected Expected Expected
market development: market development: market development: market development: market development:
up to 12 mths / 12-36 mths up to12 mths / 12-36 mths up to12 mths / 12-36 mths up to12 mths / 12-36 mths up to12 mths / 12-36 mths
unchanged / slight increase unchanged / slight increase unchanged / slight increase unchanged / unchanged unchanged / slight increase
Source: NORD/LB sector research based on charter rates and market values (new constructions and second hand) / as at March 2018
25NORD/LB Group results as at 31 March 2018
Successful transformation and reduction of ship financings.
NORD/LB Group - exposure reduction1
in €bn
19.0
12.1 -0.2 -0.5 0.1 11.6
17.3 0.5 0.8
10.5 9.7
1.7 1.1 1.1
EaD EaD Reduction of Redemptions2 New business EaD
shipping loans shipping loans ship loans shipping loans
Dec 2015 Dec 2017 March 2018
Non-commercial shipping
Already negotiated reductions of loans
Reduction by €215m in the first quarter 2018 (represents 23 shipping loans)
Portfolio reduction is mainly driven by: Contractual repayment of balloon financings, extraordinary repayments and placements
The NPL portfolio amounted to €7.9bn as at 31 March 2018, the target is a reduction to €5bn until end 2019
¹ The chart may include minor differences that occur in the reproduction of mathematical operations
2 Incl. USD development (approx. -€265m)
26Segments
Ship financing. Diversified portfolio.
€m 31 Mar 2018
Earnings 54
Expenses 20
Operative earnings 34
Loan loss provisions -8
Earnings before taxes 42
Selective new business in the segments cruises, ferries and special tonnage (e.g. cement and asphalt carrier)
Transformation
Business strategy development through further segmentation and geographic diversification as well as by the development and
reorganisation of the product range
27NORD/LB Group results as at 31 March 2018
Shipping portfolio.
Shipping portfolio by rating1 Loan loss provisions for shipping (balance sheet)
in €m
Rating class 16-18 Portfolio loan loss provisions
Rating class 11-15 Single loan loss provisions
€16.9bn Rating class 1-10 4,471
151
3,5912
€9.4bn €12.1bn €11.6bn 3,307
131 550
2,714
345
€8.2bn €7.9bn 2,243
4.320
421
€3.8bn 3.176 3.042
2.369
€1.7bn 1.822
€1.7bn
€3.6bn
€2.2bn
€1.9bn
31 Dec 2016 31 Dec 2017 31 Mar 2018 2014 2015 2016 2017 31 Mar 18
1 The chart may include minor differences that occur in the reproduction of mathematical operations
2 Since 1 Jan 2018 acc. to IFRS 9 (Portfolio loan loss provisions (old): Additional fair value allowance for defaulted loans and valuation allowance for performing loans)
28NORD/LB Group results as at 31 March 2018
Ship Customers. Portfolio reduction continues.
Ship exposure NPL portfolio and core coverage ratio
in €bn in €bn
NPL-Exposure
Core Coverage Ratio
94% 100%
88%
14
84%
77%
19.0 12 80%
17.7
16.9 10 9.4
8.2 60%
8 7.9
7.0
6.5
12.1
11.6 6 40%
4
20%
2
0 0%
2014 2015 2016 2017 31 Mar 18 2014 2015 2016 2017 31.3.18
1 Due to rounding, slight differences may occur
29Segments
Aircraft customers. High-quality portfolio. Well diversified.
By type of aircraft and year of manufacture1 €m 31 Mar 2018
Earnings 26
as at 31 Mar 2018 Exposure at default: €5.7bn
Expenses 8
Turboprop Operative earnings 18
5% Loan loss provisions -4
Freighter
Earnings before taxes 22
14%
Aircraft portfolio with 535 aircrafts (and other airplanes in
Regional Jets Narrow-
bodies warehouse facilities), 6 helicopters and 4 (spare-) engines is
7%
43% well diversified.
Ultra Large Considering only long-standing and fungible assets (aircrafts
Aircraft and turbines)
7%
Widebodies
Exposure has very high collateral coverage (approx. 95 per
24% cent)
43% 44% Average age of roughly 6 years
Mostly warehouse and operating lease structures
During the past 20 years established as a market leader in
aircraft finance: broad range of commercial and covered
13% financing of widebodies, narrowbodies, regional jets and
helicopters
1%
Conservative risk approach in line with our financing
Construction year Construction year Construction year New delivery since principles and high risk awareness as well as ensuring
2007 and earlier 2008 - 2012 2013 - 2017 2018
appropriate redemption payments/finance structures
¹ The chart may include minor differences that occur in the reproduction of mathematical operations Focus on reliable and well-known partners
30Segments
Real Estate Banking Customers. Focus on commercial real estate in Germany.
By country1 €m 31 Mar 2018
Earnings 47
as at 31 Mar 2018 Exposure at default: €15.2bn
Expenses 15
Operative earnings 32
Benelux Loan loss provisions -7
18% Earnings before taxes 39
Deutsche Hypothekenbank is the competence centre for
commercial real estate (CRE) within NORD/LB Group
Tailored financial solutions and individual, high quality
customer consultation
UK 10% Emphasis is on financing of office buildings, shopping
malls, hotels, logistics facilities and multi-story residential
properties in preferred urban centres with good tenant
USA 1% structure and above average cash flow
Germany
61%
Activities are focussed on Europe especially on Germany
France 7%
and financings of commercial real estate in UK, France,
Spain 1% Benelux, Spain and Poland
Other 2% Since the 1980’s the bank has financed housing projects.
Today, the bank is one of the leading institutions to
finance affordable housing projects nationwide
Successful strategic cooperation with pension funds as
financing partners for high-volume projects
¹ The chart may include minor differences that occur in the reproduction of mathematical operations
31Agenda.
NORD/LB at a glance 3
Financials 10
Segments 18
Outlook 33
Appendix 38
32Outlook
Transformation of the bank – our goals.
Business model Group structure Operating model
Focus on core business segments, Simplification of the Group Enhancing the operating model
portfolio reduction in Shipping structure, just as started with full and significant improving of the
Customers‘ segment integration of Bremer Landesbank bank‘s efficiency
Sound Cost reduction
CET1 Higher efficiency Cost-income ratio (incl. synergies of €150-200m
capital base ca. 13 per cent < 50 per cent until the end of 2020
BLB1 merger)
Sustainable Revenue level at Cost synergies Target of BLB1 merger Administrative Target level
earnings roughly €2bn up to €80m expenses < €1bn
¹ Bremer Landesbank
33Outlook
Transformation of the bank – target achievement on track.
Target achievement as at Target achievement as at
Targets Figure Long-term target 31 Dec 2017 31 March 2018
Sound capital base CET 1 ratio 13 % 12.2 % 12.8 %
Business model
Sustainable profitability1) Profit level approx. €2bn €2.1bn €369m (Q1)
Reduction of shipping NPL portfolio until 2019: €5bn €8.2bn €7.9bn
portfolio
Group structure
€80m
Cost synergies BLB-merger Synergies 96 % contracted 97 % contracted
423 MAK
Deutsche Hypo No sale to further benefit from its profitability
Operating model
Cost reduction by until YE 2020: €230m identified by €230m identified by
Savings
transformation €150 – 200m initiatives initiatives
until YE 2020:
Administrative expenses Target amount €1.2bn €291m (Q1)
< €1bn
1)Net interest income, net commission income, profit/loss from financial instruments at fair value incl. hedge accounting, profit/loss from financial assets, profit/loss from investments accounted for using the
equity method resp. net interest income, Net commission income, Profit/loss from financial instruments at fair value (including hedge accounting), Disposal profit/loss from financial assets not measured at
fair value through profit/loss, Profit/loss from investments, Profit/loss from investments accounted for using the equity method
34Outlook
NORD/LB expects a difficult year 2018.
Overall, we expect a difficult business year. Given the current framework conditions we continue to aim
Financial year 2018
for a profit for 2018
Shipping portfolio
We expect to have high expenses caused by the shipping crisis in the next quarters
The merger with Bremer Landesbank will cause additional restructuring expenses before positive effects
Costs
from synergies will come into effect. Further costs will be generated by regulatory requirements
The most important topics for financial year 2018 are the ongoing strengthening of capital ratios, the
Challenges
reduction of the shipping NPLs and the development of the business model
35Outlook
Financial calendar.
Interim Report as at 30 June 2018 End of August 2018
Figures as at 30 September 2018 End of November 2018
36Agenda.
NORD/LB at a glance 3
Financials 10
Segments 18
Outlook 33
Appendix 38
37Appendix
Pfandbriefe (covered bonds) at a glance.
Public Sector Pfandbriefe Mortgage Pfandbriefe
as at 31 Mar 2018 Total cover pool: €22.6bn as at 31 Mar 2018 Total cover pool: €14.5bn
18,130 Total outstanding
16,466 Total cover pool
9,256
Total outstanding 5,231
Total cover pool
8,257
4,084
4,044 4,496
NORD/LB Dt. Hypo NORD/LB Dt. Hypo
Other Pfandbriefe/Covered Bonds
as at 31 Mar 2018 Total cover pool: €6.5bn After the merger between NORD/LB and BLB on
5,371 1 Sep 2017 BLB does not have a separate cover pool
Total outstanding
4,339 anymore. Cover pools of NORD/LB and BLB have been
Total cover pool merged and will be published together in der transparency
guidelines for the first time as at 30 Sep 2017.
888
76 283 505
NORD/LB Ship NORD/LB Aircraft NORD/LB CBB
Pfandbriefe Pfandbriefe Lettres de Gage
38Appendix
Pfandbriefe (covered bonds): first class and secure collateral (1/2).
Mortgage Pfandbrief (by building type) Public-Sector Pfandbrief (by debtor)2, 3
as at 31 Mar 2018 Office €5.2bn1 as at 31 Mar 2018 €17.6n1
buildings Commercial Loans acc. To § 20, sec. 2/2 Countries
9% Buildings 3% 8%
7% Industrial
buildings
1% Regional
Other Other
Apartment authorities
commerial 28%
buidings 22%
buildings
48%
13%
Condomi-
niums
5%
One and
two family
Local authorities
houses
39%
17%
Outstandings €4,084.0m Outstandings €16,466.2m
Cover pool total €5,230.9m Cover pool total €18,130.1m
Over-collateralisation €1,146.9m/28.1% Over-collateralisation €1,663.9m/10.1%
Weighted average life of Weighted average life of
3.3 years 6.4 years
outstanding Pfandbriefe4 outstanding Pfandbriefe5
Weighted average life of the Weighted average life of the
6.5 years 7.2 years
cover pool4 cover pool5
1 Nominal value NORD/LB AöR 2 Debtors incl. statutory overcollateralisation 3 94 per cent in Germany 4 Moody‘s Performance Overview, 31 Dec 2017
5 Moody‘s Performance Overview, 31 Mar 2018
39Appendix
Pfandbriefe (covered bonds): first class and secure collateral (2/2).
Ship Pfandbrief (by type) Aircraft Pfandbrief (nach Typ)
as at 31 Mar 2018 Bulker €282.5m1 as at 31 Mar 2018 Widebody €888.0m1
11% 11% Freighter
Others 22%
13% Containers
12% Ultralarge
15%
MPP
17% Turboprop
11% Narrowbody
Tankers 35%
47% Regional Jet
6%
Outstandings €76.1m Outstandings €505.0m
Cover pool total €282.5m Cover pool total €888.0m
Over-collateralisation €206.4m/271.2% Over-collateralisation €383.0m/75.8%
Weighted average life of
0.9 years
outstanding Pfandbriefe 2
Weighted average life of the cover
5.8 years
pool2
1 Nominal value, NORD/LB AöR 2 Moody‘s Performance Overview, 31 Mar 2018
40Appendix
NORD/LB Group - Pfandbriefe at a glance.
Over-
Nominal values as at Cover pool Over- Change of
Outstandings collateralisation
31 Mar 2018 (in €m) total collateralisation outstandings in 20181
in %
NORD/LB AöR
16,466.2 18,130.1 1,663.9 10.1 1,613.6
Public-Sector Pfandbrief
NORD/LB AöR
4,084.0 5,230.9 1,146.9 28.1 2,248.4
Mortgage Pfandbrief
NORD/LB AöR
76.1 282.5 206.4 271.2 -3.9
Ship Pfandbrief
NORD/LB AöR
505.0 888.0 383.0 75.8 -501.0
Aircraft Pfandbrief
Deutsche Hypo
4,043.8 4,496.3 452.5 11.2 -1,078.3
Public-Sector Pfandbrief
Deutsche Hypo
8,257.2 9,255.7 998.5 12.1 -104.1
Mortgage Pfandbrief
NORD/LB Luxembourg
4,338.9 5,371.0 1,032.2 23.8 144.1
Lettres de Gage Publique
Total 37,771.2 43,654.5 5,883.4 2,318.8
1 Outstandings 31 Mar 2017 versus 31 Mar 2018
41Appendix
Institutional protection and deposit guarantee schemes of NORD/LB.
Legal responsibility
Basic protective measures to avoid bankruptcy
Capital requirements The Capital Requirements Regulation (CRR , “Kapitaladäquanzverordnung”) is a EU
regulation in banking containing requirements for capital adequacy under Basel III
Institutional Protection Scheme of the Savings Banks Finance Group was founded
in the 1970s
Institutional Protection Scheme Since July 2015 the Institutional Protection Scheme is recognised as a deposit
of the Savings Banks Finance Group guarantee scheme under Germany’s Deposit Guarantee Act (EinSiG)
13 guarantee funds: of the Landesbanken (1), of the regional savings banks (11) and of
the building associations (1)
Bail-in of shareholders and creditors
− Equity: Tier 1, AT 1, Tier 2, subordinated capital
German Act on the Recovery and − Liabilities: Senior unsecured and other (structured) liabilities
Resolution of Credit Institutions Excluded: i.a. deposits (under Deposit Guarantee Act: up to 100,000€/person), covered
bonds as well as money market instruments
The Single Resolution Mechanism (SRM) is augmented by the Single Resolution Fund
(SRF), which can provide the financial resources needed for resolution.
European Scheme European deposit guarantee scheme: The German banking industry defeats the
proposed regulations of the EU commission. There is a compromise proposal from the
EU parliament. But it is still quite uncertain, whether this proposal will come into effect.
42Appendix
Important links.
Declaration of Norddeutsche Landesbank Girozentrale on the German Corporate Governance Codex:
www.nordlb.com/legal-information/legal-notices/corporate-governance/
NORD/LB protection scheme
www.nordlb.com/legal-information/legal-notices/security-mechanisms/
Sustainability (report, ratings)
www.nordlb.com/nordlb/sustainability/
NORD/LB supervisory board
www.nordlb.com/nordlb/investor-relations/committees-and-executive-bodies/
NORD/LB Annual, Interim Reports and Disclosure Reports
www.nordlb.com/reports
43Contact.
NORD/LB Gabriele Bödeker (Head of Investor Relations)
Norddeutsche Landesbank Girozentrale gabriele.boedeker@nordlb.de
Investor Relations Tel.: ++49 511 361-4338
Georgsplatz 1
30159 Hanover, Germany
Thomas Breit
thomas.breit@nordlb.de
ir@nordlb.de
Tel.: ++49 511 361-5382
www.nordlb.de/www.nordlb.com
Marcel Mock, CIIA, CEFA
marcel.mock@nordlb.de
Tel.: ++49 511 361-8914
Svenja Pohlmann
svenja.pohlmann@nordlb.de
Tel.: ++49 511 361-4683
Bitte hier
Ihr Foto
einfügen
44Disclaimer.
This presentation and the information contained herein, as well as any The foregoing factors should not be construed as exhaustive. Due to such
additional documents and explanations (together the “material“), are issued by uncertainties and risks, readers are cautioned not to place undue reliance on
NORDDEUTSCHE LANDESBANK GIROZENTRALE (“NORD/LB”). such forward-looking statements as a prediction of actual results. All forward-
looking statements included herein are based on information available to
NORD/LB as of the date hereof. NORD/LB undertakes no obligation to update
This presentation contains certain forward-looking statements and forecasts publicly or revise any forward-looking statement, whether as a result of new
reflecting NORD/LB management’s current views with respect to certain future information, future events or otherwise, except as may be required by
events. These forward-looking statements include, but are not limited to, all applicable law. All subsequent written and oral forward-looking statements
statements other than statements of historical facts, including, without, attributable to NORD/LB or persons acting on our behalf are expressly qualified
limitation, those regarding NORD/LB’s future financial position and results of in their entirety by these cautionary statements.
operations, strategy, plans, objectives, goals and targets and future
developments in the markets where NORD/LB participates or is seeking to
participate. The NORD/LB Group’s ability to achieve its projected results is The material is provided to you for informational purposes only, and NORD/LB is
dependent on many factors which are outside management’s control. Actual not soliciting any action based upon it. The material is not intended as, shall not
results may differ materially from (and be more negative than) those projected be construed as and does not constitute, an offer or solicitation for the
or implied in the forward-looking statements. Such forward-looking information purchase or sale of any security or other financial instrument or financial service
involves risks and uncertainties that could significantly affect expected results of NORD/LB or of any other entity. Any offer of securities, other financial
and is based on certain key assumptions. The following important factors could instruments or financial services would be made pursuant to offering materials
cause the Group’s actual results to differ materially from those projected or to which prospective investors would be referred. Any information contained in
implied in any forward-looking statements: the material does not purport to be complete and is subject to the same
– the impact of regulatory decisions and changes in the regulatory qualifications and assumptions, and should be considered by investors only in
environment; light of the same warnings, lack of assurances and representations and other
precautionary matters, as disclosed in the definitive offering materials. The
– the impact of political and economic developments in Germany information herein supersedes any prior versions hereof and will be deemed to
and other countries in which the Group operates; be superseded by any subsequent versions, including any offering materials.
– the impact of fluctuations in currency exchange and interest NORD/LB is not obliged to update or periodically review the material. All
rates; and information in the material is expressed as at the date indicated in the material
and is subject to changes at any time without the necessity of prior notice or
– the Group’s ability to achieve the expected return on the other publication of such changes to be given. The material is intended for the
investments and capital expenditures it has made in Germany information of NORD/LB´s institutional clients only. The information contained
and in foreign countries. in the material should not be relied on by any person.
45Disclaimer.
In the United Kingdom this communication is being issued only to, and is Neither the material nor any part thereof may be reproduced, distributed,
directed only at, intermediate customers and market counterparties for the passed on, or otherwise divulged directly or indirectly by the party that receives
purposes of the Financial Services Authority’s Rules ("relevant persons"). This it, to any other person without the prior written consent of NORD/LB.
communication must not be acted on or relied on by persons who are not
relevant persons. To the extent that this communication can be interpreted as
relating to any investment or investment activity then such investment or The distribution of the material in certain jurisdictions may be restricted by law
activity is available only to relevant persons and will be engaged in only with and persons into whose possession the material comes are required by
relevant persons. NORD/LB to inform themselves about, and to observe, any such restrictions.
Viewing the following material involves no obligation or commitment of any
kind by any person. Viewers of he following material are not to construe This presentation does not constitute an offer to sell or the solicitation of an
information contained in it as a recommendation that an investment is a offer to purchase or subscribe for any securities of NORD/LB in the United
suitable investment or that any recipient should take any action, such as making States. No part of this presentation should form the basis of or be relied upon in
or selling an investment, or that any recipient should refrain from taking any connection with any investment decision or any contract or commitment to
action. Prior to making an investment decision, investors should conduct such purchase or subscribe for any securities of NORD/LB. Any offering of securities
investigations as they consider necessary to verify information contained in the to be made in the United States will be made by means of a prospectus that
relevant offering materials and to determine whether the relevant investment may be obtained from NORD/LB and will contain detailed information about
is appropriate and suitable for them. In addition, investors should consult their NORD/LB, its management and its financial statements. None of NORD/LB’s
own legal, accounting and tax advisers in order to determine the consequences securities may be offered or sold in the United States, without registration
of such investment and to make an independent evaluation of such investment. under the U.S. Securities Act of 1993, as amended, or pursuant to an exemption
Opinions expressed in the material are NORD/LB´s present opinions only. The from registration therefrom.
material is based upon information that NORD/LB considers reliable, but
NORD/LB does not represent, guarantee, or warrant, expressly or implicitly,
that the material or any part of it is valid, accurate or complete (or that any By viewing the following material, the recipient acknowledges, and agrees to
assumptions, data or projections underlying any estimates or projections abide by, the aforementioned.
contained in the material are valid, accurate or complete), or suitable for any
particular purpose, and it should not be relied upon as such. NORD/LB accepts
no liability or responsibility to any person with respect to, or arising directly or
indirectly out of the contents of or any omissions from the material or any other
written or oral communication transmitted to the recipient by NORD/LB.
46You can also read