No. 1104 2020 - Banco de la República
←
→
Page content transcription
If your browser does not render page correctly, please read the page content below
Minimum wage effects on informality
 across demographic groups in
 Colombia

 By: Luis E. Arango
 Luz A. Flórez
 Laura D. Guerrero

 No. 1104
 2020

Bogotá - Colombia - B ogotá - Bogotá - Colombia - Bogotá - Colombia - Bogotá - Colombia - Bogotá - Colombia - Bogotá - Colombia - Bogotá - Colombia
Minimum wage effects on informality across
 demographic groups in Colombia

 Luis E. Arango Luz A. Flórez* Laura D. Guerrero♥
 Banco de la República Banco de la República Banco de la República
 larangth@banrep.gov.co lflorefl@banrep.gov.co lguerreros@javeriana.edu.co

 The opinions expressed here are not necessarily those of neither the Banco de la República
 nor its Board of Directors

 Abstract
 We present evidence of the minimum wage effects on labour informality rates in Colombia. Our
 identification strategy consists of dividing the working population into sixteen groups depending on their
 age, gender and educational level to observe how the variations in the minimum wage with respect to the
 70th percentile of the distribution of salaries corresponding to the demographic group of each individual,
 affects the probability of having an informal occupation. The results suggest that the higher the value of
 the minimum wage ratio the higher will be the probability of being informal. An increase of one percentage
 point (pp) in the ratio of the minimum wage increases the probability of having an informal job by 0.21 pp.
 This effect may be greater in cities with higher informality rates and consequently with lower labour
 productivity of less educated workers. Our results also present evidence of non-linear effects, which
 suggests that workers whose labour productivity is less than the minimum wage are more likely to have
 informal jobs.

JEL Classification: J21, J30, J46, O17.
Key words: minimum wage, labour informality, heterogeneity.

*
 The series Borradores de Economía is published by the Research Unit of Banco de la República (the Central Bank of
Colombia). The documents published are provisional, and their authors are fully responsible for the opinions expressed in
them, as well as for possible mistakes. The contents of the works published do not compromise Banco de la República or its
Board of Directors. Research assistance of Nataly Andrea Pedraza Jiménez and Daniel José Rueda Lobato.
♥
 Student of the Universidad Javeriana in internship at Banco de la República.
Efectos del salario mínimo en la informalidad de
 diferentes grupos demográficos en Colombia

 Luis E. Arango Luz A. Flórez Laura D. Guerrero
 Banco de la República Banco de la República Banco de la República
 larangth@banrep.gopv.co lflorefl@banrep.gov.co lguerreros@javeriana.edu.co

 Las opiniones contenidas en el presente documento son responsabilidad exclusiva de los
 autores y no comprometen al Banco de la República ni a su Junta Directiva.

 Resumen
 En este documento presentamos evidencia de las implicaciones del salario mínimo en la informalidad
 laboral. Nuestra estrategia de identificación consiste en dividir la población trabajadora en dieciséis
 grupos dependiendo de su edad, género y nivel educativo para observar cómo las variaciones del salario
 mínimo con respecto al percentil 70 de la distribución de salarios correspondiente al grupo demográfico
 de cada individuo, afecta su probabilidad de tener una ocupación informal. Los resultados sugieren que a
 mayor valor de la razón del salario mínimo más alta será la probabilidad de ser informal. Un incremento
 de un punto porcentual (pp) en la razón del salario mínimo incrementa la probabilidad de tener un empleo
 informal en 0.21 pp. Este efecto puede ser mayor en ciudades con mayor tasa de informalidad y en
 consecuencia con menor productividad laboral de aquellos trabajadores menos educados. Finalmente,
 nuestros resultados presentan evidencia de efectos no lineales, lo cual sugiere que aquellos trabajadores
 cuya productividad laboral es muy baja con respecto al salario mínimo, tienen una mayor probabilidad de
 tener trabajos informales.

Clasificación JEL: J21, J30, J46, O17
Palabras claves: salario mínimo, informalidad laboral, heterogeneidad.
2

1. Introduction

The effectiveness of the minimum wage to provide protection to the low-skilled workers is not neat.
While there is no clear evidence on the impact of the minimum wage on employment,1 various
researchers have shown that it does have adverse effects on levels of labour informality2 (see, among
many others, Maloney, 2004; Andalon and Pagés, 2008; Arango & Flórez, 2017). In the case of
Colombia, the most negative effect of the minimum wage given the first impulse to destroy formal
employment, more than on the structural or the observed unemployment rates (Arango & Flórez, 2018)
seems to be on incentives to create informal jobs (Mondragón, Peña, & Wills, 2010; Arango & Flórez,
2017).
 According to the information of the Administrative Department of Statistics (Departamento
Administrativo Nacional de Estadística; Dane, 2018), the proportion of informal workers in 23 cities and
metropolitan areas was 48.4% in the last quarter of 2018. Thus, this phenomenon seems to be more
challenging in Colombia than in other similar countries such as Mexico, Chile, Argentina and Brazil
(ILO, 2019). High levels of informality have negative effects on welfare, income distribution, human
and physical capital accumulation, long-run growth, and public finance (Goñi, 2013). Thus, it is vital to
understand the structural and cyclical causes of this economic phenomenon in order to create effective
public policies to reduce the number of informal workers in the country.
 The high labour informality rate in Colombia is a complex problem with different causes mentioned
in the literature (see for example, Uribe, 2016; Fernández and Villar, 2016). Arango & Flórez (2017)
provided evidence that one of the main determinants of labour informality is the higher level of the
minimum wage in comparison to the labour productivity of low skilled workers or other wages of the
economy such as the median or the 70th percentile of the wage distribution.3 In fact, the Kaitz ratio in
Colombia, that is, the ratio of the minimum wage to the median wage, is much higher (over 85 per cent)
than the average for all OECD countries (52 per cent) (see Dube, 2104 and Arango and Flórez, 2017).
Thus, the higher the distance between the minimum wage and the labour productivity of less skilled
workers, the closer will be them of being fired and then pushed to the informal or uncovered sector.
 The objective of this document is to provide evidence of the effects of the minimum wage with respect
to the 70th percentile wage of salaried workers, on the probability of being informal for a worker
belonging to a particular demographic group. To verify our hypothesis we follow the strategy of Lotti,
Messina, and Nunziata (2016), which consists in exploiting the relative level of restrictiveness of the
minimum wage legislation in different demographic groups within cities across time. This approach
might be useful since each group enters in different labour market segments; therefore, the effect of the

1
 With respect to the employment effects of the minimum wage, the recent academic discussions show no clear cut on this
dimension. See among many others Card (1992a, 1992b), Card and Krueger (1994, 1995), Neumark and Wascher (2000,
2008), Doucouliagos and Stanley (2009), De Linde Leonard, Stanley and Doucouliagos (2014), Belmand and Woflson (2014)
and Neumark (2018).
2
 According to the International Labor Organization – ILO (2002), informal workers are more vulnerable, as they receive little
or no legal or social protection at all. Moreover, they usually lack good job opportunities, job stability, and easy access to
education to acquire greater skills.
3
 Some theoretical (Flórez, 2015, 2017) and empirical models use the productivity level to explain labour informality
(Maloney, 2004 and Perry, 2007, among others) and its different types such as subsistence informality, induced informality,
voluntary and mixed informality (Fernández & Villar, 2016).
minimum wage can also be differential by groups. For example, for some groups such as non-educated
young males or females, the minimum wage policy maybe more binding and therefore the effect on
informality may be relatively stronger. The main identification assumption is that the magnitude of the
minimum wage variation is an exogenous variable –regardless whether it takes place every year by
December-. Moreover, since we use the relation of the minimum wage to the 70th percentile, it is crucial
that the change in the minimum wage does not affect the shape of the underlying wage distribution in the
vicinity of the 70th percentile of each group (see Lee, 1999; Lotti et al., 2016). If this assumption is
satisfied, estimates of the parameter of interest will be less biased, because they will capture the
exogenous change of the minimum wage. However, in this document, we provide evidence that this
assumption does not hold for the case of Colombia so that we need to modify the empirical specification
used to check the hypothesis, therefore we use lags of minimum wage ratio.
 We use quarterly information of the household surveys Great Integrated Household Survey (Gran
Encuesta Integrada de Hogares, GEIH its Spanish acronym) from 2007 to 2017, and consider 16 labour
market groups by cities. They are obtained by interacting gender with four age ranges (18 to 25, 26 to
40, 41 to 50 and 51 to 65 years old) and two levels of education (educated and uneducated). Evidence
shows that the increases of the ratio of minimum wage to the 70th percentile of salaried workers, increase
the probability that a worker has an informal occupation. This finding is robust for different specifications
that include different controls. In particular, an increase of one percentage point (pp) in the minimum
wage ratio increase probability by 0.208 pp.
 The article is organized in five sections. Section 2 presents a short discussion of the findings presented
in the literature focusing on the results for the case of developing countries as well as evidence on labour
informality in Colombia. Section 3 describes the data and the labour market groups studied in this paper.
Section 4 presents the empirical framework and the results. Finally, section 5 summarizes the main
findings and discusses some policy implications.

2. Related literature and facts

The analysis of the effects of the minimum wage assumes a two productive sectors economy, which
serves to frame our analysis. The sector which complies with all labour regulations is called “covered or
formal sector” while the other sector that does not comply with the existing norms and provisions. We
call the latter "uncovered or informal sector". If, for example, one of such norms stipulates the payment
of the minimum wage, there will be some firms that do so and others that do not. The latter corresponds
to the uncovered sector (Welch, 1974; Mincer, 1976). Thus, one might expect that some workers, who
lose their jobs in the covered sector due to the introduction or the increase of a binding minimum wage,
will be absorbed by the uncovered sector thus reducing the average earnings of workers in the latter. Low
productivity workers who are looking for a job in the formal sector, will find it more difficult as long as
the minimum wage is higher. Consequently, this model considers informality as a state of exclusion.
 The effects of the minimum wage on the level of employment, has been broadly discussed in
developed countries where informality is not that important (see Neumark and Wascher, 2008, chapter
3; Card, 1992a and 1992b, and Card and Krueger, 1994 and 1995). According to Neumark (2018, p.4)
the minimum wage has adverse effects on employment. Meta-analyses conducted by Doucouliagos and
Stanley (2009), on the other hand, found a negligible effect of the minimum wage on teenage employment
in the US. In the same fashion De Linde Leonard, Stanley and Doucouliagos (2014) report no significant
effect of the minimum wage on employment for the UK either. Along the same lines Belman and Wolfson
(2014, chapter 4). Cenzig, Dube, Lindner and Zipperer (2018) also find negligible effects on jobs.
 There is, however, evidence that the minimum wage produces higher levels of labour informality in
developing economies. Andalon and Pagés (2008) found negative impacts of the minimum wage
legislation on formal employment as well as an increase in informality in Kenya. These authors report a
higher impact on those workers whose wage is closer to the minimum. Thus, given an increase in the
minimum wage, employers tend to replace workers with low qualification by those slightly more
qualified. Lemos (2009) studies the case of Brazil and finds no evidence of employment effects in neither
formal nor informal sector; instead, she found a wage compression effect in both sectors. Millea et al.
(2017) evaluate the effect of the sectoral minimum wage legislation introduced in 2002 in South Africa.
Their results do not suggest negative effects on formal employment for any demographic group covered
by the regulation, although they do for informal workers. According to Broecke, Forti, and Vandeweyer
(2017) the average effects found on employment for some developing countries are not that large
although, in general there is evidence of important negative effects for the most vulnerable groups such
as young and low-skilled workers, as well as important effects on informal employment. Ham (2018)
analyses the legislation change in Honduras to analyse effects of the minimum wage across regions,
industries and firm’s size. He finds that an increase in the minimum wage of 10 percent decreases the
probability of having a job in the formal sector by 8 percent, while the probability of having a job in the
informal sector increases by 5 percent. Finally, Lotti et al. (2016) present evidence for 59 developing
countries of a positive and significant relation between a high level of the minimum wage –with respect
to wage at the 70th percentile of the wage distribution– and the high level of informality. Their results
show that a one pp increase in the minimum wage ratio is associated with a 0.204 pp increase in the
informality, measure used as “self-employment rate.”4
 In Colombia, informality characterizes legal activities that do not comply with requirements
established in in the Labour Code (Código Sustantivo del Trabajo, in Spanish). The definition of
informality used in this paper follows the official definition used by the Dane called “informality rate by
firm’s size”. According to this measure, a job is regarded as informal when it corresponds to a firm with
a maximum of five employees (comprising all plants), including the employer.5 Apart from these
workers, this measure also includes family workers without payment, domestic workers, self-
employment workers (except those with a bachelor degree) and employers. Other measures of labour
informality are based on workers who do not contribute to the social security (pension and health
systems), those who receive a payment below the minimum wage or those who work a number of hours
greater than the legally established (Castells, Portes, & Benton, 1989; ILO, 1972; Mondragón, Peña, &
Wills, 2013).
 Colombia has a very long tradition of being a country with a high and persistent labour informality
rate (see ILO, 2019).6 Figure 1 presents the evolution of labour informality in Colombia between 2007

4
 The authors define informality as the share of self-employed and family workers, who are by definition not covered by
minimum wage legislation. This measure excludes those who work in agriculture sector.
5
 Ten workers until 2009.
6
 See for example: https://www.ilo.org/americas/programas-y-proyectos/WCMS_614453/lang--es/index.htm.
and 2017 as the ratio of informal workers to the occupied labour force.7 Even though, it shows a declining
trend, at the end of 2017, 52.6 percent of workers were informal, according to the firm’s size definition
and 48.4 percent according to the affiliation failure to the pension and health system definition.
 The declining trend of the informality rates have been achieved not only thanks to the economic
growth during this period, but also to the important effort of the government in the implementation of
the 2012 tax reform, which reduced the non-wage labour cost around 13.5 pp from about 55.6 percent to
41.8 percent. Even though it is difficult to know with precision how many formal jobs were created,
some recent research (Bernal, Eslava, Meléndez, & Pinzón, 2017; Fernández & Villar, 2017; Morales &
Medina, 2016; Osorio, 2016), suggests that such reform allowed the creation of between 200.000 and
600.000 formal jobs.
 Figure 1. Informality rate in Colombia
 65%

 60%

 55%

 50%

 45%
 Mar-2007

 Mar-2008

 Mar-2009

 Mar-2010

 Mar-2011

 Mar-2012

 Mar-2013

 Mar-2014

 Mar-2015

 Mar-2016

 Mar-2017
 Social security affiliation Firm size

 Source: DANE; authors’ calculations.

 Figure 2 shows informality rates by groups corresponding to 23 cities. Panel A of the figure shows
the rate of educated and non-educates workers, defining as educated those “with at least 15 years of
education”. At this stage of schooling, a worker is supposed to hold a technology degree or to be close
to achieve a bachelor degree. Labour informality of educated workers was, on average, 16.4 percent in
2017 while for non-educated workers, it was 56.5 percent. Panel B of Figure 2, shows the informality
rate by age of workers. The highest levels of informality correspond to the oldest; in fact, workers with
age between 51 and 60 years old exhibit a 63.4 percent of informality rate while those aged between 51
and 50 years old reports a 53.5 percent rate, on average, in 2017. Panel C shows the informality rate by
gender. During the sample period, the average rate corresponding to women was higher that men’s by
more than five pp.
 The hypothesis that there is a correlation between the minimum wage and labour informality in
Colombia is far from new (see Maloney, 2004). However, the evidence of a relationship between these
two variables in Colombia is rather limited. Mora and Muro (2017), using a dynamic pseudo panel
approach, find that an increase in the minimum wage result in an increase in informality. Arango &
Flórez (2017) also find a positive effect of minimum wage on the level of informality using a panel data

7
 The term “occupied” is used to include both workers employed in the formal sector and those working as informal workers;
this is so since an important fraction of informal workers is self-employed. These are not employees in the usual sense.
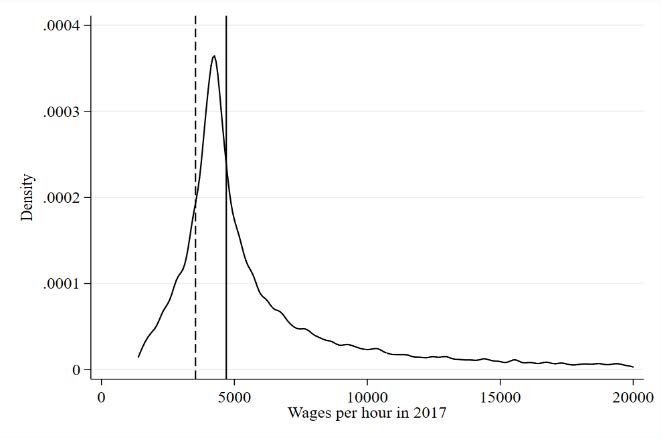
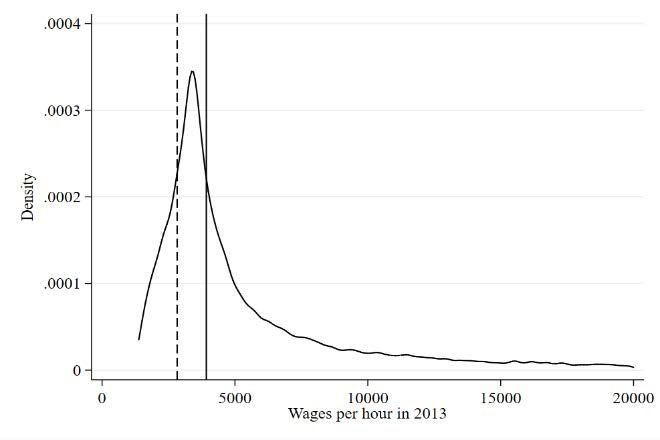
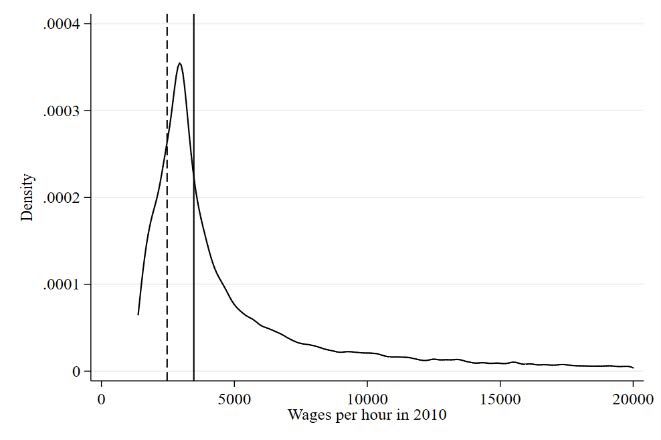
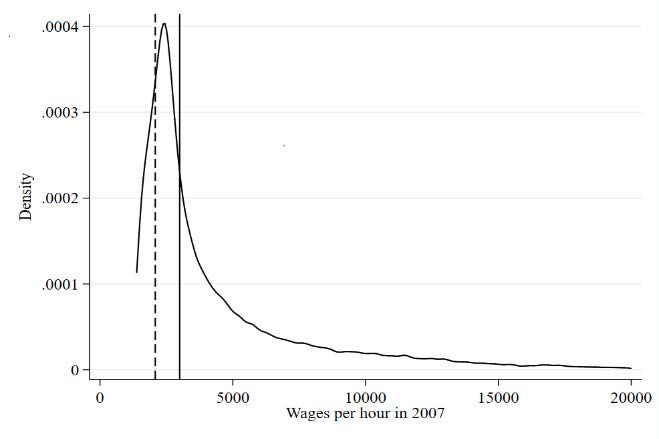
approach of 23 main cities in Colombia. This approach exploits the variation of the minimum wage ratio
across cities. The authors show that an increase of one pp in the relation between minimum wage and
wage at 70th percentile increases the informality rate on 0.1430 pp on average. These authors also find
an important heterogeneity effect among the 23 main cities. For example, the effects of the minimum
wage is higher in cities such as Ibagué, Neiva, and Florencia.
 Figure 3 shows the behaviour of the minimum wage during the past two decades. Deflated with either
the PPI or CPI for low-income people, the minimum wage exhibits a positive and steep trend. In average,
between 2000 and 2017, it increased about 1.1 percent or 1.8 percent when it is deflated with the PPI.
These numbers should imply an important increase in labour productivity; nevertheless, this conjecture
is hard to prove.
 Figure 4 shows the kernel distributions of real hourly wage of salaried workers for 2007, 2010, 2013
and 2017. There are some facts worth noticing here. In first place, during these years both the minimum
and the median wage increased. This coincidence of movements casts some doubts on the assumption
that the wage distribution is not affected by the minimum wage. Second, the positive skewness of the
distributions have been reducing slowly over the years while the tails of the kernels are getting more
platykurtic. As a result, the density behaves better in 2017 than 2007. We shall use this fact to refine the
identifying assumptions of the approach we follow.

 Figure 2. Labour informality rate by groups
 A. By education B. By age
 75%
 75%
 60%
 60%
 45%
 45%

 30% 30%

 15% 15%

 0% 0%
 Mar-2007

 Mar-2008

 Mar-2009

 Mar-2010

 Mar-2011

 Mar-2012

 Mar-2013

 Mar-2014

 Mar-2015

 Mar-2016

 Mar-2017

 Mar-2007

 Mar-2008

 Mar-2010

 Mar-2011

 Mar-2012

 Mar-2013

 Mar-2014

 Mar-2015

 Mar-2017
 Mar-2009

 Mar-2016

 Educated Non educated 18-25 26-40 41-50 51-65

 C. By sex
 75%

 60%

 45%

 30%

 15%

 0%
 Mar-2007

 Mar-2009

 Mar-2010

 Mar-2011

 Mar-2012

 Mar-2013

 Mar-2014

 Mar-2015

 Mar-2016

 Mar-2017
 Mar-2008

 Women Men

 Source: DANE; authors’ calculations
Figure 3. Real minimum wage

 135%

 125%

 115%

 105%

 95%
 Dec-00

 Dec-01

 Dec-04

 Dec-06

 Dec-07

 Dec-09

 Dec-10

 Dec-11

 Dec-12

 Dec-13

 Dec-14

 Dec-16

 Dec-17
 Dec-02

 Dec-03

 Dec-05

 Dec-08

 Dec-15
 Low-income CPI PPI

 Source: Ministry of labour; DANE; authors’ calculations

 Figure 4. Wage kernels and location of the minimum wage
 A. 2007 B. 2010

 C. 2013 D. 2017

Note: the vertical continuous line represents the median wage the vertical dashed line is the minimum wage. Source: DANE;
authors’ calculations
As we will see below, our identification strategy follows the one used by Lotti et al. (2016). The
authors exploit the relative of strictness in minimum wages across labour market groups within the
countries of the sample. The idea is that for some groups, the minimum wage is more binding and,
therefore, the effect on informality is relatively stronger. In other words, it is possible that for those
groups the labour productivity is lower than the level of the minimum wage.
 The advantage of our study, compared to Lotti’s et al. (2016) is that it focuses on a single country,
Colombia, hence the household surveys we utilize are homogenous across urban areas. However, our
sample consists of 23 cities and metropolitan areas, which is smaller compared to their sample of 59
different countries.

3. Data description and empirical approach
To estimate the effect of the minimum wage for the case of Colombia we use the GEIH published by the
Dane, from 2007 to 2017 for the 23 main cities in Colombia on a monthly basis. These cities are Armenia,
Barranquilla, Bucaramanga, Bogotá, Cali, Cartagena, Cúcuta, Florencia, Ibagué, Medellín, Manizales,
Montería, Neiva, Popayán, Pasto, Pereira, Quibdó, Riohacha, Santa Marta, Sincelejo, Tunja, Valledupar
and Villavicencio. Figure 6 below shows the physical distribution of cities across the country.
 We split the population of each city into sixteen groups. These are obtained dividing population by
sex, age (18 to 25, 26 to 40, 41 to 50 and 51 to 65 years old) and two levels of education (educated and
no educated). We define educated individuals as those with 15 or more years of education. In the rest of
the paper, we will use the definition of informality by firm’s size.
 One crucial aspect of this methodology is the definition of these labour market groups. The reason is
that there is a trade-off between having a large number of cells (of each group) with few individuals per
cell (group) and a smaller number of cells with more individuals. A representative sample of each group
is required to produce precise estimates of the minimum wage ratio. Thus, to eliminate any possible bias
we disregard all possible cell sizes lower than 100 individuals (Verbeek & Nijman, 1992, 1993). In
addition, we use two minimum wage ratios for each demographic group. The first one is the ratio of
minimum wage to the 70th percentile of wages where the two variables (the minimum wage and the 70th
percentile) correspond to a basic measure without including additional benefits such as payments for
holidays, bonuses, payments in kind, among others. The second minimum wage ratio includes such
additional benefits.8
 The first two columns of Table 1 present the composition of all workers (23 cities) by different
demographic characteristics. Column (1) presents the composition for the period 2007-2010 and the
second one for the period 2011-2017. The sample has been divided to observe possible changes once the
informality rate started to decrease according to the firm’s size definition (see Figure 1). In general, we
can observe that, for the two periods, the higher proportion of occupied workers corresponds to non-
educated women (14 percent) and men (17 percent) between 26 and 40 years old. The second proportion
corresponds to non-educated men (10 percent) and women (9 percent) between 51 and 65 years old. For

8
 We leave aside the non-salaried workers, under the assumption that the movements of the minimum wage will affect the
distribution of earnings of informal workers.
the sub-period 2011-2017, the proportions of occupied educated women between 18 and 25, 26 and 40,
and between 41 and 50 years old, are slightly higher than the proportion of occupied educated men.
 Columns (3) and (4) of Table 1, present the unconditional probability of being informal worker for
each group. As we can observe there is a higher probability of being informal among non-educated
workers, with a higher probability in the case of women. For example, in the last period, non-educated
women between 51 and 65 years old have 80 percent probability of being informal, while for the case of
men in the same group of education and age, this probability is around 69 percent. Furthermore, educated
men have a higher probability of being informal for all groups than women while in the case of non-
educated workers the situation reverses: women have a higher probability of being informal.

 Table 1. Composition and probability of being informal
 Composition of occupied workers Probability of being informal Average minimum wage ratios
 Group MW ratio for MW plus benefits
 2007-2010 2011-2017 2007-2010 2011-2017
 salaried ratio for salaried
 Age (1) (2) (3) (4) (5) (6)
 Educated women
 18-25 years old 0.99% 1.21% 16.0% 15.6% 0.444 0.479
 26-40 4.47% 4.97% 14.0% 13.2% 0.270 0.285
 41-50 2.13% 1.95% 18.8% 17.7% 0.200 0.207
 51-65 1.09% 1.32% 20.2% 22.4% 0.168 0.175
 Non educated women
 18-25 6.63% 6.38% 50.5% 46.3% 0.865 0.888
 26-40 14.07% 13.29% 59.3% 54.9% 0.812 0.807
 41-50 8.67% 8.12% 70.0% 68.4% 0.796 0.788
 51-65 5.28% 6.69% 80.2% 80.1% 0.737 0.744
 Educated men
 18-25 years old 0.76% 0.91% 16.3% 16.6% 0.431 0.454
 26-40 4.13% 4.31% 15.8% 13.9% 0.241 0.251
 41-50 2.25% 1.91% 19.4% 19.1% 0.170 0.175
 51-65 1.65% 1.73% 23.4% 22.4% 0.146 0.151
 Non educated men
 18-25 8.63% 8.46% 45.8% 43.1% 0.853 0.886
 26-40 17.71% 16.58% 48.8% 44.5% 0.732 0.736
 41-50 9.89% 9.04% 61.5% 57.9% 0.687 0.697
 51-65 7.15% 8.13% 71.6% 68.7% 0.678 0.695
 Source: DANE; authors’ calculations.

 Table 1 also shows the value of the minimum wage ratio with and without other benefits. In any case,
both ratios are higher for women than for men but the difference is greater for people older than 25 years
old for whom the probability of being informal is higher according to columns (3) and (4).
 Figure 5 presents the kernel distribution of the minimum wage ratio across groups (left column) and
the kernel of the standardised distribution (right column). Panel A shows the kernel density by age
groups. As expected, for young workers (18-25 years old) the minimum wage is more binding compared
to the older workers. Panel B presents the kernel distribution by gender where, apart from the higher
skewness of the women’s, the level of bindingness of the minimum wage ratio of women seems higher
than that of men. In other words, the minimum wage ratio is higher for women than for men. Finally,
panel C presents the differences across levels of education. In this case, the minimum wage ratio is far
more restrictive for the case of the less educated workers.
One of our most important identification assumptions is that the (variation of the) minimum wage
level does not affect the shape of the underlying wage distribution in the vicinity of the 70th percentile of
each group (see Lee, 1999; Lotti et al., 2016). Thus, to verify whether this assumption is valid or not, we
run a fixed-effects panel given by , 70 ℎ
 = + , + , + , , where , 70 ℎ
 is the wage at the
70th percentile in city in period , , the real minimum wage in city in period , , the
unemployment rate in city in period , and, finally , is the error term. The null hypothesis that
validates our approach corresponds to : = 0. The unemployment rate of city is included in the
specification to control for some other cyclical variation [see Blanchflower y Oswald (1994)] that might
affect the variation in the ,
 70 ℎ
 .
 Figure 5. Kernel distribution of the minimum wage ratio by demographic groups
 Minimum wage ratio Standardized minimum wage ratio
 A. Age

 B. Gender

 C. At least 15 years of schooling

Note: Kernel density estimation of the deviation of minimum wage ratios by group of each city with respect to the average of 23 cities. Kernel density
distribution by group was estimated on the averages of the minimum wage ratios of each city in each quarter. The minimum wage ratios were
standardized by using the average and standard deviation of each group over the total sample. Source: DANE; authors’ calculations.
The estimates of different specifications of the model are shown in Table 2. Columns (1) uses the
level of the 70th percentile while column (2) predicts the logarithm of the wage at the 70th percentile. In
these two cases, the annual variation of the minimum wage is not significant. However, once the model
is used to predict the annual variation of the wage at the 70th percentile, the evidence is different. In fact,
results in column (3) provide evidence that the minimum wage variation affect the variation of the wage
at 70th percentile. Moreover, when the lag of the annual variation of the minimum wage is included into
the model, the variation of the 70th percentile also responds to that variable. In consequence, the null
correlation between the minimum wage and the 70th percentiles cannot be taken for granted, thus we
have to modify the model as we will explain next.

 Table 2. Relationship of the minimum wage and the wage at the 70 th percentile of the distribution
 Log (Wage Annual variation Annual variation Annual variation of Annual variation
 Wage at 70th
 at 70th of wage at 70th of wage at 70th wage at 70th of wage at 70th
 Variables percentile
 percentile) percentile percentile percentile percentile
 (1) (2) (3) (4) (5) (6)
Annual variation of the hourly
 4.9063 0.0011 0.4083*** -0.1754 0.4197*** -0.1748
MW
 (5.4138) (0.0012) (0.1454) (0.2381) (0.1472) (0.2383)
Lagged annual variation of the
 0.7623*** 0.7642***
hourly MW
 (0.2443) (0.2448)
Annual variation of the
 -4.8775 -0.0015 -0.0561 0.0782 0.0360 0.0992
unemployment rate
 (5.4135) (0.0012) (0.1454) (0.1511) (0.1980) (0.1996)
Lagged annual variation of the
 -0.0599 -0.0312
unemployment rate
 (0.1918) (0.1937)
Constant 4,502.68*** 8.4058*** 0.2146 -0.0537 0.1668 -0.0598
 (11.3536) (0.0025) (0.3049) (0.3123) (0.3115) (0.3148)

Observations 840 840 840 817 827 817
R2 0.0019 0.0028 0.0097 0.0220 0.0101 0.0220
Number of cities 23 23 23 23 23 23
 Note: standard errors in parentheses. *** p
market group on the probability of having an informal occupation. Notice that this empirical model,
corresponds –in general- to the frame of Welch’s (1974) schedule.
 Notice that specification corresponding to expression (1) uses the lagged value of the minimum wage
ratio instead of the contemporaneous ratio used by Lotti et al. (2016). In first place, this timing of the
variable allows us to mitigate any endogeneity of the minimum wage ratio of which evidence was
provided in Table 2. In second place, it also allows at least a period to pass the information of the ratio
to the labour market.10
 Our identification strategy exploits the variation of the difference level of strictness of the minimum
wage among different labour market groups. Therefore, certain labour market groups may be affected by
stronger rigidities and then respond in a different way to the minimum wage policy. Thus, the impact on
labour informality levels may be higher in labour market groups whose wage is closer to the minimum
wage. All the specifications cluster the standard errors at the group level to avoid over-stating the
precision of the estimates (see Lotti et al., 2016; Colin Cameron & Miller, 2015).
 The labour market groups are chosen with the aim of having homogeneous individuals within each
cell, to minimize the variance of the measurement error when calculating the average minimum wage’s
stringency across groups, but also there should be sufficient heterogeneity allowing enough variation in
order to obtain more precise estimates of the parameter of interest. Thus, the definition of the number of
labour market groups implies a trade-off. As stated above, we consider 16 groups.11 To eliminate any
possible bias we eliminate all possible cell size lower than 100 individuals (Verbeek & Nijman, 1992,
1993).

4. Results

Table 3 shows the marginal effects derived from the probit model specified to estimate the probability
that a worker has an informal occupation. Columns (1) and (2) show the estimates of the model when we
use the basic wage for the lagged minimum wage ratio with the two definitions of informality: firm’s
size and the social security affiliation. The lagged minimum wage ratio coefficients are significant and
suggest that an increase of one percentage point (pp) in the ratio increases the probability of being
informal by 0.1436 pp with the firm’s size definition and 0.1103 pp with the social security affiliation
one.
 As is expected, women have a higher probability of being informal with respect to men while educated
workers are less likely to be informal. Interestingly, the probability of becoming informal is
monotonically increasing with the age. Thus, workers with 41 to 50 and 51 to 65 years old, are more
likely to be informal than the younger (workers from 18 to 25 years old). Columns (3) and (4) present
the results when using the minimum wage ratio with “basic salary plus benefits”. In this case, the results
are similar; thus, one percentage point increase in the ratio of the lagged minimum wage increases the

10
 Neumark and Wascher (2008, section 3.4.2.) and the references therein- is devoted to the analysis of the inclusion of lagged
values of the minimum wage to estimate the effects of this variable on employment.
11
 Lotti et al. (2016) use two education levels: primary education or less and more than primary education. Given in Colombia,
the majority of workers have completed the secondary education; we use this level of education as a threshold.
probability of being informal by 0.141 pp, when using firm’s size definition, and 0.116 pp, when using
the social security affiliation.
 Given coefficients of average effects of the minimum wage ratio on the probability of having an
informal job, heterogeneous effects of this ratio on the informality rate is more easily understood having
the information of Figure 5 (left column) at hand. That is, we have sixteen different paths and levels of
the minimum wage ratios which generate partial responses in the probability. That is one of the reasons
for having heterogeneous informality rates. In other words, different restrictedness of the minimum wage
measure by the ratio with respect to the 70th percentile (or the labour productivity of less skilled workers)
generate different labour informality rates.

 Table 3. Probability of having an informal occupation. Marginal effects (probit models).
 MW ratio for salaried MW plus benefits ratio for salaried
 Variable Firm's size Social security affiliation Firm's size Social security affiliation
 (1) (2) (3) (4)
MW ratio t-1 0.1436*** 0.1103***
 (0.0477) (0.0422)
MW plus benefits ratio t-1 0.1409*** 0.1160***
 (0.0484) (0.0416)
Women 0.0943*** 0.0762*** 0.0958*** 0.0769***
 (0.0204) (0.0200) (0.0204) (0.0201)
Educated (15 or more years of education) -0.2238*** -0.1240*** -0.2270*** -0.1229***
 (0.0361) (0.0404) (0.0362) (0.0398)
26 to 40 years old 0.0717*** -0.0391** 0.0755*** -0.0353**
 (0.0211) (0.0155) (0.0218) (0.0157)
41 to 50 years old 0.2123*** 0.0536*** 0.2154*** 0.0573***
 (0.0211) (0.0151) (0.0220) (0.0153)
51 to 65 years old 0.3294*** 0.1787*** 0.3308*** 0.1810***
 (0.0295) (0.0244) (0.0298) (0.0246)
Additional individuals' controls Yes Yes Yes Yes
ISE Yes Yes Yes Yes
City, year and quarter controls Yes Yes Yes Yes
Pseudo R2 0.240 0.159 0.240 0.159
Observations 2,537,198 2,537,198 2,537,198 2,537,198
Note: additional individuals' controls: head of household, size of the household and sector. IES is the Index of Economic Situation common to all
cities at time t. *** = Significant at the 99% confidence level, ** = Significant at the 95% confidence level, * = Significant at the 90% confidence
level. Standard errors clustered at group level. Source: DANE; authors’ calculations.

 Arguably, one lag might not be enough capture the effect of the minimum wage ratio in the probability
of having and informal occupation. Thus, instead of having just one lag of the ratio, we use a lag
polynomial. In this case, expression (1) can be rewritten as
 = + ∑
 =1 − + + + + + (2)
 In this specification the parameters of interest, , capture the periodic effects of the minimum wage
ratio of the labour market group to which the individual belongs, in the probability of having an informal
job. Models of Table 4 include lags between 1 and 4 of the minimum wage ratios both basic [columns
(1) and (2) for the two definitions of informality] and including additional benefits [columns (3) and (4)].
 According to the individual coefficients in columns (1), the effect of the minimum wage ratio lasts
for a few months. Moreover, the effect of the minimum wage ratio on the probability of having an
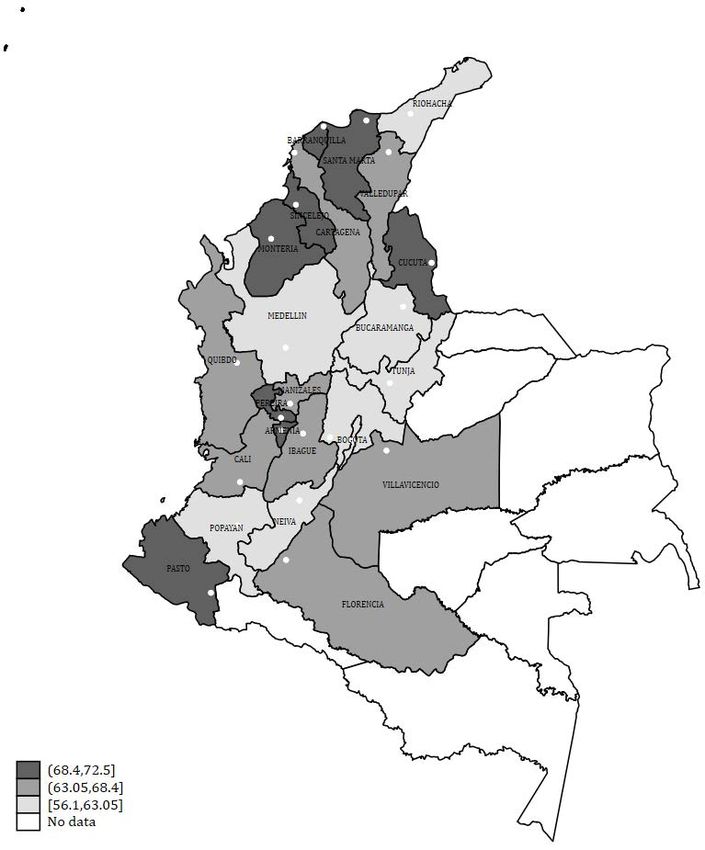
informal occupation declines monotonically. Column (1) also shows the accumulated effect of the ratio.
In this case, an increase of one pp in the ratio generates an increase of 0.21 pp in the probability after
four months. Results in column (2) are similar for almost all variables except for age and education.
Noticeable, the probability of having an informal occupation is lower for workers between 26 and 40
years old compared to workers between 18 and 25 years old.
 In columns (3) and (4) we reject the null hypothesis that 0 : ∑ =1 = 0. As in the case of the
minimum wage ratio built with the basic wage, the effect of the minimum wage ratio including other
benefits lasts four months according firm’s size definition (0.2099) and three months with the social
security affiliation (0.1762).
 Table 4. Probability of having an informal occupation. Marginal effects (probit models).
 Firm's size Social security affiliation Firm's size Social security affiliation
 Variable (1) (2) (3) (4)
 MW ratio t-1 0.0979*** 0.0679**
 (0.0308) (0.0289)
 MW ratio t-2 0.0714** 0.0515**
 (0.0287) (0.0241)
 MW ratio t-3 0.0238* 0.0688**
 (0.0126) (0.0330)
 MW ratio t-4 0.0149 -0.0260
 (0.0111) (0.0165)
 MW ratios: accumulate effect 0.2080*** 0.1621***
 (0.0671) (0.0615)
 MW plus benefits ratio for salaried t-1 0.0951*** 0.0724**
 (0.0304) (0.0290)
 MW plus benefits ratio for salaried t-2 0.0727** 0.0605***
 (0.0290) (0.0233)
 MW plus benefits ratio for salaried t-3 0.0231*** 0.0654**
 (0.0108) (0.0330)
 MW plus benefits ratio for salaried t-4 0.0190* -0.0222
 (0.0103) (0.0153)
 MW plus benefits ratios for salaried: accumulate effect 0.2099*** 0.1762***
 (0.0670) (0.0582)
 Women 0.0908*** 0.0735*** 0.0927*** 0.0742***
 (0.0209) (0.0199) (0.0209) (0.0199)
 Educated (15 or more years of education) -0.1957*** -0.0970** -0.1982*** -0.0926**
 (0.0444) (0.0479) (0.0439) (0.0459)
 26 to 40 years old 0.0780*** -0.0345** 0.0842*** -0.0282*
 (0.0205) (0.0145) (0.0217) (0.0150)
 41 to 50 years old 0.2203*** 0.0601*** 0.2256*** 0.0662***
 (0.0206) (0.0147) (0.0221) (0.0153)
 51 to 65 years old 0.3377*** 0.1861*** 0.3405*** 0.1903***
 (0.0294) (0.0251) (0.0303) (0.0257)
 Additional individuals' controls Yes Yes Yes Yes
 ISE Yes Yes Yes Yes
 City, year and quarter controls Yes Yes Yes Yes
 Pseudo-R2 0.240 0.159 0.240 0.159
 Number of observations 2,481,842 2,481,842 2,481,842 2,481,842
 Note: additional individuals' controls: head of household, size of the household and sector. IES is the Index of Economic Situation common
 to all cities at time t. *** = Significant at the 99% confidence level, ** = Significant at the 95% confidence level, * = Significant at the 90%
 confidence level. Source: DANE; authors’ calculations. Cluster the standard errors at individual group level.

 In Colombia, there is evidence that levels of informality are highly heterogeneous across cities.
Similar to Galvis (2012), and using the GEIH for the period of 2007-2016, Arango & Flórez (2017) report
results in this sense. Figure 6 shows the relation between the informality rate and minimum wage ratio
across cities. Cities with the highest informality levels also have the highest minimum wage ratio. Panel
A of Figure 6 shows the geographical heterogeneity of informality rate. Following Arango & Flórez
(2017), the 23 cities are assorted in four groups depending on the level of the informality rate. Group 1
corresponds to cities with low informality rate; these are, Bogotá, Manizales and Medellín. Group 2
includes cities with medium informality rate such as Barranquilla, Bucaramanga, Cali, Pereira,
Cartagena, Tunja and Popayán. Group 3 is made of cities with high informality rate such as Pasto,
Villavicencio, Ibagué, Armenia and Neiva. Finally, in Group 4 we have cities with very high informality
rate such as Cúcuta, Montería, Florencia, Valledupar, Quibdó, Riohacha, Santa Marta and Sincelejo.12

 Figure 6. Cities, informality rate and average minimum wage ratio in Colombia. 2007-2017
 Panel A. Cities grouped by informality prevalence Panel B. Cities grouped by Minimum wage ratio

Source: DANE; Arango & Flórez (2017); authors’ calculations

 With respect to the strictness of the minimum wage ratio, Panel B of Figure 6 presents the average
minimum wage ratio across cities in Colombia for the period 2007-2017. Notice that for the analysed
period we find that Montería, Sincelejo, Cúcuta, Barranquilla, Santa Marta, Armenia, Pereira and Pasto
present the highest minimum wage ratio (more than 68.4). For the cities in the second group, the
minimum wage ratio is between 63.05 and 68.4 are Valledupar, Cartagena, Quibdó, Ibagué, Manizales,
Villavicencio and Florencia. Finally, the third group of cities with the lowest average minimum wage
ratio (between 56.1 and 63.05) are Riohacha, Medellín, Bucaramanga, Tunja, Bogotá, Neiva and
Popayán.

12
 The groups are conformed as follows. First, cities with low informality; their informality rate is at least, half a standard
deviation below the 23-cities average informality rate. Second, cities of medium informality rate; the rate is between half a
standard deviation below and one standard deviation above the average informality rate. Third, cities with high informality
rate; the informality rate is between 1 and 1.5 standard deviations above the average. Fourth, cities with very high informality;
with informality rate higher than 1.5 standard deviations above the average of 23 cities.
Without claiming a full correspondence among the grey tones of departments in both maps, some
coherence between the rank of the minimum wage ratios and the provinces lined to each informality
group emerges from Figure 6. For example, darker zones are in the north of the country in both maps
where we find higher minimum wage ratios and higher informality rates. In the middle part of the
country, the tones are clear since correspond to lower ratios and lower informality.
 Table 5 presents the marginal effects of the previous estimation when controlling for the group of city
suggested by Arango & Flórez (2017). The specification of the model includes not only dummy variables
when the city belongs to each group but also interactions with the four lags of the minimum wage ratio.
Interestingly, not only the accumulated minimum wage ratios but also the dummies of belonging to
different groups and the interactions of these two variables are significant. When controlling for group
of cities we find that there is a higher probability of being informal with respect of cities of group 1 (low
informality).
 According to model of Table 5, there are some other unobservable variables, comprised by the
dummies that still affect the probability of having an informal job. In other words, apart from the
minimum wage ratio and some other controls included in the models of this table, the sign and
significance of the coefficient linked to the dummy variables of the groups, suggests that there are some
other explanations for the probability of having an informal job. For example, the interplay of preferences
of individuals and incentives in each group of cities or the response to other variables such as the labour
costs different from the wage or the effect of the interest rate (see Arango & Flórez, 2017). The
accumulated effect of the interaction between the minimum wage ratio and group of cities is higher for
cities with very high levels of informality. This result should draw the attention of the policy makers in
order to redefine the incentives scheme in cities of this group.
 The groups defined by Arango & Flórez (2017) might be arbitrary. In fact, the thresholds used by
these authors, in terms of standard deviations, to determine the cities to include within each level of
informality that they name groups 1 up to 4, do not respond to any optimizing process or rule.13 Thus, to
observe whether the minimum wage ratio gives rise to informality, instead of using the groups suggested
by Arango & Flórez (2017), we estimate a cluster model built by using an algorithm that create a group
of observations based on a criteria that minimizes the Euclidean distance between the observations and
the centre of each group. The number of clusters must be pre-specified.
 To determine the number of clusters we run the algorithm several times, with different number of
possible clusters, obtaining the sum of the squared errors from the Euclidean distance and finding the
number of clusters that minimizes this sum before it approximates to zero (since the more clusters, the
smaller the errors). By doing this, we found that a plausible number of clusters is 3, taking as base the
average rate of informality for the whole period. The algorithm classified the cities in three groups: i)
cities with low informality rate: Bogotá, Manizales, Medellín, Tunja, Cali and Pereira; ii) cities with
medium informality rate: Barranquilla, Cartagena, Bucaramanga, Popayán, Ibagué, Neiva, Villavicencio,

13
 The classification of cities of Arango and Flórez (2017), according to the labour informality rate, is used to suggest a
differential minimum wage policy. It is important to mention that such classification of the cities is very close to that of the
National Council of Competitiveness where only two cities (Santa Marta and Villavicencio) are in different groups. The
National Competitiveness Index is generated using 89 variables, while ours is based only on the labour informality rate. See
https://www.larepublica.co/economia/bogota-medellin-y-manizales-lideraron-el-indice-de-competitividad-de-ciudades-
2823524.
Armenia and Pasto; and, finally, iii) cities with high informality rate: Quibdó, Valledupar, Montería,
Santa Marta, Riohacha, Florencia, Sincelejo and Cúcuta.

 Table 5. Probability of having an informal occupation including informality groups of Arango & Flórez (2017).
 Firm’s size definition of labour informality. Marginal effects (probit models)
 Variables (1) (2)
 MW ratio t-1 0.0737**
 (0.0359)
 MW ratio t-2 0.0525*
 (0.0307)
 MW ratio t-3 0.0048
 (0.0172)
 MW ratio t-4 -0.0012
 (0.0138)
 MW ratios: accumulated effect 0.1298**
 (0.0542)
 MW plus benefits ratio t-1 0.0711**
 (0.0334)
 MW plus benefits ratio t-2 0.0474*
 (0.0272)
 MW plus benefits ratio t-3 -0.0042
 (0.0131)
 MW plus benefits ratio t-4 0.0041
 (0.0139)
 MW plus benefits ratios: accumulated effect 0.1183**
 (0.0551)
 Cities with medium level of informality 0.1042*** 0.0980***
 (0.0159) (0.0157)
 Cities with high level of informality 0.1285*** 0.1277***
 (0.0137) (0.0136)
 Cities with very high level of informality 0.1165*** 0.1117***
 (0.0323) (0.0320)
 MW ratios × cities with medium level of informality: accumulated effect 0.1298*** 0.1251***
 (0.0208) (0.0202)
 MW ratios × cities with high level of informality: accumulated effect 0.0575*** 0.0553***
 (0.0199) (0.0176)
 MW ratios × cities with very high level of informality: accumulated effect 0.1931*** 0.1872***
 (0.0438) (0.0405)
 Basic individual controls Yes Yes
 Additional individuals' controls Yes Yes
 ISE Yes Yes
 City, year and quarter controls Yes Yes
 Pseudo-R2 0.240 0.240
 Number of observations 2,481,842 2,481,842
 Note: additional individuals' controls: head of household, size of the household and sector. IES is the Index of
 Economic Situation common to all cities at time t. Basic individual controls include dummies of Women, Educated
 and the 26 to 40, 41 to 50 and 51 to 60 years old ranges. *** = Significant at the 99% confidence level, ** =
 Significant at the 95% confidence level, * = Significant at the 90% confidence level. Source: DANE; authors’
 calculations. Standard errors clustered at the individual group level.

 Table 6 presents the results using the previous groups of cities. The results are very similar to those
found in Table 5; that is, not only the minimum wage ratio (binds) is significant but also the dummy
variables of belonging to the city cluster with medium and high labour informality and the interaction of
them are significant.
The significance of the coefficients linked to the dummy variables of the groups of Arango & Flórez
(2017) or the clusters, in Tables 5 and 6, respectively, suggest that apart from the high minimum wage
there are other determinants that, on average, cause labour informality. Among the candidates of this
remaining explanation of the informality rate are non-wage labour costs, the interest rate (see Arango &
Flórez, 2017), and other mechanisms in which preferences of individual´s and some other technological
aspects of each city might play a role.

 Table 6. Probability of having an informal occupation. Clustered cities. Marginal effects (probit models)
 MW ratio for salaried MW plus benefits ratio for salaried
 Variables
 (1) (2)
 MW ratio: accumulated effect 0.1285**
 (0.0542)
 MW plus benefits ratio: accumulated effect 0.1140**
 (0.0569)
 Cities with medium level of informality 0.0460** 0.0878***
 (0.0202) (0.0193)
 Cities with high level of informality 0.1185*** 0.1133***
 (0.0327) (0.0329)
 MW ratio × cities with medium level of informality: accumulated effect 0.1470*** 0.1398***
 (0.0260) (0.0267)
 MW ratio × cities with high level of informality: accumulated effect 0.1903*** 0.1854***
 (0.0449) (0.0428)
 Group controls Yes Yes
 Additional individuals' controls Yes Yes
 ISE Yes Yes
 City, year and quarter controls Yes Yes
 Pseudo R2 0.240 0.240
 Observations 2,481,842 2,481,842
Note: *** = Significant at the 99% confidence level, ** = Significant at the 95% confidence level, * = Significant at the 90% confidence level. Source:
DANE; authors’ calculations. Cluster the standard errors at the individual group level. Group controls include dummies of Women, Educated and
the 26 to 40, 41 to 50 and 51 to 60 years old ranges.

 So far, we have shown average responses to different values and paths of the minimum wage ratio
depending on the group we are dealing with. A complementary view of the effects of the minimum wage
strictness on labour informality would require testing whether it takes place in a nonlinear fashion or
whether the linear approach is enough. Intuitively, nonlinearities provide some notion about how strong
is the response to the ratio, irrespective of its level or, in other words, how are operating the exclusion
mechanisms (see Perry et al, 2007) depending on the group to which the individual belongs.
 To verify the presence of this mechanism, we modify the introduction of the minimum wage ratio
(with respect to the 70th percentile of salaried workers) and instead of using it in a rather continuous way,
we define ten dummy variables each corresponding to ten deciles of the distribution of the minimum
wage ratio. For example, if the minimum wage ratio of an individual corresponds to the first decile, the
dummy variable takes value of one, otherwise it will be zero. If the minimum wage ratio of another
individual is within the second decile, this dummy variable takes the value of one, otherwise will be zero,
and so on.
 According to the results of Table 7, the relation of the minimum wage to the 70th percentile has a
significant effect on the probability of having an informal occupation. Moreover, the effect is increasing;
that is, the higher the decile in which the minimum wage ratio is located, the higher the coefficient, thus
the higher the probability of having an informal job. These results imply that for those workers whose
labour productivity is lower than the minimum wage, will have a higher effect of the minimum wage on
the probability of having a job in the informal sector.

 Table 7. Probability of having an informal occupation. Marginal effects (probit models).
 MW ratio for salaried
 Firm's size definition of Social security affiliation
 Variable
 informality definition of informality
 (1) (2)
 2nd decile MW ratio 0.0028 0.0065
 (0.0053) (0.0045)
 3rd decile MW ratio 0.0162*** 0.0401***
 (0.0059) (0.0051)
 4th decile MW ratio 0.0257*** 0.0565***
 (0.0059) (0.0051)
 5th decile MW ratio 0.0346*** 0.0627***
 (0.0060) (0.0052)
 6th decile MW ratio 0.0523*** 0.0824***
 (0.0060) (0.0052)
 7th decile MW ratio 0.0584*** 0.0943***
 (0.0061) (0.0052)
 8th decile MW ratio 0.0596*** 0.0959***
 (0.0062) (0.0053)
 9th decile MW ratio 0.0533*** 0.0902***
 (0.0063) (0.0054)
 10th decile MW ratio 0.2197*** 0.2371***
 (0.0060) (0.0050)
 Women 0.0781*** 0.0477***
 (0.0015) (0.0015)
 Educated (15 or more years of education) -0.2443*** -0.0820***
 (0.0042) (0.0038)
 26 to 40 years old 0.0494*** -0.0539***
 (0.0023) (0.0023)
 41 to 50 years old 0.1847*** 0.0390***
 (0.0025) (0.0025)
 51 to 65 years old 0.3022*** 0.1665***
 (0.0026) (0.0026)
 Additional individuals' controls Yes Yes
 ISE Yes Yes
 City, year and quarter controls Yes Yes
 Pseudo R2 0.236 0.167
 Observations 2,759,747 2,759,747
 Note: additional individuals’ controls: head of household, size of household and sector. IES is the Index of Economic
 Situation common to all cities at time t. *** = Significant at the 99% confidence level, ** = Significant at the 95%
 confidence level, * = Significant at the 90% confidence level. ith decile MW ratio is a dummy equal 1 if the worker’s
 MW ratio is in the ith decile of the MW ratio distribution in each city and year. Source: DANE; authors’ calculations.

 Table 7 shows other important results such us the negative coefficient for workers between 26 and 40
years old in column (2) when labour informality corresponds to social security affiliation definition. This
result, with respect to workers between 18 and 25 years old, is consistent with Figure 2B.
 The general results show important effects of the minimum wage on the probability that workers have
an informal job. This is not the only unique explanation of the labour informality in Colombia; however,
it should be important to have this variable into account when setting the minimum wage.
5. Conclusions and policy implications

Colombia has a persistent tradition of high labour informality. Among the main factors behind such
outcome is the disparity between the minimum wage and the labour productivity of less-skilled workers.
In this paper, instead of the minimum wage related to the labour productivity of workers, we use of
minimum wage with respect to the 70th percentile of the wage distribution of salaried workers. Recently
Arango and Flórez (2017) presented evidence that such ratio causes the informality, focusing in some
geographic areas.
 We split the population among sixteen groups by interacting gender (male and female) with four level
of ages (18 to 25, 26 to 40, 41 to 50 and 51 to 65 years old) and two levels of education (educated and
uneducated workers14) for each city. Then we focus the effect on the minimum wage ratio on the
probability of having an informal job for an individual who belongs to a particular demographic group.
To this end, we follow the identification strategy used by Lotti et al. (2016), who utilize the variation of
the difference level of strictness of the minimum wage among different labour market groups. Labour
market groups, whose wage is closer to the minimum wage, may present a higher exposition to the risk
of having an informal occupation.
 Our findings suggest that the minimum wage ratio has a positive effect on the probability of having
an informal job. Then using the lagged minimum wage ratio, we find that the accumulated effect is
between 0.16 and 0.21. Thus, an increase of one percentage point in the minimum wage ratio increases
the probability of having an informal job by 0.21 pp. The most affected groups by the minimum wage
ratio are less educated workers, young workers and women. Grouping cities by their level of labour
informality allows us to find higher effects of the minimum wage ratio for those cities with higher levels
of informality. We also provide evidence of nonlinear effects of the minimum wage ratio; this means that
the more binding the minimum wage in an individual’s group the higher the probability of having an
informal job.
 The results we provide call for a change in the way in which the minimum wage has been used to help
unskilled workers. The persistent increase it has exhibited during the last two decades has contributed to
increase the probability that unskilled and young workers have their occupation in the informal sector.
To remedy this, not only the change in the annual labour productivity should be had into account to set
the minimum wage annual increase but also its level. The distance between the minimum wage and the
labour productivity ought to be considered. In addition, implementing a minimum wage policy that focus
on particular groups (less educated and young workers) or geographical areas and the labour productivity
may be useful.
 After having into account the minimum wage ratio, women are more likely of being informal with
respect to men while more educated workers are less likely of being so. The probability of becoming
informal is monotonically increasing with age, thus a sound policy for protecting elderly should include
the reduction of the informality of aged workers.

14
 Lotti et al. (2016) use two education levels: primary education or less and more than primary education. Given in Colombia,
the majority of workers have completed the secondary education; we use this level of education as a threshold.
You can also read