Briefing Note: Kick-Starting Wage Growth: What the Commonwealth Government Could do NOW - cloudfront.net
←
→
Page content transcription
If your browser does not render page correctly, please read the page content below
Briefing Note:
                  Kick-Starting Wage Growth:
       What the Commonwealth Government Could do NOW
                                            By Dr. Jim Stanford
                                              June 24, 2019

Introduction and Summary

Australia’s economy continues to endure a period of uniquely and stubbornly slow
growth in wages and salaries. Since 2013, wage growth has decelerated to the slowest
sustained pace since the end of the Second World War. Measured by the ABS’s Wage
Price Index (WPI), nominal wages have grown over the last 5 years at an average annual
rate of barely 2% – about half their pace in previous times. And by other measures (such
as ABS series on average weekly wages and labour compensation per hour of work),
nominal wages have grown even more slowly.1 Real wages have been static during this
time, as nominal wages have just kept pace with rising consumer prices.

A growing range of economic and policy experts have confirmed the multifaceted and
serious consequences of stagnant wages: including weak consumer spending, household
financial fragility, slower job-creation and economic growth, below-target inflation,2
slower growth in government revenues, and lasting damage to equality and social
cohesiveness.3

The Commonwealth government continues to hope for an automatic rebound in wage
growth, which senior figures have asserted will occur as a result of normal market
forces and a gradual tightening of labour market conditions. For example, in its most

1
  The WPI measures weighted change in compensation in a constructed representative “basket” of different jobs,
assumed constant from one period to the next. It will consequently overstate growth in realised labour incomes
in times when changes in the composition of employment (eg. more part-time work, insecure jobs, or lower-
wage positions) pull down overall labour incomes, as has been the case in recent years.
2
  CPI inflation in the March quarter fell to zero, and just 1.3% on a year-over-year basis – indicating the national
economy is on the edge of tipping into dangerous deflation (ABS Catalogue 6401.0).
3
  Prominent experts who have expressed these concerns include Dr Philip Lowe, Governor of the reserve Bank
of Australia (Lowe, 2017; Greber, 2017); business leaders (see, for example, Turner, 2017); and 124 labour
market policy experts who recently signed a joint public statement regarding the dangers of wage stagnation
(Long, 2019).

                                                         1
recent Commonwealth budget, the government forecast a quick acceleration in average
wage growth in Australia to 3.5% within three years. Repeated predictions in past
budgets of a rapid rebound in wage growth have consistently failed to materialise;4 and
there is little reason to believe that this one will, either. In fact, the most recent
quarterly wage data suggests a slight slowing in wage growth – not a rebound.5
Given the escalating social and economic costs of continued wage stagnation, and the
failure of market forces to autonomously resuscitate normal wage growth, the case for
pro-active measures to stimulate stronger wages is stronger than ever. The editors of a
recent compilation of academic research regarding the causes, consequences, and
potential remedies to wage stagnation summarised five broad policy response that, in
their judgment, would help boost wage growth back toward normal magnitudes
(Stewart et al., 2018, Chapter 20):
Ending wage suppression by government (including arbitrary caps imposed in
place of normal collective bargaining with government employees).
Revitalising collective bargaining through measures such as expansion of the
Fair Work Commission’s powers to settle both interest and rights disputes, and
the extension of collective bargaining to multi-employer and sectoral settings.
Strengthening regulation of minimum wage standards, including higher
minimum wages and stronger pay equity rules.
Adapting and modernizing labour laws and regulations to respond to
fragmentation in employer business models and supply chains (including
extended responsibilities for franchisors and top-level firms, and extension of
labour protections to the “gig economy”).
Enhancing compliance with existing labour laws and standards, to prevent wage
theft and other abuses.
Similar agendas for labour policy reform have been advanced by other experts and
commentators to address wage stagnation and its numerous consequences.6 Some of
these reforms will require significant periods of time to undertake further research,
consultation, policy design, and implementation. In some cases, however, policy action
could be taken immediately: with relatively direct regulatory changes, and in some
cases with no legislative requirements at all.
4
See Center for Future Work (2019) for a comparison of all Commonwealth budget wage forecasts to actual
wage growth since 2014-15 to the present.
5
Within-quarter growth in seasonally adjusted WPI for all sectors in Australia slowed to 0.5% in the March
2019 quarter – equal to an annualized rate of 2.2% (author’s calculations from ABS Catalogue 6345.0, Table 1).
That marked the third consecutive decline in the within-quarter rate of WPI growth. Moreover, about one-third
of all the growth in WPI over the past year is attributable to the relatively large 3.5% increase in the federal
minimum wage that was implemented last July 1, not to labour market tightening; see Stanford (2019a).
6
See, for example, Isaac (2018) and Bornstein (2018).
2From this broader portfolio of policy measures advanced to respond to the wages crisis,
we have selected three specific reforms that would have a direct and immediate impact
on wage growth. Moreover, these three specific measures could all be implemented by
the Commonwealth government alone, with no requirement for coordination with other
levels of government. The three measures include:
1. Reversal of the reductions in penalty rates for Sunday and public holiday work in
the retail and hospitality sectors.
2. Introduction of a “living wage” mandate for Australia’s federal minimum wage,
moving it toward a level that would lift full-time full-year workers above
standard benchmarks of relative poverty.
3. Removal of the Commonwealth government’s restrictive cap on wage increases
for its own employees, and restoration of normal collective bargaining and
traditional rates of wage increase.
The first two measures would require the Commonwealth government to revise the
guidance and directives it gives to the Fair Work Commission (under the terms of the
Fair Work Act). While that involves an additional step in implementation, it could
nevertheless be completed in short order by a government committed to spurring
stronger wage growth – and they would have a direct and timely impact on wages. The
third measure could be introduced directly and immediately by the Commonwealth
government, with no requirements for legislative change.
This briefing note reports economic simulations of the effects of these three measures
on wages and salaries for workers who would be covered by them – and subsequently
on broader labour market, fiscal, and macroeconomic outcomes. In summary, we find
that the three measures would directly lift wage growth for about 3.3 million workers in
Australia’s economy – close to one-third of all waged employees. Once fully
implemented, they would generate an additional $10.2 billion in annual wage income
for those affected workers, or an average of over $3000 additional income per year per
worker. These three measures alone would add about 1.25 percentage points to overall
wage and salary payments in the Australian labour market – supporting a rebound in
overall wage growth from present depressed levels (of around 2.3% per year at
present) back toward normal rates (of 3.5% per year or more).7
The resulting direct and timely boost to wage growth would have additional positive
spillover effects on broader labour market and macroeconomic trends, including:
Spurring faster wage growth for other workers, as other employers are pressed
to keep up with accelerating wage growth.
7
RBA Governor Lowe (2018) has indicated that wage growth needs to be in the range of 3.5% per year in order
to ratify the RBA’s 2.5% inflation target combined with long-run expected labour productivity growth of around
1% per year.
3 A significant boost to consumer spending (of around $8.5 billion per year),
aggregate demand, and GDP growth.
A significant fiscal payback to government in the form of stronger personal
income tax and GST revenues.
A reduction in income inequality – since most of the effects of these measures
will be enjoyed disproportionately by lower-income workers.
The rest of this briefing paper describes the methodology, data sources, and findings of
the three simulations, and then discusses their combined labour market and
macroeconomic impacts.
Restoring Penalty Rates
In February 2017 the Fair Work Commission decided to impose reductions in Sunday
and holiday penalty rates for a wide range of award-dependent workers in the retail
and hospitality sectors. Those reductions are being imposed in up to four stages;
another round of rate reductions is scheduled to take effect on 1 July of this year, and
the final round is scheduled for 1 July 2020. Table 1 summarises the reductions, which
apply to different groups of workers employed under five different Modern Awards:
Table 1
Summary of Reductions
in Retail and Hospitality Penalty Rates
Sunday Penalty Reduction Holiday
Award Status Penalty
Reduction1 Final Step Reduction1
General Retail Perm. -50% 1 July 2020 -25%
(MA000004) Casual -25% 1 July 2019 0 to -25%
Pharmacy Perm. -50% 1 July 2020 -25%
(MA000012) Casual -50% 1 July 2020 -25%
Fast Food Perm. -25%2 1 July 2019 -25%
(MA000003) Casual -25%2 1 July 2019 -25%
Hospitality
Perm. -25% 1 July 2019 -25%
(MA000009)
Restaurant Perm. na na -25%
(MA000119) Casual na na na
Source: Stanford (2019b), compiled from Fair Work Commission (2017).
1. Expressed as proportion of base wage. 2. Level 1 only.
4The penalty rate cuts were motivated, in theory, by employer arguments that with
lower labour costs for Sunday and holiday work in these sectors, hours of work and
total employment in the retail and hospitality sectors would increase. The Fair Work
Commission cited this likely benefit in announcing the reductions, but the results on this
score have been very disappointing. Job-creation in the retail sector since the decline in
penalty rates commenced has been almost non-existent; job-creation in the hospitality
sector has been relatively weak compared to economy-wide trends. Indeed, total job-
creation since the May quarter of 2017 (the last quarter prior to the penalty rate
reductions began) has been almost 5 times faster in sectors which did not receive lower
penalty rates, than in the two broad sectors which did.8 Even some business leaders
have acknowledged the failure of lower penalty rates to stimulate job-creation – with
one major small business leader even asserting the whole policy exercise has “just been
a waste of time.”9 Various factors account for the failure of lower penalty rates to
translate into additional hiring, including: weak consumer demand, indivisibilities in
shift and staffing schedules, and overarching macroeconomic trends affecting both
sectors (such as the impact of online shopping on traditional retail operations).
Table 2
Annual Wage Losses Over Easter/ANZAC Period
Sunday & Base Wage Losses Per Day Total Wage
Sector Holiday Hourly ($million) Losses per
Employment Wage Year
Holidays Sundays
(000s)1 ($) ($million)2
Retail 287.9 $20.79 $8.1 $15.2 $889.5
Accommo-
dation/Food 292.6 $20.79 $7.8 $4.8 $344.8
& Beverage
Total 580.5 $15.8 $20.1 $1,234.3
Source: Stanford (2019b) calculations from unpublished ABS data and Fair Work
Commission, as explained in text.
1. Average employment on a Sunday or public holiday; the total number of workers
affected by penalty rate reductions at any point in the year is larger.
2. Assumes 12 public holidays and 52 Sundays per year.
In previous work (Stanford 2019b), we have estimated the total number of workers
affected by these penalty rate reductions, and the aggregate loss of wages which they
are likely experience. Based on unpublished ABS data regarding the incidence of work
on Sundays in the broader retail and hospitality sectors, and data regarding the
composition of employment in each sector (including breakdown between permanent
and casual workers, who are affected differently by the penalty rate reductions), we
8
See Stanford (2019b), p. 7.
9
Cited in Hannan (2019). See also O’Brien (2019) and Bagshaw (2017) for more evidence on the failure of
lower penalty rates to stimulate employment.
5estimate an average of 580,000 people work in the two sectors on a typical Sunday or
holiday.10 We consider the direct impact of the penalty rate reductions on workers
employed under a modern award, but also the indirect impact on wage provisions paid
to workers under enterprise agreements and individual contracts.11
Our simulation conservatively assumes a base wage rate in the two sectors equal to the
entry-level hourly wage;12 it then assigns proportional wage losses to different groups
of workers affected by the penalty rate reductions. On this basis, we estimate that the
penalty rate reductions (once fully implemented after 1 July 2020) will reduce daily
compensation paid across the two sectors by over $15 million on a typical Sunday, and
over $20 million on a typical public holiday. Over the course of an entire year, this
translates into a combined annual loss in wages of almost $1.25 billion. The actual loss
in wages could be significantly higher, if future hiring expands total employment in the
two sectors,13 and as base wage rates increase in future years (due to further increases
in Award wages).
Many labour and social advocates have argued in favour of reversing these cuts in
penalty rates. Given the disproportionate employment of women, young workers, and
workers from immigrant communities in these two sectors, and the already low wages
which prevail there, the penalty rate reductions are having a particularly severe impact
on incomes of workers who already face low and insecure incomes. The penalty rate
cuts could be reversed by the Commonwealth government simply by adjusting the
terms of reference given to the Fair work Commission in its reviews of Modern Awards
– for example, by requiring that changes to those Awards must not result in reductions
in take-home pay for affected workers.
If the penalty rate cuts were indeed reversed, and restored to their pre-2017 levels, this
would generate a positive increment to aggregate incomes in the broader retail and
hospitality sectors of at least $1.25 billion per year – compared to what will prevail after
1 July 2020 once the current timetable of cuts is fully phased in.
10
The number of workers experiencing penalty rate reductions at some point over the course of a year is higher
than this, since not every affected worker works every Sunday or holiday.
11
Evidence suggests that changes in statutory minimums are eventually reflected in changes in the terms of non-
award employment contracts. For example, some enterprise agreements in the retail sector now include
provisions automatically mirroring changes in Award penalty rates; and all employers (including those with
enterprise agreements or individual contracts) must ensure that their compensation at least matches the
minimum requirements of Awards, and hence a reduction in Award provisions for Sunday and holiday work
will undermine non-Award compensation.
12
Many workers in the two sectors earn higher wages, and hence their losses from penalty rate reductions will
be proportionately greater.
13
Although, as noted, both sectors have underperformed the rest of the economy in job-creation since the
penalty rate reductions began.
6A ‘Living Wage’ Policy
Labour and anti-poverty advocates have also been lobbying for Australia to adopt a so-
called ‘living wage’ policy, and this is the second wage-boosting policy which we
simulate in this report. The core idea is that wages should be high enough to at least
ensure that someone working full-time year-round can meet minimum benchmarks of
poverty. The concept finds its roots in the early decisions of Australia’s industrial
tribunals: such as the famous 1907 ‘Sunshine Harvester’ decision, which first attempted
to define minimum wages in relation to the actual costs of operating a household at a
minimum socially acceptable standard.14
There are many different approaches to defining and measuring a living wage. One
proposal is to ensure that the legal minimum wage is sufficient to ensure that a full-
time, full-year worker reaches at least 60% of the median wage earned by all full-time
workers (a common measure of relative poverty).15 Implementing any living wage
proposal would require additional research to accurately specify and measure the
median wage against which the living wage would be measured, and to ensure that the
resulting living wage is indeed sufficient to cover minimum living costs in
representative Australian communities. For present purposes, however, we will
simulate the benefits of moving to a living wage policy on the basis of the following
methodology.16 First, as an estimate of median wages, we utilise data from the ABS’s
annual survey of Characteristics of Employment (Catalogue 6333.0). Its most recent
survey (conducted in August 2018) estimates median weekly wages for full-time
permanent employees at $1350, equivalent to $34.35 per hour (on the basis of average
weekly hours for permanent full-time workers of 39.3 hours17). A minimum wage set at
60% of median full-time earnings would thus equal slightly below $21 per hour. That
was about $2 higher than the federal minimum wage at that point.
Most proposals for implementing a living wage assume that the policy would be phased
in over some years, to allow for labour markets to plan for and adjust to the new
benchmark. For example, the ACTU’s (2019) living wage proposal would entail two
significant annual adjustments to the national minimum wage, moving from its current
level to the living wage threshold. Complicating matters is the fact that the median wage
(which is the target for the living wage) will have increased further during that period;
the living wage timetable must allow for that ongoing growth.
14
The Sunshine Harvester decision established a minimum wage of 7 shillings per day, which was then
estimated as the minimum required for a full-time worker to provide a decent material standard of living for a
family of five people (including his or her spouse and three children). For more on the theory and empirics
behind living wage proposals, see Brennan (2012) and Luce (2004).
15
This proposal was made recently by the Australian Council of Trade Unions (2019), among others.
16
This framework for defining a living wage, and timetable for moving toward it, is presented here for
illustrative purposes only, and is not advocated as necessarily the optimal approach to implementing a living
wage.
17
From ABS Catalogue 6306.0, Data Cube 5, Table 2.
7Table 3
Timetable for a Living Wage
Median 60% Real Living
CPI
Weekly Living Wage
($2019)
Wage Wage ($2019)
August 2018 $34.35 $20.61 98.0 $21.02
July 2019 $35.21 $21.13 100.0 $21.13
July 2020 $36.09 $21.65 102.0 $21.23
July 2021 $36.99 $22.20 104.0 $21.33
Increase from July 2019: 13.9% 9.5%
Source: Author's calculations from ABS Catalogues 6306.0 and 6333.0 as
described in text.
Therefore, we simulate the wage improvements resulting from the living wage by
assuming a two-year phase-in to the new benchmark, with two significant increases in
the federal minimum on 1 July 2020 and 2021 (the next two occasions on which the Fair
Work Commission will adjust the minimum wage). These calculations are summarised
in Table 3. Median wages will have increased during the intervening time; we assume
they grew by 2.5% per year. To equal 60% of median wages by 2021, therefore, the
minimum wage will need to reach $22.20 per hour – $2.70, or about 14%, higher than
the $19.49 per hour which will be effective as of 1 July this year. However, some of that
growth in the minimum wage would occur anyway on the basis of “normal” annual
minimum wage adjustments, presumably in line with consumer price inflation and the
Fair Work Commission’s judgment of optimal wage policies (even under its existing
mandate). To simulate the separate, ‘pure’ impact of shifting to a living wage policy,
therefore, we measure the increase in the real minimum wage required over that two-
year period, relative to the general rise in consumer and other prices over that same
period.18 Moving to a living wage from the July 2019 minimum wage, therefore, will
require a real increase of some 9.5% (or $1.85 per hour in 2019 dollar terms) over two
years.
To simulate the impact of this shift to a living wage policy on aggregate wage incomes,
we must also estimate the number of workers who would be affected by the living wage,
and the number of hours they typically work. These calculations are summarised in
Table 4. At present, adjustments in the federal minimum wage normally flow through to
all workers employed under a Modern Award; adjustments to various wage categories
specified in those awards are usually made in accordance with the proportional
increase in the overall minimum. Most recent ABS data indicate that about 2.25 million
workers are presently paid according to the terms of a Modern Award.
18
We assume 2% annual increase in consumer prices.
8Table 4
Impact of Living Wage Adjustments
Number of Share of Living Aggregate Increase
Workers Affected Wage Increases in Wages
(thousands) Received ($b/yr)
Award-Dependent Workers
Lowest Half 1117.4 Full $3.386
Third Quartile 558.7 50% $1.511
Top Quartile 558.7 25% $1.000
Other Workers 800.8 50% $1.920
Total 3035.6 $7.817
Source: Author's calculations as described in text.
However, the shift to a living wage policy will entail larger-than-normal adjustments to
the minimum wage, and it is possible that the Fair Work Commission might then
contemplate some ‘compression’ in Award wage scales, so that higher-wage Award-
dependent workers do not receive the same proportional increases as lower-wage
workers. This would be consistent with the rationale that the move towards a living
wage is motivated primarily by a desire to ensure that low-wage full-time workers are
not in poverty; this rationale implies that higher-wage workers under Modern Awards
would not receive the same proportionate increases (although they would receive some
increases, in order to maintain appropriate wage relativities based on their
qualifications and seniority). Our simulation accounts for this compression by assuming
that only the lower-paid half of award workers receive the full proportional
adjustments to the living wage. The third quartile of workers (those between the
median wage and the 75% mark of the distribution) would receive two-thirds of the
increment; and those in the top quartile (above 75% in the distribution) would receive
one-third of the increment.19 Under this plan, most of the wage increases are enjoyed by
the bottom half of Award-dependent workers.
There is a final group of workers who will also benefit from the shift to a living wage
policy. Some workers employed and paid under enterprise agreements or individual
contracts also earn incomes that are near or even below the living wage benchmark
defined above.20 Their employers will be pressured by the implementation of a living
wage policy to lift their own wage offers. In some cases, employers set wages for
19
For those higher-paid quartile of Award-dependent workers, this differentiated approach implies annual
nominal minimum wage increases of 2.3% – only slightly in excess of expected inflation.
20
For example, some collective agreements specify wage increases that are tied to increases in the federal
minimum wage.
9workers in relation to the statutory minimum (eg. paying wages that are a certain
proportion above the minimum wage); those workers will also likely experience
indirect gains from the living wage policy even though they are not paid under a Modern
Award, as employers move to preserve wage relativities.21 We assume that the lowest
decile (10%) of workers employed under enterprise agreements or individual contracts
(who presently earn less than about $975 per week) will thus receive half of the wage
gains specified under the living wage policy.22
Table 4 reports the impacts on aggregate annual wage payments received after 1 July
2021 by all of these groups of workers: low-, middle-, and higher-wage Award-
dependent workers, and the lowest decile of workers under other employment
contracts (enterprise agreements or individual contracts) who also feel the spill-over
benefits of the new minimum benchmark. In total, we estimate that over 3 million
workers would receive higher wages as a result of the implementation of a living wage
policy. Their aggregate wage income would increase by almost $8 billion per year after
the policy is fully phased in.
Commonwealth Public Sector Wage Increases
The Commonwealth government itself is one of Australia’s largest employers; according
to most recent ABS data, some 240,000 people were employed in various federal public
sector positions.23 Since 2014, the Commonwealth has imposed a strict annual 2% cap
on wage increases for those employees, which has circumvented traditional collective
bargaining over wages.24 The contradiction between a government which confidently
and repeatedly predicts a robust rebound in national wage growth to 3.5% per year (as
specified in its own budget forecasts), as opposed to its own interventions to suppress
wage growth for its own workforce (one of the largest in the country) at barely half that
level, is striking indeed. So the third wage-boosting policy measure we simulate is the
removal of that wage cap, and restoration of normal collective bargaining.
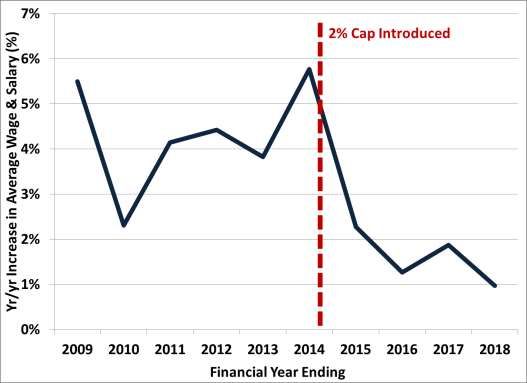
In practice, compensation gains for federal public servants have been suppressed even
below the government’s nominal 2% cap. Figure 1 illustrates the annual increase (on a
financial year basis) in per person wages and salaries paid to federal public sector
workers over the last decade.
21
This is often called the “trickle-up effect” of minimum wage increases, and its existence is well-documented
in economic research; see, for example, Harris and Kearney (2014) and Neumark et al. (2004).
22
Data on numbers and weekly earnings of the lowest decile of workers covered by enterprise agreements and
individual contracts are from ABS Catalogue 6306.0, Data Set 8, Table 4.
23
See ABS Catalogue 6248.055.002, Table 1; data for 2017-18 financial year (most recent available).
24
See Australian Public Service Commission (2018). The cap was initially defined in 2014 as an increase of
4.5% over 3 years, but that was superseded by a 2% annual cap.
10Figure 1: Growth in Average Compensation, Federal Public Sector
Source: Author’s calculations from ABS Catalogue 6248.055.002, Table 1.
In the 6 financial years prior to the 2014 wage cap, average compensation grew at an
average annual rate of 4.3%.25 Year-to-year growth rates fluctuated widely, typically
resulting from unevenness in major collective agreement implementation; but the
longer-run average rate of compensation growth was consistent with corresponding
wage trends in the broader labour market. Since 2014, however, that average annual
rate of growth plunged to just 1.6% – lower even than the government’s stringent wage
cap. Average compensation in the federal public sector since 2014 has languished
behind annual growth in consumer prices, implying a reduction in real wages for federal
public sector workers. In the most recent year covered by the ABS data, average
compensation grew by slightly under 1% – the lowest in the history of the ABS data
used for the analysis.
Table 5 summarises our simulation of the impact of eliminating the 2% wage cap on
federal public sector workers, restoring normal collective bargaining processes, and
then the expected recovery of wage growth toward more traditional levels. Our
simulation assumes a modest rebound in average compensation growth to 3.25% per
25
The ABS data utilised for this analysis began to be collected in 2007/08, so the first year we can calculate
annual growth is for 2008/09. Note that the growth rates indicated in Figure 1 include changes in compensation
resulting from changes in classification, seniority, and employment composition (not just annual salary
increments for workers in a particular classification).
11year;26 that is still a full percentage point lower than the average rates which prevailed
prior to 2014.
Table 5
Impact of Restored Wage Growth in Federal Public
Sector
Total Employment: 240,700
Aggregate Wages & Salaries ($b)
At current rate At restored rate
Year Difference
(1.6%) (3.25%)
0 $21.4
1 $21.7 $22.1 $0.4
2 $22.0 $22.8 $0.7
3 $22.4 $23.5 $1.1
Source: Author's calculations from ABS Catalogue 6248.055.002, Table 1, as
explained in text.
Compared to the wage increases (averaging 1.6% per year) that have been experienced
under the Commonwealth wage cap, we project a $2.1 billion growth in aggregate
compensation for the 240,000 federal public sector workers over the first three years of
normalised collective bargaining – compared to just a $1 billion increase if the post-
2014 growth rate is preserved.27 In the final year of the forecast, therefore, total wage
and salary payouts would be $1.1 billion higher than if the current cap was retained.
This simulation assumes no change in the number of workers employed in the federal
public sector. In reality, federal government employment will likely have to increase in
coming years, under the strains of past restraint in hiring and growing demand for
federal services. According to ABS data, total public sector employment at the federal
level declined by 10,000 positions between fiscal 2012/13 and 2017/18 – despite
Australia’s growing population. This downsizing has been accompanied by significant
increases in federal expenses for consulting and outsourced services, many of which
have been associated with scandals, cost overruns, and service failures.28 If the
government were indeed to start to rebuild federal public service headcounts, then
additional wage payments resulting from the relaxation of the 2% wage cap would be
larger than indicated in Table 1.29
Note also that this simulation considers only the benefits of relaxing public sector wage
restraint at the federal government level. Most public sector workers in Australia are
26
That growth rate is assumed for illustrative purposes only, and does not constitute our recommendation for
optimal wage growth for federal public sector workers – especially in light of the cumulative impact of wage
restraint since 2014 on their real incomes.
27
The three year forecast coincides with one term in office for the reelected Commonwealth government.
28
See, for example, Gartrel and Hunter (2015).
29
Since faster wage growth would now be applied to a larger number of employees.
12employed by state governments and agencies, and the remainder at the local
government level. In many of those jurisdictions, similarly restrictive and intrusive
constraints on normal collective bargaining and wage growth have also been applied,
further contributing to the deceleration of overall wage growth in Australia’s labour
market.30 If those lower levels of government followed the Commonwealth’s lead and
also allowed a restoration of normal wage growth for their employees, then the benefits
for overall wage and salary income in Australia would be even larger. Indeed, a similar
approach applied to the much larger population of state and local government public
sector employees in Australia (a total of 1.75 million workers) would generate an
additional positive increment in total wage and salary payouts worth $3.5 billion in the
third year.31 However, as our focus in this report is on policy measures which the
Commonwealth government could immediately and independently put into place, we
exclude those additional gains from our simulation of the combined effect of the three
identified wage-boosting policies.
Combined Effects
Each one of these three wage-boosting policy measures, all of which could be
implemented quickly by the Commonwealth government, delivers an important boost
to total wage and salary income in the Australian labour market. The living wage policy
has the largest effect, since it would apply to the largest group of workers. But the other
two policies – restoring normal wage growth for federal public sector workers, and
restoring pre-2017 penalty rates for workers in the retail and hospitality sectors –
would also have significant and positive effects.
Table 6 summarises the combined impact of the three measures. Together they would
lift wages for about 3.3 million Australian workers. Note that the total number of
workers affected is smaller than the sum of the number affected by each of the three
specific measures; this is because most (but not all) of the retail and hospitality workers
who have experienced reduced penalty rates would also benefit from the shift to a living
wage policy (either because they are employed under a Modern Award, or they fall
within the lowest decile of employees under enterprise agreements or individual
contracts also assumed to capture spill-over benefits from the living wage policy).
30
Henderson (2018) provides an overview of the imposition of wage caps in various jurisdictions in Australia,
and their perverse spillover consequences on overall wage growth.
31
While the population of state and local public sector workers is 7 times larger than the federal public sector
workforce, the impact of the restoration of more normal wage increases on total wage and salary payouts is only
three times as large. That is mostly because wage increases at the state and local level have been stronger than at
the Commonwealth (growing by just under 2.5% per year between 2014/15 and 2017/18, compared to just 1.6%
for Commonwealth workers), and hence the additional wage payouts resulting from restoring wage growth to
3.25% are proportionately smaller.
13Table 6
Combined Impact of Wage-Enhancing Measures
Aggregate
Workers Affected Wage
Policy Measure
(thousands) Increment
($b/yr)
Reversal of Penalty Rate Cuts 580.5 $1.234
Implementation of Living Wage Policy 3035.6 $7.817
Restoration of Public Sector Wage Growth 240.7 $1.109
3 Measures Total 3300.01 $10.160
Wage Increment per Affected Worker $3,079
Source: Author's calculations as described in text.
1. Approximate total; does not equal sum of three separate measures because some
workers are covered by both penalty rate reversal and the living wage policy.
Combined annual wage increases from the three policies, once fully phased in, would
total an estimated $10.2 billion per year. That is equal to nearly $3,100 per year for each
of the workers affected by one or more of the policies. The scale of economic benefits
arising from these wage-boosting policies is many times larger than the savings which
they are likely to receive from any of the proposed reductions in personal income taxes
being currently discussed in Parliament. Indeed, the effect of these wage-supporting
policies is targeted on low-wage workers – many of whom do not pay personal income
tax at all (and hence will receive no benefit from proposed tax cuts). For them,
supporting stronger growth in pre-tax wages – the so-called “predistribution of income”
– is the most important way to improve living standards.
Macroeconomic and Fiscal Benefits
This aggregate boost in annual wage incomes would make a macroeconomically
significant difference to Australia’s currently depressed wage growth trajectory.
Consider that combined wage and salary compensation for all employees in Australia
currently equals about $800 billion per year.32 The $10.2 billion increase in annual wage
and salary income is thus equivalent to more than 1.25% of existing combined wages
and salaries. That increase would not be experienced all at once; it would be phased in
over a 2-3 year period, including time required for negotiation of new enterprise
agreements with federal public sector workers, and the two-year phase-in period for
the living wage policy. Nevertheless, over that period, this set of three concrete
measures, implemented directly by the Commonwealth level of government, could be
expected to add close to one-half percentage point per year to the overall rate of wage
growth in the labour market as a whole.
32
See ABS Catalogue 5206.0., Table 7.
14That is not enough to single-handedly fix the historic slowdown in wage growth that has
been experienced since 2013. But it would make a substantial difference. And it would
send a clear signal to the rest of the labour market that the Australian government is
once again committed to encouraging and supporting higher wages – rather than
suppressing them – as a matter of national policy priority. Directly and indirectly, all
employers will feel pressure to lift their own wage offers. Ideally, the three measures
simulated above would be supplemented by complementary initiatives to support the
spread of stronger wage growth through the labour market: including restoration of
normal collective bargaining for state and local government workers, strengthening
collective bargaining in all parts of the economy, strengthening pay equity policies and
regulations, and boosting funding for non-governmental service providers (such as
child care, aged care, and disability services) so that those workers can also achieve
higher incomes.
In addition to its direct contribution to output, productivity, and incomes, the important
increase in wages and salaries that would result from these three initiatives would
generate other beneficial spillovers throughout the Australian economy – including in
private sector businesses, and for workers not directly affected by these three policies.
For example, a $10 billion annual boost in labour incomes, focused largely on lower-
income workers, would stimulate significant increases in consumer spending. Measured
across all households in Australia, just over two-thirds of all income received by
households is reinjected back into the economy in the form of spending on consumer
goods and services.33 For low-wage workers, that average spending propensity is higher
(since low-income households do not, in general, save significant portions of their
income). It is safe to assume, given the income profile of workers benefiting from these
wage-supporting measures, a gross average savings and direct tax propensity half as
large as for the population as a whole (and a consequently larger average propensity to
spend on consumption). In this case, the $10.2 billion annual increase in wage and
salary income would translate into $8.5 billion in additional consumer spending.
Consumer spending, in turn, constitutes over half of total Australian GDP.34 This
significant boost in consumer spending will thus support stronger sales, profits, and
output across the retail, wholesale, and consumer service sectors. Hence the
recirculation of increased labour incomes back into the economic cycle thus supports
additional second-round increases in economic activity, incomes, and tax revenues. Of
course, some of the new consumer spending “leaks out” of Australia’s economy through
spending on imports, but most stays within the domestic economic cycle. Additional
positive spillover impacts in the rest of the economy include stronger private sector
confidence, increased investment, and maultiplied increases in employment and
33
Personal expenditure on final consumption of goods and services equaled 67% of gross income in 2018.
Average spending parameters are based on ABS Catalogue 5206.0, Table 20.
34
In current price terms, household consumer spending accounted for 56% of total GDP in 2018.
15economic growth. These spillover effects are particularly important during times of
macroeconomic uncertainty and labour underutilisation (such as prevail at present).
The $8.5 billion injection of new consumer spending, therefore, can be expected to have
at least a proportional positive impact on Australian GDP.35
Another beneficiary of indirect macroeconomic spillovers from higher labour incomes is
government itself. Considering all households in Australia, over 15% of gross personal
income is paid back to governments at all levels in the form of direct taxes (including
income taxes, other current taxes, and social security contributions). Consistent with
our previous assumption that most workers benefiting from these wage-supporting
policies have lower-than-average incomes, their aggregate tax payments will be lower
as well: we assume they pay at half the rate of the national average. Moreover,
governments benefit from GST collections on the incremental consumer spending
financed from new wage income – at a rate of about 6.5 cents on the dollar of new
consumer spending.36 Combined incremental income taxes and GST revenues alone,
therefore, from the $10.2 billion boost in wage and salary income would amount to over
$1.3 billion in incremental tax revenues. Most of that revenue would be received by the
Commonwealth level of government; this implies that for the Commonwealth, the
combined effect of the three wage-boosting measures considered in this report is
fiscally neutral, with new Commonwealth revenues offsetting most or all of the
additional wage and salary expenses paid out as a result of the relaxation of its wage cap
on federal public sector workers. Expanded government revenues, in turn, could
facilitate subsequent respending by government (on expanded public services and/or
infrastructure investments), implying another channel of positive spillover onto the real
economy.
Some of the broader benefits of stronger wage growth, targeted as they are at lower-
income households, are harder to quantify, but are certainly important. By improving
incomes and financial stability at the lower end of the income distribution, these
policies would strengthen the health of families and communities, reduce the growing
income gap so visible in Australia, and strengthen general social and community
cohesion. At a time when Australian society is increasingly marked by cynicism,
disengagement, and polarisation, committing to directly enhance the wages of lower-
income Australians would surely constitute a timely and important moral stance on the
part of the Commonwealth government.
35
If the leakage of consumer expenditure on imports is offset by the positive multiplied impact of second-round
and subsequent respending effects on final economic activity, then the final GDP of increased personal
consumption expenditure would be 1.0. Under certain conditions it can be higher. Again, as with the aggregate
increase in total wages and salaries, this increment will be experienced over a 2-3 years period; nevertheless, it
would provide a welcome boost to aggregate expenditure a time of great macroeconomic uncertainty.
36
The average GST collection rate is less than the statutory GST rate (10%, which then equals 9% of gross
consumer expenditure including tax) because some consumption spending does not attract the GST for various
reasons.
16Conclusion
The unprecedented stagnation in wages experienced in Australia over the past six years
has not been an accident. Nor is it the exogenous outcome of economic or technological
forces that are somehow beyond Australians’ collective control. To the contrary, the
weakness of wage growth, and its accompanying economic and social consequences, is
the predictable consequence of a consistent focus on restraint, austerity, and wage
suppression by governments at all levels. The actions of the Commonwealth
government in recent years have clearly exacerbated these negative trends – including
its particularly harsh wage restraint with its own employees, its ratification of penalty
rate reductions and other wage-reducing policies, and its failure to address the
accelerating erosion of traditional wage-supporting institutions in Australia (like the
rapid decline of collective bargaining in private sector workplaces37).
Instead of waiting passively for “market forces” to automatically repair wages, and
assuming that optimistic budget predictions of an imminent rebound in wages can
somehow make that rebound a reality, it is time for the Commonwealth government to
take concrete actions to support stronger wage growth. This report has identified three
concrete, specific measures which could be taken immediately and unilaterally by the
Commonwealth government to support wages. Together they would provide a boost to
wages that is macroeconomically significant (reaching over $10 billion in new wages
once fully implemented, an increase of over 1.25% in total wage and salary payouts),
and is rightfully targeted at the lower-income workers who need it most. These policies
would be effective and fiscally viable. Their prospects depend solely on the
government’s willingness to act to support workers and their wages.
References
Australian Council of Trade Unions (2019). “Submission to the Annual Wage Review
2018-19,“ 15 March, https://www.fwc.gov.au/documents/wage-reviews/2018-
19/submissions/actu-sub-awr1819.pdf.
Australian Public Services Commission (2018). “Remuneration: The Government's
Wages Policy Explained,” Canberra, Australian Government, https://www.apsc.gov.au/
remuneration-governments-wages-policy-explained .
Bagshaw, Eryk (2017). “Penalty rate cut fails to stimulate jobs, survey shows,” Sydney
Morning Herald, 14 December, https://www.smh.com.au/politics/federal/penalty-rate-
cut-fails-to-stimulate-jobs-survey-shows-20171214-h04csj.html.
37
Pennington (2018) reports that the share of private sector workers covered by enterprise agreements has
plunged by about one-third since 2013.
17Bornstein, Josh (2018), ‘Enterprise bargaining is out of reach for most workers.
We need a better system’, The Guardian, 24 October, https://www.theguardian.com/
commentisfree/2018/oct/24/enterprise-bargaining-is-out-of-reach-for-most-workers-
we-need-a-better-system.
Brennan, Jordan (2012). Enhancing Democratic Citizenship, Deepening Distributive
Justice: The Living Wage Movement (Ottawa: Canadian Centre for Policy Alternatives),
https://www.policyalternatives.ca/publications/reports/enhancing-democratic-
citizenship-deepening-distributive-justice.
Centre for Future Work (2019). “Commonwealth Budget 2019-20: Refusing to Learn
from Past Mistakes” (Sydney: Centre for Future Work), 2 April,
https://www.futurework.org.au/budget_2019_20_ooops_they_did_it_again.
Fair Work Commission (2017). 4 Yearly Review of Modern Awards: Penalty Rates,
Transition Arrangements, 5 June, https://www.fwc.gov.au/sites/
awardsmodernfouryr/2017fwcfb3001-summary.pdf.
Gartrell, A. and F. Hunter (2015). “Soaring consultant costs cancel out public service
salary savings,” Canberra Times, 28 November,
http://www.canberratimes.com.au/federal-politics/political-news/soaring-consultant-
costs-cancel-out-public-service-salary-savings-20151127-gla53b.html.
Greber, Jacob (2017), ‘Workers must demand greater share of pie, says RBA Governor
Philip Lowe’, Australian Financial Review, 19 June, https://www.afr.com/news/
economy/monetary-policy/workers-must-demand-greater-share-of-pie-says-rba-
governor-philip-lowe-20170619-gwtxht.
Hannan, Ewin (2019). “Penalty rate cut ‘failed to create one new job’,” The Australian, 26
April, https://www.theaustralian.com.au/nation/politics/penalty-rate-cut-failed-to-
create-one-new-job/news-story/4946a1915162c197a896063ae4009bb7.
Harris, Benjamin H., and Melissa S. Kearney (2014). The “Ripple Effect” of a Minimum
Wage Increase on American Workers (Washington: Brookings Institution, Hamilton
Project).
Henderson, Troy (2018). “Public sector austerity and its spill-over effects,” in Andrew
Stewart, Jim Stanford, and Tess Hardy (eds.), The Wages Crisis in Australia: What it is
and what to do about it (Adelaide: University of Adelaide Press).
Isaac, Joe (2018), ‘Why Are Australian Wages Lagging and What Can Be Done About It?’,
Australian Economic Review, 51(2) pp. 175-190.
18Long, Stephen (2019). “120 labour market researchers sign an open letter calling for
intervention to boost wage growth,” ABC News Online, 18 March, https://www.abc.net.
au/news/2019-03-19/researchers-write-open-letter-on-benefits-of-faster-wage-
growth/10912998.
Lowe, Philip (2017), ‘Remarks on a panel at the Australian National University’s
Crawford Australian Leadership Forum’, Speech by the Reserve Bank of Australia
Governor, Canberra, 19 June, https://www.rba.gov.au/speeches/2017/sp-gov-2017-
06-19.html.
Lowe, Philip (2018), ‘Productivity, wages and prosperity’, Speech by the Reserve Bank
of Australia Governor, Melbourne, 13 June, https://www.rba.gov.au/speeches/
2018/sp-gov-2018-06-13.html.
Luce, Stephanie (2004). Fighting for a Living Wage (Ithaca: Cornell University Press).
Neumark David, Mark Schweitzer and William Wascher, (2004), “Minimum wage effects
throughout the wage distribution”, Journal of Human Resources 39(2), pp. 425–450.
O’Brien, Martin (2019). “Cutting penalty rates was supposed to create jobs. It hasn’t, and
here’s why not,” The Conversation, 15 May, https://theconversation.com/cutting-
penalty-rates-was-supposed-to-create-jobs-it-hasnt-and-heres-why-not-117178.
Pennington, Alison (2018). On the Brink: The Erosion of Enterprise Agreement Coverage
in Australia’s Private Sector (Sydney: Centre for Future Work),
https://www.futurework.org.au/on_the_brink_the_crisis_in_private_sector_collective_b
argaining.
Stanford, Jim (2019a). “The Importance of Minimum Wages to Recent Australian Wage
Trends” (Sydney: Centre for Future Work), 14 May, https://www.futurework.org.au/
the_impact_of_minimum_wages_on_recent_wage_trends.
Stanford, Jim (2019b). “April Holiday Cluster Highlights Income Losses From Reduced
Penalty Rates” (Sydney: Centre for Future Work), 17 April, https://www.futurework.
org.au/penalty_rate_cuts_will_exact_big_toll_over_easter_anzac_day_period.
Stewart, Andrew, Jim Stanford, and Tess Hardy, eds. (2018). The Wages Crisis in
Australia: What It Is and What To Do About It (Adelaide: University of Adelaide Press),
328 pp.
19You can also read