A time of crisis, a window of opportunity
←
→
Page content transcription
If your browser does not render page correctly, please read the page content below
1
A time of crisis,
a window of opportunity

x   The scope of the present global crisis – the most serious financial and economic contraction
    since the 1930s – presents all countries with new challenges. Although the medium-term growth
    outlook is poor, South Africa has made the right choices over the past decade, creating the
    room for a bold response now. The 2009 Budget advances a series of policy measures to
    enable South Africa to respond to the changed economic environment and construct a more
    robust platform for growth once the world economy recovers.

x   Government’s sound fiscal and monetary policies have reduced but not eliminated the country’s
    exposure to the international downturn. Following six years of strong performance, GDP growth
    is expected to slow sharply to 1.2 per cent in 2009. While some factors point towards an
    incipient recovery in global growth towards the end of the year, the outlook is highly uncertain.

x   Over the period ahead government is committed to strengthening the economic foundation
    required for accelerated long-term growth by extending the public-sector infrastructure
    programme. The fiscal stance provides for sustained growth in public expenditure to cushion the
    economy and reinforce the social safety net for the poor, while ensuring that debt incurred to
    finance the country’s priorities is kept at sustainable levels now and in future.

    A turning point in the world economy
Introduction
The impact of the global financial crisis on the world economy has                 The world is in the midst of
been more severe than anticipated, and the deteriorating international             a deep and synchronised
environment significantly affects South Africa’s growth prospects. In              economic slowdown
economic terms, the period ahead will be the most challenging yet
faced by South Africa’s democracy.

                                                                                                                  1
2009 BUDGET REVIEW
Economic growth is Domestic GDP growth is projected to slow to 1.2 per cent in 2009
projected to slow to from an estimated 3.1 per cent in 2008. The period of slower growth
1.2 per cent of GDP in 2009 ahead is likely to be characterised by rising unemployment, declining
business profitability and the closure of some companies. While
policy responses to the crisis will reduce the impact on poor and
marginalised communities, economic conditions will be difficult for
some time.
Government will sustain Slowing economic growth has put pressure on government revenues
strong growth in public and reduced the fiscal space for increased expenditure. However, as a
spending result of government’s record of sound fiscal management and
prudent policy choices over the past decade, the state will be able to
increase spending on social services and fixed investment over the
medium term.
The new and difficult circumstances call for both bold action and
careful policy adjustments to ensure that the economy continues to
grow and to improve the living standards of all South Africans.
Boldness is required because of the severity of the situation, yet care
must be taken so that ill-conceived or poorly executed interventions
do not burden future generations.
Five objectives guide The 2009 Budget is framed by five objectives that guide government’s
government’s response to policy response over the medium term:
the crisis
x Protect the poor. Government will continue to expand
programmes that alleviate poverty and strengthen the social safety
net.
x Build capacity for long-term growth. Investment in infrastructure
will be accelerated. This includes ensuring that public utilities can
finance their capital investments and that the development finance
institutions play a greater role in lending for infrastructure
investment, sharing risk with the private sector.
x Sustain employment growth. Government will increase public
investment spending, expand labour-intensive employment
programmes, and work with business and organised labour to
protect work opportunities and accelerate skills development.
x Maintain a sustainable debt level. While public debt is set to rise,
this expansion must be kept in check so as not to reduce the space
to finance development in the longer term.
x Address sectoral barriers to growth and investment.
Microeconomic and regulatory reforms are needed to ensure that a
more competitive, labour-absorbing economy emerges from the
current global crisis.
State-owned entities will Flowing from these objectives, the 2009 Budget provides for strong
spend, on average, more growth in allocations for labour-intensive employment programmes,
than R120 billion a year on municipal infrastructure, education, health, fighting crime and
infrastructure programmes investing in rural development. Consolidated non-interest government
expenditure is expected to grow by 5.1 per cent a year in real terms
over the next three years. Over the medium term, state-owned
enterprises will spend more than R120 billion a year on infrastructure,
laying the foundations for faster economic growth in the future.
2CHAPTER 1: A TIME OF CRISIS, A WINDOW OF OPPORTUNITY
For the global economy, the downturn highlights the need to address Downturn highlights the
structural trade imbalances, reshape international financial relations, long-term need to address
and attack the underlying causes of poverty and inequality. South underlying causes of
Africa’s challenge, similarly, is to address the obstacles that stand in poverty and inequality
the way of faster growth and broader participation in economic
development. These include labour market arrangements that inhibit
job creation, dysfunctional government institutions, weaknesses in
education and training, lags in industrial and trade interventions, and
uncompetitive cost structures in input sectors such as
telecommunications.
Managing through the downturn
A global crisis
In the 2008 Budget, government pointed to the high probability that
global imbalances would begin to unwind in a rapid and disorderly
fashion, setting off a severe economic slowdown. The storm is now
upon us in the form of a broad-based and synchronised downturn that
reaches from developed to emerging economies.
Nearly all developed countries are now in recession. Confidence has Nearly all developed
yet to be restored in the banking sector and the balance sheets of countries are in recession
financial institutions remain under pressure. Credit conditions are and employment levels are
deteriorating and demand is in decline. Employment is falling as falling rapidly
companies adjust to a period of significantly reduced demand. Last
year US employers cut nearly 2.6 million jobs – the fastest payroll
reduction since 1945 – bringing the unemployment rate to 7.2 per cent
in December 2008. Joblessness is increasing in the UK and in most of
the European Union.
Growth prospects for emerging markets have deteriorated Commodity exporters such
significantly. Commodity exporters are affected by a sharp decline in as South Africa face the
the prices of their key exports, weaker demand and a reversal of double blow of weak
capital flows. Falling asset prices have led to a sharp reduction in demand and falling prices
household consumption and declining private-sector investment. In
high-growth Asian export economies, sectors such as manufacturing,
mining, construction and retail are contracting. China is experiencing
factory closures and large-scale job losses. Growth on the African
continent is set to decline as commodity prices fall, development
assistance flows slow and access to capital dries up.
Global policy responses
The policy response to these events has evolved through three
overlapping phases, though loss of confidence in banking and credit
markets has not yet been reversed:
x Round one: Rescuing the financial sector – Governments injected
liquidity into the financial system and then acted to rescue major
banks. In several cases, these bailouts were accompanied by partial
nationalisation and state debt guarantees.
x Round two: Easing monetary policy – Central banks cut interest
rates to historic lows. In December 2008, the UK bank rate was set
to its lowest level in the Bank of England’s 314-year history. US
interest rates are between zero and 0.25 per cent.
32009 BUDGET REVIEW
x Round three: Stimulus packages – A massive fiscal expansion is
now under way. Most large economies are experiencing a sharp
deterioration in their fiscal positions as revenue slows, social
security payments expand and the cost of financial rescue packages
comes on budget. In addition, governments are reducing tax rates
and increasing spending to stimulate demand.
Governments are proposing The International Monetary Fund has recommended that developed
stimulus measures to boost countries should implement economic stimulus measures. The
demand US government is presently debating a US$819 billion stimulus plan
covering both higher public spending and tax cuts. China has
announced a stimulus package worth US$586 billion, focused
primarily on infrastructure spending and social security transfers.
Emerging markets are finding it more difficult to respond in a similar
way: raising finance given the present conditions of tight credit on
global capital markets is difficult and costly.
A retreat into protectionism The Group of 20 (G20) heads of state meeting in November 2008
would make the crisis adopted resolutions to oppose protectionist policies. A slowdown in
worse, particularly for world trade would make the economic decline more severe and
emerging markets protracted. This highlights the importance of a speedy resolution of
the Doha round of trade negotiations, including a more equitable
global trading regime for developing economies.
Crafting South Africa’s economic policy response
South Africa’s response to the global downturn takes account of
several factors:
x Slowing export demand is leading to a contraction of production
and employment in several sectors.
x The size of the drop in global demand cannot easily be offset by a
small economy such as ours.
x A substantial infrastructure spending increase is already built into
government’s expenditure plans.
x It is costly to raise finance in the present circumstances as global
capital markets strongly favour reserve currencies such as the
US dollar and euro.
The fiscal space to respond to periods of slower growth is determined
by the management of the public finances during periods of higher
growth. Steps taken since 1996 to reduce public debt, and hence debt
interest costs, have provided a degree of flexibility that is essential to
manage the effects of the present downturn.
South Africa already has With these considerations in mind, South Africa has chosen to sustain
elements of a fiscal stimulus growth in public spending to build on the public-sector investment
response built into its plans programme already under way, to expand labour-intensive
employment programmes, to broaden social security benefits, to
continue to invest in education, health and other public services, and
to support well-targeted industrial development. These elements
provide a countercyclical boost that will assist in sustaining growth
and minimising job losses.
4CHAPTER 1: A TIME OF CRISIS, A WINDOW OF OPPORTUNITY
Highlights of the 2009 Budget
The economy and the fiscal stance
x GDP growth is projected at 1.2 per cent in 2009, rising to 4 per cent by 2011.
x Inflation (the rise in the consumer price index) is expected to fall to 5.8 per cent in 2009.
x Gross fixed capital formation growth is projected to average 6.1 per cent over the next three
years.
x Government spending on infrastructure totals R787 billion over the next three years, R390 billion
of which is capital spending by the state-owned enterprises.
x Consolidated government budget deficit reaches 3.8 per cent in 2009/10, moving to 1.9 per cent
by 2011/12.
x Consolidated government spending (excluding interest) grows by 5.1 per cent a year in real
terms.
Tax proposals
x Personal income tax relief for individuals amounts to R13.6 billion.
x Taxes on petrol and diesel increase by 40.5 and 41.5 cents per litre respectively.
x A packet of 20 cigarettes will cost 88 cents more.
x A 750 ml bottle of natural wine will cost 10.5 cents more.
x A 340 ml can of beer will cost 7 cents more.
x A 750 ml bottle of liquor (spirits) will cost R3.21 more.
x Incentives for investments in energy-efficient technologies.
x Motor vehicle excise reform to tax carbon emissions and a new tax on energy-intensive light
bulbs.
Spending on public services
Additions to spending plans over the next three years
x R24.8 billion to provinces for increasing services, mainly health and education.
x R12 billion more for social grants and R1.2 billion for grant administration fees.
x R4.1 billion for the second phase of the expanded public works programme.
x R4 billion for the school nutrition programme to feed more children more often.
x R5.4 billion for the criminal justice sector overhaul, including fingerprint and DNA databases.
x R4.1 billion for provincial infrastructure, especially school buildings, roads and clinics.
x R4.3 billion for municipal infrastructure and R1 billion for regional bulk water infrastructure.
x R600 million for municipalities to extend free basic services.
x R1.6 billion as an equity injection into South African Airways.
x R3.7 billion more for increased housing provision.
x R1 billion for electricity demand-side management.
x R932 million for the treatment and prevention of HIV and Aids.
x R6.4 billion for public transport, roads and rail infrastructure.
x R1.6 billion for industrial development and support to small enterprises.
x R1.8 billion for rural development, mainly focused on supporting small-scale agriculture.
52009 BUDGET REVIEW
A lower tax burden, combined with strong growth in public spending,
signals a strong fiscal stimulus to the economy over the period ahead.
This is consistent with the countercyclical fiscal stance followed in
recent years. However, government is also mindful of the difficulties
of raising large amounts of debt in the present environment, and that
an unsustainable level of borrowing would put South Africa’s
developmental objectives at risk. For these reasons the degree of fiscal
expansion must be kept moderate, and the 2009 Budget also identifies
areas where spending will be reduced, placing an obligation on
government to become more efficient, effective and economical.
The 2010 FIFA World Cup, The economic reforms implemented over the past decade will help to
lower inflation and a more sustain South Africa’s ability to grow and to spend on the drivers of
competitive rand will provide long-term growth. As the global economy begins to show signs of
a boost to the economy recovery, the impetus from strong private and public investment over
the past decade, the economic boost associated with the
2010 FIFA World Cup, the more competitive currency, a healthy
banking system, falling inflation and lower interest rates should allow
for a gradual recovery in household spending and economic growth
over the medium term.
Emerging from the crisis on a sounder footing
Fiscal measures and Falling commodity prices and the reversal of favourable global growth
microeconomic reforms are trends have underlined inherent weaknesses in the domestic economy.
needed to put the economy Despite four years of 5 per cent-plus GDP growth and strong increases
on a different footing in employment, income inequality remains high, the structure of South
Africa’s economy is heavily reliant on commodities and skills
constraints impede broad-based development. South Africa’s response
during the period of slower growth ahead will influence both the
speed and depth of the recovery. Success will be judged by the
economy’s ability to sustain higher growth through increased exports
and a significant reduction in unemployment. The opportunity here is
to combine fiscal measures and microeconomic reforms to put the
economy on a sounder footing.
Higher infrastructure Sustaining investment in productive capacity. As highlighted by the
spending will lift the ‘speed electricity failures in the first quarter of 2008, South Africa’s ageing
limit’ of the economy physical infrastructure limits economic growth. Accelerated
infrastructure investment has generated momentum that will support
growth in the short term, enabling a broadening of opportunities in the
longer term. Through development finance institutions such as the
Development Bank of Southern Africa and the Industrial
Development Corporation, government will aim to ensure that feasible
projects in both state-owned enterprises and municipalities can access
the finances required to sustain improvements in public infrastructure.
Public sector has a key role Expanding employment in public works. The introduction of the
to play in expanding labour- second phase of the expanded public works programme draws on
intensive employment lessons learnt over the past five years. The extension of this
programme prioritises longer-term jobs in the social and municipal
services sectors, in adult literacy initiatives and in programmes
delivered through non-governmental organisations. A new
performance-based incentive is provided to municipalities to increase
the labour-intensity of public works under their supervision. An
6CHAPTER 1: A TIME OF CRISIS, A WINDOW OF OPPORTUNITY
additional R4.1 billion is allocated for public employment
programmes.
Regulatory reform. High input prices raise the cost of doing High cost structure limits
business, lower employment and reduce economic growth. The employment, innovation and
competition authorities have made progress in dismantling price- productivity
setting cartels in various sectors. Yet major areas of the economy are
characterised by dominant companies or parastatals, with insufficient
competition to drive innovation and productivity. Government
regulation and red tape often contribute to high barriers to entry. The
necessary policy response is to lower such barriers, encourage new
entrants into the market and foster greater competition. An enhanced
regulatory impact assessment framework would assist, together with
greater clarity about sectoral strategies and long-term industrial
development goals.
Strengthening agriculture. The sharp rise in food prices during 2008 Rural development to focus
exposed weaknesses in domestic agriculture. The price increases had a on raising agricultural output
detrimental impact on the poor and highlighted years of declining and rural incomes
output in a labour-intensive sector. Food exports have fallen steadily
over the past decade while the level of imports has increased, pushing
up prices. Given its resources, South Africa could become a major
food exporter. The new policy emphasis on rural development is
aimed at raising rural incomes, ensuring sustainable growth in food
production and drawing small farmers into the food supply chain.
Raising export performance. Weak export performance remains the Weak export performance is
Achilles heel of the economy. Relative to other emerging markets, the Achilles heel of the
South Africa’s export performance has lagged, while import growth South African economy
has been strong. A higher level of exports can contribute to more rapid
job creation and sustainable growth.
Table 1.1 Export and import performance, selected
emerging markets
Per cent compound growth Export Import
2001– 2006 growth growth
Brazil 18.8 10.4
China 29.5 26.6
India 23.3 29.0
South Africa 13.7 23.4
Government and the private sector can take several steps to improve Steps are needed to
the competitiveness of key export sectors as global demand recovers. improve competitiveness of
Some of these interventions are contained in the National Industrial key export sectors
Policy Framework. The announcement of a new phase of support for
the motor industry is meant to provide a stable platform for continued
export growth. The 2009 Budget includes R17 billion for industrial
support, including tax incentives for particular sectors. Government
recognises that competitive industries cannot be built behind ongoing
protective tariffs or subsidies. Effective targeting of business
incentives therefore needs to take careful account of the costs and
benefits of selected support measures.
Improving public sector performance. While the reach of South
Africa’s public services has expanded significantly since the late
72009 BUDGET REVIEW
1990s, many components of the public sector do not deliver services
of an acceptable quality. Public-sector inefficiency imposes costs on
ordinary South Africans and reduces economic performance.
Considering that general government consumption spending is almost
a quarter of the economy, improving value for money and
performance in the public sector would make an important
contribution to higher growth, employment and welfare.
Progress in these areas will contribute to an earlier recovery that
provides more widespread economic benefits for South Africa.
Fifteen years: progress and challenges
In budgeting, government assesses its progress, evaluates the
effectiveness of its programmes and identifies weaknesses. Three
recent documents provide a composite sketch of progress registered
during the formative years of South African democracy: Towards a
Fifteen Year Review and the 2008 Development Indicators,1 both
published by The Presidency, and a fiscal incidence study2 conducted
by the National Treasury to gauge the effect of public spending.
Institutions of constitutional South Africa’s successes have occurred in three broad dimensions.
democracy are firmly First, the construction of a new democratic order that replaced
entrenched apartheid rule. The foundations of the new state were laid during the
first five years with the adoption of the Constitution, the repeal of
apartheid laws, the creation of the Constitutional Court and the
establishment of three tiers of government. Independence of the
central bank was established, the National Treasury was created,
parliamentary oversight over public spending was institutionalised and
an open, transparent budget process was introduced.
Government expenditure The second dimension of success has been the extension of basic
has provided tangible services. Prior to 1994, just over half of all South Africans had
benefits to poor households electricity in their homes; today more than 80 per cent have access to
this basic necessity of modern life. Significant progress has been made
in providing houses, water and sanitation, and in extending access to
schooling, health care and social grants.
Table 1.2 Access to basic household services
Percentage of households 1996 2001 2007
Using electricity
for lighting 58 70 80
for cooking 47 51 67
for heating 45 49 59
Water
Equivalent to or above RDP standard 62 74 88
(200m to communal tap)
Tap in dwelling or on site – 61 70
Sanitation
Equivalent to or above RDP standard 52 59 73
Flush toilet – 52 60
1
Available at www.gov.za
2
Soon to be available at www.treasury.gov.za
8CHAPTER 1: A TIME OF CRISIS, A WINDOW OF OPPORTUNITY
The number of clinic visits increased from 80 million in 2000 to The number of social grant
101 million in 2007. The number of social grant beneficiaries grew beneficiaries has grown
fourfold to 13 million. These tangible signs of a better life have been fourfold to 13 million
complemented by the introduction of school feeding schemes, free
basic services and no-fee schooling.
The third dimension of success has occurred on the economic front, Economic expansion has
brought about by a long and sustained economic expansion since broadened opportunities
1999. Rising employment, increasing household income, lower taxes and reduced poverty
and the redistributive nature of the budget have enabled millions of
people to move out of poverty. About 2 million more people are
working today than in 2001 and the proportion of households with
monthly income less than R367 per person (in 2007 prices) has fallen
from 53 per cent in 1996 to 41 per cent in 2007. Disposable income
has increased strongly during this period.
Public finances have become significantly more pro-poor
Since 1996, the public finances have undergone significant changes. Spending has grown strongly in
social services – which include education, health and social development – and household services such
as housing, water, sanitation, electrification and related infrastructure. In 2006, more than 50 per cent of
public spending on education, health, social assistance and housing went to the poorest 40 per cent of
the population.
Total spending per person on these services has increased from R1 643 in 1995 to R2 788 in 2006 (in
constant 2000 prices). Spending per capita on the poorest 20 per cent of the population was R4 079 in
2006. Not only has government spending per person on these programmes increased by 70 per cent in
real terms, but spending on the poorest 40 per cent has grown by 83 per cent in real terms.
Share of spending on key programmes going to the poorest 40 per cent of households, 2006
80
70
70
62
59 57
60
49 50
50
Percentage
43
40
30 24
20
10 5
0
s
n
g
s
io n
ts
als
ic s
in g
nt
io n
din
tio
an
ra
pi t
at
lin
us
ca
ns
en
gr
tg
uc
cc
os
du
Ho
pe
sp
ity
ed
or
ch
b li
ye
b il
pp
ia l
e
Pu
ol
b li
ag
ar
sa
su
oc
ho
Pu
d-
rt i
Di
ls
Sc
ild
Ol
Te
Al
Ch
Social spending per person in constant 2000 rands
1995 2000 2006
4079
4 500
Benefits levels in 2000-Rand per person
4 000
3 500
2946
2829
2788
2715
3 000
2435
2232
2 500
2010
1987
1965
1879
1792
1643
2 000
1557
1551
1540
1538
1334
1 500
1 000
500
0
tal
3
5
1
2
4
ile
tile
ile
ile
tile
To
i nt
int
int
in
in
Qu
Qu
Qu
Qu
Qu
Source: Fiscal incidence study, National Treasury, 2009
92009 BUDGET REVIEW
Rising disease burden Towards a Fifteen Year Review also highlights several areas of
undermines gains in living weakness. A rising disease burden has placed severe strain on the
standards public health system, to the point where many of the benefits
associated with improved living conditions are undermined – for
example, in high rates of infant and maternal mortality. In particular,
rising HIV infection rates and increased Aids-related deaths have
placed a massive social strain on many communities. Unemployment
remains high, with over one-third of young people out of work. South
Africa has one of the highest crime rates in the world and, despite
some successes in reducing crime, citizens remain fearful.
While access to services While access to services, including primary health care, has improved,
has improved, the quality of the quality of these services remains basic and is often inadequate. For
services is often inadequate example, there are 25 per cent more learners in schools today than in
1990, but performance in maths and literacy tests lags comparable
countries. While more than 70 per cent of pregnant women visit a
public clinic at least once during their pregnancy, infant and maternal
mortality rates remain high.
In summary, government’s track record over the past 15 years has
been impressive given the significant challenges faced by the new
democratic state. Nevertheless, much more can be done given the
resources available. Improved public-sector performance is a key
policy priority over the three-year medium-term expenditure
framework (MTEF).
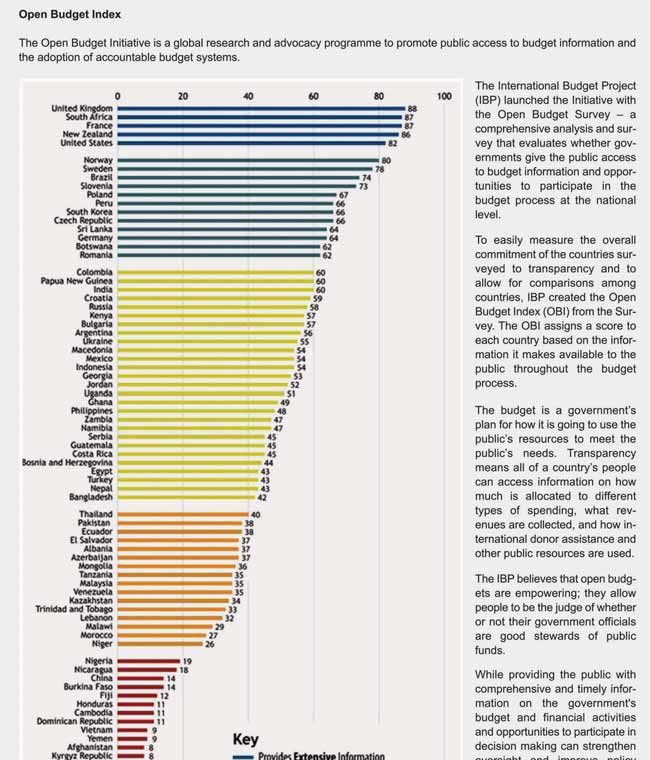
South Africa now ranks 2nd Transparency, openness and oversight are also important elements of
in the world in the improving public-sector performance. Over the past 15 years South
transparency of its budget Africa has also made good progress in improving the transparency of
the budget process and the usability of the budget documentation.
South Africa now ranks second in the world on the Open Budget
Index, which measures the transparency and quality of budget
information. Such information, for use by citizens and the legislature,
can help to improve accountability, efficiency and performance by
government departments and state-owned entities.
10CHAPTER 1: A TIME OF CRISIS, A WINDOW OF OPPORTUNITY
Source: www.openbudgetindex.com
112009 BUDGET REVIEW
Overview of the 2009 Budget
Macroeconomic overview
Chapter 2 presents government’s macroeconomic forecasts, discusses
key policy challenges and analyses recent economic trends.
Macroeconomic forecasting The chapter discusses in some detail the evolution of the international
is complex given frequent economic crisis, how South Africa is affected, government’s
revision of global growth economic policy responses and the medium-term outlook. It notes the
projections complexity associated with this year’s macroeconomic forecast given
the frequent revision of global growth projections as a result of the
global slowdown.
This synchronised downturn affects South Africa through declining
demand for commodities, falling prices and deterioration in the
financing environment. Interest rates remain relatively high, asset
prices are falling and consumer confidence has weakened. Household
consumption expenditure is expected to decline by 0.2 per cent in
2009 following an increase of more than 6 per cent a year over the
previous four years. Growth in private-sector fixed investment, a key
driver of economic expansion over the past four years, is likely to
slow during 2009.
After four years of economic growth of more than 5 per cent a year,
domestic GDP growth slowed to 3.1 per cent in 2008. Growth of
1.2 per cent is expected in 2009.
Table 1.3 Macroeconomic overview
Real growth 2008 2009 2010 2011
Percentage Estimate Forecast
Household consumption 2.5 -0.2 1.9 3.2
Capital formation 11.5 3.7 5.7 9.0
Exports 2.1 -1.4 3.3 4.9
Imports 3.2 -3.7 6.7 7.7
Gross domestic product 3.1 1.2 3.0 4.0
Headline CPI inflation 11.6 5.8 5.3 4.7
Balance of payments current -8.1 -6.3 -6.9 -6.9
account (percentage of GDP)
The current account deficit As the global economy begins to recover towards the end of 2009 and
is expected to narrow household consumption benefits from lower inflation and interest
significantly in 2009 rates, growth is expected to climb to 3 per cent in 2010 and 4 per cent
in 2011. A continuing expansion of public-sector fixed investment and
benefits flowing from the 2010 FIFA World Cup will also support the
recovery. The current account deficit is expected to narrow to about
6 per cent this year due to smaller dividend payments to international
investors and lower demand for imports, partly due to the weaker
currency. Nevertheless, the external deficit is likely to remain sizeable
owing to imports required for infrastructure investment.
Fiscal and tax policy
Chapter 3 presents a detailed breakdown of government’s fiscal stance
and the public finance accounts. Chapter 4 discusses revenue trends
and tax policy changes.
12CHAPTER 1: A TIME OF CRISIS, A WINDOW OF OPPORTUNITY
Government’s countercyclical fiscal stance provides a boost to the Fiscal policy aims to sustain
domestic economy at a time when global demand is weak. South spending growth, especially
Africa is in a position to expand public spending despite the decline in in public investment
revenue projections because public debt is low and the budget was in
surplus until last year.
Public spending continues to rise in real terms, with strong growth in
infrastructure spending, labour-intensive employment programmes,
social transfers to households and social services. A larger
contingency reserve of R38 billion allows for the fiscal flexibility
required to adjust to unanticipated economic risks, to respond to
natural disasters, to further support employment programmes and to
bolster the resources of development finance institutions.
Public spending is complemented by a significant expansion in Total public investment in
infrastructure investments by the large state-owned enterprises. infrastructure totals
Eskom, Transnet, the Airports Company of South Africa, the South R787 billion over MTEF
African National Roads Agency Ltd and entities in the water sector
plan to spend more than R397 billion over the next three years on vital
economic infrastructure, while general government is expected to
spend R391 billion on infrastructure over the same period. Financing
these investments during the present economic period will be more
challenging, prompting government to increase its level of support for
the state-owned enterprises.
Table 1.4 outlines the revenue and expenditure of the consolidated
government account, which covers national government and its
entities, provinces, extra-budgetary institutions and the social security
funds.
Given the higher cost of finance on global markets and the need for Consolidated national
state-owned enterprises to also access capital markets, government government budget deficit
will keep a check on the expansion of the deficit. The consolidated of 3.8% of GDP in 2009/10
government budget deficit is projected to rise to 3.8 per cent in
2009/10 and is projected to come down once the economy recovers
and revenue growth increases. For this reason, the budget also
includes measures to ensure greater efficiency and to discontinue
ineffective spending programmes.
Table 1.4 Consolidated government budget
R billion 2008/09 2009/10 2010/11 2011/12
Gross tax receipts 655.8 692.6 757.1 832.5
plus: Non-tax receipts 70.8 75.7 83.2 91.0
less: SACU transfers -28.9 -27.9 -26.2 -27.9
Total receipts 697.7 740.4 814.1 895.6
Current payments 431.1 472.4 516.9 558.1
of which: Interest 58.0 60.0 66.5 73.8
Transfers and subsidies 239.7 294.6 304.6 304.4
Payments for capital assets 50.3 61.3 66.2 70.6
Contingency reserve – 6.0 12.0 20.0
Total payments 721.1 834.3 899.7 953.1
Budget balance -23.4 -94.0 -85.6 -57.4
Percentage of GDP -1.0% -3.8% -3.2% -1.9%
Gross domestic product 2 304.1 2 474.2 2 686.3 2 953.0
132009 BUDGET REVIEW
Revenue collection under Tax revenue grew by more than 15 per cent a year between 2004 and
pressure 2007. In the last three months of 2008, revenue growth slowed
sharply, reflecting tougher conditions in the economy. As a result, the
revenue estimate for 2008/09 is being revised downwards by
R14.4 billion. Revenue estimates for 2009/10 are also lower than
estimated in October 2008. Consolidated national budget revenue is
expected to decline as a share of GDP in 2008/09 and 2009/10.
Substantial personal income The personal income tax schedules are revised. Relief for individuals
tax relief amounting to R13.6 billion is provided to take account of wage
inflation, including compensation for the higher-than-anticipated
inflation rate in 2008. For several years, fuel taxes have fallen as share
of the pump price. This year, the general fuel levy and the Road
Accident Fund levy are increased more sharply, taking into account
the general reduction in fuel prices. Specific excise duties are
increased broadly in line with inflation.
Tax proposals support The tax proposals also support government’s increased policy focus
initiatives to protect the on environmental initiatives that mitigate the impact of climate change
environment and promote sustainable development, energy efficiency and
investment in new technologies.
Asset and liability management
Chapter 5 discusses developments in the debt markets, government’s
debt portfolio, borrowing plans, contingent liabilities, credit risk and
financial management of state-owned enterprises.
Financing strategy changes Following several years of either small deficits or budget surpluses,
in light of higher borrowing government’s borrowings increased in 2008/09 and are set to grow
requirement over the next three years as a result of slower revenue growth,
sustained public spending increases and support to state-owned
enterprises. Net loan debt of national government is projected to rise
from 22.6 per cent of GDP in 2008/09 to 27.4 per cent in 2010/11.
Despite this increase, debt service costs are projected to remain
roughly constant as a share of GDP. Lower interest rates and active
debt swap and refinancing programmes will help keep borrowing
costs down. As the economy recovers and revenue growth picks up,
the borrowing requirement is expected to fall.
As a result of the global financial crisis, access to foreign finance has
become much scarcer and more expensive. For this reason,
government’s financing strategy is premised mainly on borrowing in
South Africa’s liquid and deep capital market, though a moderate
level of external financing is planned.
Government will support Government is also working actively with state-owned enterprises to
state-owned entities to raise ensure that their capital investment programmes are financed at
capital to fund investments competitive rates. Government guarantees to state-owned enterprises
are set to increase. Eskom has received a guarantee for R176 billion of
its existing and new debt. Other requests will be evaluated on a case-
by-case basis. The National Treasury is also working with these
entities to sequence loan issuances to avoid undue pressure on
domestic capital markets.
14CHAPTER 1: A TIME OF CRISIS, A WINDOW OF OPPORTUNITY
In addition to greater support to the development finance institutions, New partnerships with the
government is also exploring partnerships with the private sector to private sector being
facilitate low-cost housing development as well as risk-sharing on explored
large capital projects.
Table 1.5 below shows the outlook for government’s debt and
projected debt-service costs.
Table 1.5 Projected state debt and debt costs of national
government
R billion 2008/09 2009/10 2010/11 2011/12
Net loan debt (end of year) 520.7 634.6 728.1 810.3
Percentage of GDP 22.6% 25.6% 27.1% 27.4%
Net domestic debt 425.5 527.3 616.8 690.3
Foreign debt 95.2 107.3 111.3 120.0
State debt cost 54.3 55.3 60.1 66.8
Percentage of main budget 8.9% 8.6% 8.5% 8.6%
revenue
Percentage of GDP 2.4% 2.2% 2.2% 2.3%
Social security
Over the past five years, government’s social grants programme has The social grants system is
grown steadily and now covers about 13 million beneficiaries. The being expanded
social grants system is being expanded in three ways:
x Increasing the eligible age for the child support grant to children
up to their 15th birthday
x Revising the means test to cover a larger proportion of households
x Lowering the eligible age for men for the old age pension to 60.
The proposed extension of social grants is likely to bring an additional
2 million beneficiaries into the system. Spending on social assistance
is projected to rise by 10.2 per cent a year, from R71 billion in
2008/09 to R95 billion in 2011/12.
South Africa’s social insurance arrangement is made up of the Social security funds remain
Unemployment Insurance Fund (UIF), the Road Accident Fund (RAF) in surplus
and the Compensation Funds. Due to rising unemployment, the UIF
expects beneficiary numbers to grow by 7.3 per cent over the course
of the MTEF period. The UIF is considering proposals to extend the
length of benefits to take account of an expected increase in
retrenchments. The Fund’s financial position remains healthy, with
strong cash surpluses projected well into the future.
The RAF remains in a precarious financial position, with a significant
actuarial liability and about 297 000 cases still unprocessed. The RAF
levy increases by 17.5 cents a litre to 64 cents. This will allow further
progress to be made in reducing the claims backlog, but further reform
is required to put it on a sustainable footing.
The Compensation Funds remain in sound financial health. On a Compensation Funds are in
consolidated basis, the social security funds will continue to run good financial health
operating surpluses of about R10 billion a year over the MTEF period.
152009 BUDGET REVIEW
Social security reform task Government’s efforts to reform the retirement fund industry are
team is focusing on several focused on ensuring that low-income workers and those with periodic
key policy areas in 2009 incomes have access to affordable retirement insurance, while
improving the governance and cost-effectiveness of retirement funds.
The interdepartmental task team on social security and retirement
reform will continue its work in 2009, with a view to developing a
road map for introducing a national savings fund and broadening
income protection for workers. The task team will also consider and
provide advice on the insurance aspects of health care reform.
Medium-term allocations and the division of revenue
Extra R161 billion provided The 2009 Budget sustains strong growth in public spending. About
to extend service provision R161 billion is added to the spending plans of government over the
and account for higher costs next three years, both to counter the effects of higher costs as well as
to expand or extend service provision in key areas. The main budget
priorities include:
x Education
x Health
x Fighting crime
x Investing in rural development
x Extending basic household infrastructure.
In addition to these priorities, the budget places particular attention on
a series of cross-cutting priorities. These include public employment
programmes, improving the capacity of the public service and
mitigating the impact of climate change.
After adjusting for once-off spending such as the loan to Eskom, non-
interest expenditure grows by an average of 5.1 per cent in real terms
over the next three years.
Departments were asked to This year national departments were again asked to make efficiency
make efficiency savings and savings, to discontinue ineffective programmes and to reduce wastage.
reduce wastage About R19 billion has been removed from the spending plans tabled
in the 2008 Medium Term Budget Policy Statement, reflecting a
commitment by government to eliminate unnecessary expenditure.
Chapter 7 discusses additional allocations in the 2009 Budget in
detail. Table 1.6 summarises the consolidated government budget for
the next three years, which includes spending by provinces, the social
security funds, public entities and national government agencies.
16CHAPTER 1: A TIME OF CRISIS, A WINDOW OF OPPORTUNITY
Table 1.6 Consolidated expenditure
2008/09 2009/10 % Average
growth
Revised Budget 2008/09–
R billion estimate estimate 2011/12
General public services 48.1 51.3 5.2%
Defence 30.8 34.7 7.3%
Public order and safety 67.8 75.5 10.9%
Economic affairs 126.2 179.6 8.4%
Environmental protection 5.1 5.6 8.2%
Housing and community amenities 65.3 73.2 12.1%
Health 80.8 86.9 9.2%
Recreation and culture 9.9 7.7 -18.3%
Education 127.3 140.4 10.0%
Social protection 105.4 118.1 9.9%
Contingency reserve – 6.0
Non-interest expenditure 666.8 779.1 9.1%
State debt cost 54.3 55.3 7.2%
Total expenditure 721.1 834.3 9.7%
Chapter 8 describes the division of nationally collected revenue Transfers to provinces and
between the three spheres of government. Provinces receive an municipalities reflect focus
additional R47.8 billion over the next three years while municipalities on education, health,
receive R11.3 billion more. These transfers reflect government’s agriculture and housing
priorities, especially the focus on education, health, agriculture and
housing at a provincial level and water, sanitation and
electricity infrastructure at a municipal level.
Table 1.7 shows the division of revenue. Transfers to provinces grow
by 10.7 per cent a year while transfers to municipalities grow by
14.2 per cent a year. Chapter 8 also discusses aggregated provincial
budget trends.
Table 1.7 Division of revenue
R billion 2008/09 2009/10 2010/11 2011/12
National allocations 288.3 343.1 352.8 361.3
Provincial allocations 247.7 284.5 309.7 335.9
Equitable share 204.0 231.1 253.7 272.9
Conditional grants 43.7 53.5 56.0 63.0
Local government allocations 43.6 49.7 57.7 65.0
Total allocations 579.6 677.3 720.2 762.1
Changes to baseline
National allocations 17.3 45.1 32.1 24.3
Provincial allocations 6.7 13.3 12.8 21.7
Equitable share 4.6 5.6 7.4 11.8
Conditional grants 2.0 7.7 5.5 9.8
Local government allocations 1.8 2.0 2.8 6.4
Total 25.8 60.5 47.8 52.4
172009 BUDGET REVIEW
Conclusion
Sound public finances will The 2009 Budget is tabled during a deep global economic crisis with
help to sustain growth an uncertain trajectory. Political stability and a sound macroeconomic
during the more challenging framework have enabled South Africa to benefit from global growth
period ahead patterns over the past seven years. To make further progress, the
country will have to ensure macroeconomic stability while tackling
the constraints to faster and shared growth. Government’s economic
priorities include sustaining infrastructure spending, using
countercyclical fiscal policy to cushion the economy against falling
demand, and ensuring that measures taken today enhance
competitiveness and broaden opportunities for all South Africans in
the years ahead. Over the short term, government will work to sustain
output and employment, and protect poor and marginalised
communities, while focusing on long-term growth and sustainability.
Meeting the challenges ahead will require a capable and effective
state, new ideas and new approaches to solving problems, new
partnerships, and a willingness to adapt to changing circumstances,
together with confidence in the choices we have made.
Other budget documentation
In addition to the Budget Review, the National Treasury produces a
series of other documents relating to the Budget:
x The Budget Speech delivered by the Minister of Finance on Budget
Day outlines the main policy features of the budget.
x The Division of Revenue Bill sets out the division of nationally
raised revenue across the three spheres of government.
x The Appropriation Bill sets out the amounts to be appropriated by
Parliament for each national vote, and the purpose of each
programme.
x The Estimates of National Expenditure provides detailed
information on allocations to national departments, key policy
developments and measurable objectives for each programme. This
year the Estimates covers significantly more public entities. After
the tabling of provincial budgets, separate chapters of the
Estimates will be published for each vote, providing more detailed
information from provincial budgets and public entities.
x The Estimates of National Revenue sets out the main revenue
estimates both before and after tax policy changes.
x The People’s Guide is a popular summary of the budget produced
in all 11 official languages, and in Braille.
Two annexures to the 2008 Budget Review are available on the
National Treasury website: Annexure W1 (Explanatory memorandum
to the division of revenue) and Annexure W2 (Structure of the
government accounts).
These documents and other fiscal and financial publications are
available at: www.treasury.gov.za.
18You can also read