Water load-shedding in Beaufort West, South Africa: Lessons learnt and applied during the 2009-2011 and 2017-2019 droughts - Preprints ...
←
→
Page content transcription
If your browser does not render page correctly, please read the page content below
Preprints (www.preprints.org) | NOT PEER-REVIEWED | Posted: 1 July 2021                            doi:10.20944/preprints202107.0027.v1

                  Article

                  Water load-shedding in Beaufort West, South Africa:
                  Lessons learnt and applied during the 2009-2011 and
                  2017-2019 droughts
                  Wessel P. Visser 1

                                               1   Department of History, Stellenbosch University, Stellenbosch 7602, South Africa

                                               * Correspondence: wpv@sun.ac.za

                                               Abstract: Increasing and prolonged droughts have become a feature of the South
                                               African environmental landscape. This article investigates the sustainability of
                                               water procurement to the rural town of Beaufort West and the reasons for the
                                               town’s water provision crises during the droughts of 2009-2011 and 2017-2019.
                                               Innovative solutions were reached to alleviate the serious water-shortages during
                                               these droughts. Data to illustrate population increases and precipitation
                                               decreases, which impacted on the town’s water resources, was collected from
                                               census records of Statistics South Africa and from the Department of Water and
                                               Sanitation, respectively. A number of risk factors contributed to the town’s water
                                               crises, e.g. unsustainable water extraction at times of serious droughts, poor water
                                               monitoring, metering and attention to leakages, an expansion of informal
                                               settlements within the municipal boundaries of Beaufort West, as well as annual
                                               rainfall patterns that became increasingly unpredictable. The article concludes
                                               that water resource development had not kept pace with demand, therefore water
                                               infrastructure should be built with enough capacity to cope with regular dry
                                               periods. Equilibrium should be reached between the water expectations of the
                                               community and water availability to avoid future social instability in water-
                                               stressed towns such as Beaufort West.

                                               Keywords: Beaufort West, drought, Gamka Dam, boreholes, water load-
                                               shedding, reclamation plant, municipality, bottled water

                                               1. Introduction
                                                    Increasing and prolonged drought conditions have prompted
                                               urgent research on the sustainability of water procurement and provision
                                               to rural communities in the arid interior of South Africa. In turn the
                                               research stimulated much relevant literature. As early as 2009 a study by
                                               Le Maitre et al. [1] focused on the challenge to provide adequate water
                                               resources in the water-scarce region of the Little Karoo. Holloway et al.
                                               [2] published a report on the acute water shortages during the 2009-2011
                                               drought in the Central Karoo. Meissner and Jacobs-Mata [3] probed the
                                               South African water sector’s long-term national drought policy and
                                               strategy to improve the country’s response to future droughts. Schreiner
                                               et al. [4] investigated the economic impacts of drought and water
                                               shortages on agricultural, livestock, tourism, mining, and business
                                               during the period 2011-2016, while research by Tfwala et al. [5]
                                               determined the occurrence and severity of droughts and interannual

            © 2021 by the author(s). Distributed under a Creative Commons CC BY license.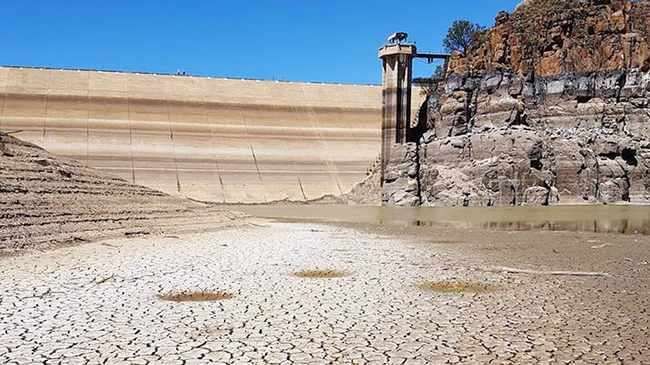
Preprints (www.preprints.org) | NOT PEER-REVIEWED | Posted: 1 July 2021 doi:10.20944/preprints202107.0027.v1
rainfall variability trends in the Ghaap plateau, Northern Cape Province,
South Africa. Zhang et al. [6] presented a conceptual framework within
which numerical modelling of aquifer systems is operated to improve
water security. And Visser [7] investigated the chronology of Cape
Town’s 2015-2018 drought and the various measures imposed by the city
council to preserve dwindling water supplies to try and avert the so-
called Day Zero scenario when its water resources would run out.
The studies mentioned above focused on the problems experienced
by predominantly agricultural communities under the strain of serious
droughts and efforts to provide water security in arid regions such as the
Karoo, the Northern Cape, the West Coast and even Cape Town as a city
with limited freshwater resources. However, there is a lacuna in the
literature on water studies that focus on the responses and dynamics of
rural town communities with a history of coping with water provision
struggles during times of severe drought duress. This article investigates
the reasons for the water provision crises of the town of Beaufort West in
the Central Karoo region during the droughts of 2009-2011 and 2017-2019
and the innovative solutions reached to alleviate the problems of water
scarcity.
2. Research Methods
The study is based on a comprehensive research into the history and
processes of water provision to water-stressed rural towns in South
Africa. For the Beaufort West case study municipal council minutes,
reports and documents were scrutinized in the Western Cape Archives
and Records Service (WCARS) in Cape Town. This research material was
complemented with data from various published scientific articles and
reports, press releases and media reports pertaining to Beaufort West’s
water woes.
For the graph indicating population growth (see Figure 1) data was
collected from the official census records, dating from 1921 to 2011 via
Statistics South Africa (Stats SA). To collect data for Beaufort West, census
years were used when there was a count of the full population [8]. The
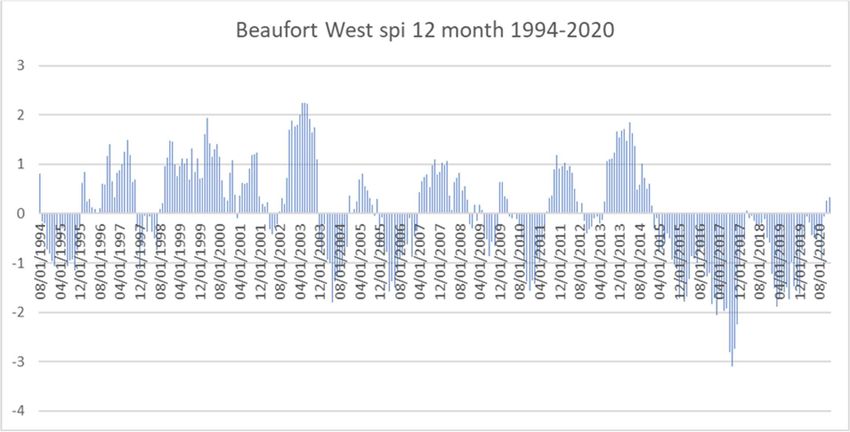
graphs in Figures 2 and 3 were compiled using data collected from the
Department of Water and Sanitation (DWS). In Figure 2 the annual total
rainfall for each year from 1993-2020 was calculated, adding them and
dividing the total by the number of years for which data was provided.
In Figure 3 the DWS data was compiled to and run through a Standard
Precipitation Index (SPI), “which for any location is based on the long-
term precipitation record for a desired period” [9]. The SPI was used to
calculate the average rainfall in comparison to the previous 12 months
over a 40 year period. The SPI generally notes years from 0 to -1 as being
low rainfall years, -1 to -2 as being severe drought years and from -2 to -
3 as an extreme drought [10].
3. Geographical, demographic and climatological features of Beaufort
West
Beaufort West was “proclaimed a town in 1818 and was the first
town in South Africa to receive municipal status as early as 1837”. The
town is situated in the semi-arid central Great Karoo, 491 km from Cape
Town and 961 km from Johannesburg and is “the major administrative,
agricultural and economic centre of the region. The town also serves as a
major road, and rail transit and crossing to other towns in South Africa.
Beaufort West lies in a hollow between two hills and is flanked by the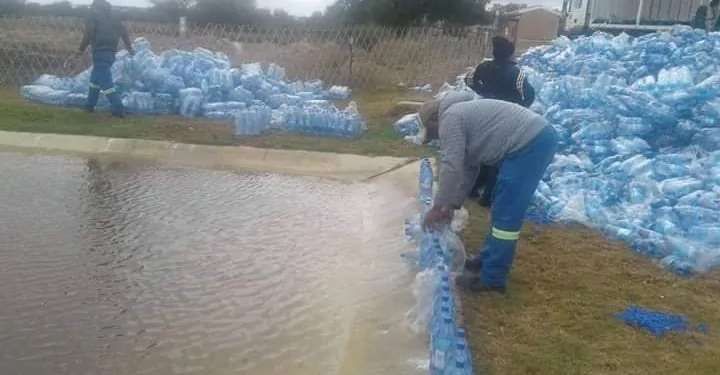
Preprints (www.preprints.org) | NOT PEER-REVIEWED | Posted: 1 July 2021                 doi:10.20944/preprints202107.0027.v1

                                            Gamka River in the west and the Kuils River in the east. Both rivers,
                                            which became semi-perennial as a result of urbanization, flow in a
                                            generally north to south direction”. With an average annual rainfall of a
                                            mere 165 mm the municipality has two main sources of water: borehole
                                            water and surface runoff that is captured in two dams. The Springfontein
                                            Dam, an irrigation reservoir, was completed in 1869 but has run dry for
                                            several years because of diminishing precipitation. The Gamka Dam,
                                            completed in 1955, which provides 45% of the town’s water supply, is the
                                            town’s major freshwater reservoir but has been experiencing severe
                                            water-stressed conditions in recent years. Therefore, the town’s water
                                            supply is heavily reliant on rainfall.
                                                  Groundwater, extracted from boreholes, “played an increasingly
                                            important role in the development of Beaufort West. The town is known
                                            for its so-called ‘dyke’, a useful barrier against the southward migration
                                            of underground water because it effectively compartmentalizes the
                                            groundwater flow. The ‘dyke’ is an inclined sheet or sill of dolerite which
                                            dips into the north at an approximate 17˚ angle. The sheet outcrops in an
                                            approximately east-west direction. A certain amount of water penetrates
                                            to depth to the north of the sheet as is localized in the northern part of
                                            Beaufort West in what might be regarded as an underground reservoir
                                            and where the relatively impenetrable dolerite sheet forces the water
                                            towards the surface. South of the dolerite sheet, the underground water
                                            supply is not sufficient to be extracted. Consequently, most springs are
                                            situated towards the northern parts of town and in periods of drought
                                            this was the area where the municipal council was prone to drill new
                                            boreholes in search of more water resources” [11-14].

                                            3.1. Underlying factors towards the droughts of the 2021 century

                                                  Throughout its municipal history Beaufort West was plagued by
                                            occational floods and recurring periods of prolonged drought. Visser [15]
                                            and Vivier and Vivier [11] determined that during the first 143 years of
                                            municipal record keeping serious droughts appeared in 1823, 1827, 1856-
                                            1859, 1876-1878, 1898, 1915-1916, 1926, 1942-1949, 1951 and 1955-1966. In
                                            fact, Beaufort West’s first water shedding appeared in January 1946,
                                            amidst the 1942-1949 drought, when the situation became so critical that
                                            water provision to inhabitants was cut on certain days and hours. And in
                                            October 1949 water rationing was imposed so that the daily water supply
                                            was restricted to two hours only [16].

                                                  As explained above, groundwater supplies would become crucial in
                                            periods when the town suffered from inevitable drought and water
                                            duress. Between 150 and 200 boreholes were drilled north of the dolerite
                                            sheet by the late 1940s in search of water [15] and according to Erasmus
                                            [12] 18 were sunk since 1985 with an average depth of 49.83 metre. Xu et
                                            al. [14] established that “the importance of groundwater has increased
                                            from 50% in 1978 to 55% in 2007”.

                                                 A major game changer in Beaufort West’s water woes was the
                                            introduction of a water-borne sewerage system. Although such a
                                            sewerage scheme was considered as early as 1963 by the municipal
                                            council the project eventually started in 1975 and was completed in 1978.
                                            “The installation of flush toilets and running water to poor
                                            neighbourhoods has increased water demand and the successful service
Preprints (www.preprints.org) | NOT PEER-REVIEWED | Posted: 1 July 2021 doi:10.20944/preprints202107.0027.v1
provision had the unintended consequence of promoting futher in-
migration of inhabitants from under-served areas” [2,12,17]. Secondly,
sustained urban growth between 1921 and the early 2000s had
implications for municipal water demand in Beaufort West (see Figure 1).
This growth was also “being accompanied by significant town expansion
from 1945 to 2010” [2]. According to Nel et al. [18] “the growth of larger
towns in the Karoo can be attributed to their jobs, touristic and retirement
appeal. Such towns are servicing an enlarged hinterland and a larger
resident population while also providing services to an external market
driven by tourism and leisure in a ‘postproduction’ era”.
Field research by Holloway et al. [2] suggested that “heavy rain
patterns had shifted spatially in recent years”. According to information
gathered from local monitors “rainfall changes had taken place since the
1980s as rain began to fall predominantly over the town itself and not
over the Gamka Dam mountain catchment as before. This had
implications both for surface water supply, as well as access to
groundwater, due to slower rates of aquifer recharge”. These findings
concur with the data in Figures 2 and 3. Figure 2 indicates a declining
trend in rainfall figures since the early 2000s and the SPI findings (see
Figure 3) clearly show the severe drop in precipitation during the 2009-
2011 and 2017-2019 droughts.
According to Mishra and Singh [9] the droughts that hit Beaufort
West and its surrounding district in 2009-2011 and 2017-2017 can be
described in four categories:
1. “A meteorological drought which is defined as a lack of precipitation
over a region for a period of time.
2. A hydrological drought which is related to a period with inadequate
surface and subsurface water resources (lakes, reserviors, rivers,
streams and groundwater) for established water uses of a given water
resources management system. It affects non-agricultural activities
such as urban water consumption, ecosystem preservation, tourism
and recreation.
3. An agricultural drought which refers to a period with declining soil
moisture and consequent crop failure.
4. A socio-economic drought which is associted with failure of water
resources systems to meet water demands and thus associating
droughts with supply of and demand for water as anonomic good.
Socio-economic drought occurs when the demand for an economic
good exceeds supply as a result of a weather-related shortfall in water
supply”.
4. The drought of 2009-2011
Between 2009 and 2011, lower than normal rainfall was partly
responsible for falling reservoir levels across the Central Karoo as the
region expererienced its worst drought since 1944. Although the
municipality had introduced new water tariffs as early as July 2008 to
discourage high water consumption, restrictions became necessary inPreprints (www.preprints.org) | NOT PEER-REVIEWED | Posted: 1 July 2021 doi:10.20944/preprints202107.0027.v1
2009. These austerity measures were gradually increased as the water
crisis deepened and the Gamka Dam level dropped significantly. By May
2010 the water levels of the Gamka Dam, Beaufort West’s major water
resource, fell faster than expected, resulting in the reservoir emptying
completeley by September 2010 (See Figure 4). Consequently, 8 500
households, representing approximately 36 000 inhabitants, had to rely
on 36 boreholes which provided 3 700 kilo litre water per day. From
November 2008 to December 2010, groundwater levels within the town’s
important North End aquifer, normally recognised for its rapid recharge
capacity, dropped from 13 metre to 36 metre below ground level. On the
other hand, the extremely hot and dry conditions provoked an increasing
water demand.
The dire water sitaution called for emergency measures. Drastic
domestic water restrictions were imposed since January 2010 and a local
distaster declaration was issued for Beaufort-West. Each household was
restricted to 12 kilo litre per month. At first, if consumers exceeded 15 kilo
litre per day consumption, a 200% surcharge was applied to their water
accounts. In order to force down reduced water consumption, fines of
R1000 were issued to perpetrators of water quotas. The water-stressed
conditions prompted severe water load-shedding from September to
November 2010 when both ground and surface water supplies failed. The
town was divided into 12 wards staggered in 36 hour water-shedding
periods to allow for the recharge of the boreholes, although the central
business district, hospitals and industrial areas were not required to
comply with water load-shedding. Water was supplied through static
and roaming tanks and even household-level distribution of 5 litre
bottled water every 48 hours. This constituted a major logistics exercise
and 90 temporary municipal staff members were locally employed for the
operation. In addition, a country-wide public appeal was launched via
radio and newspapers to donate potable bottled water to Beaufort West
[2,19,20]. By January 2011 visitors and private companies had dropped
off 435 000 litres of bottled water [21].
In January 2011 Beaufort West received relief funding amounting to
R24 million from the National Treasury for South Africa’s first
reclamation plant. “The project was completed within six months and
was the country’s first direct potable reuse plant. Treated wastewater
effluent is conveyed directly to a water treatment facility for further
treatment to drinking water standard. Sludge from pit latrines is boiled
to kill pathogens and generate water vapour, which passes through
several filters for futher treatment”. This further treatment include
processes such as phosphate removal, pre-disinfection, ultra-filtration,
reverse osmosis and advanced oxidation. The plant can process 12.3 cubic
metres of sewage sludge and produce 10 800 litres of drinking water per
day. “The reclaimed water is pumped up to a service reservoir and
blended with water from the Gamka Dam, and the 36 boreholes in six
aquifers in a ratio of 1:4” [13,22,23].
Nine months later, in June 2011, the Gamka Dam began to refill after
substantial rainfall in its catchment associated with a cut-off low weather
system. Water restrictions were also finally lifted [2].
5. The drought of 2017-2019Preprints (www.preprints.org) | NOT PEER-REVIEWED | Posted: 1 July 2021 doi:10.20944/preprints202107.0027.v1
Beaufort West enjoyed a reprieve of five years before the next severe
drought hit the town again, with dire consequences for its inhabitants.
According to King and Karoly [24], 2017 was “set to be among the three
hottest years on record” and by November 2018 Beaufort West
experienced average day temperatures between 35 and 37˚C [25]. The
Gamka Dam ran dry by October 2017 already. Five more boreholes were
drilled in late 2017 when the municipality received R23 million in
emergency government funding. As in 2009-2011, water restrictions and
water load-shedding were imposed, although the industrial areas were
exempted from these measures for economic reasons. Water reduction
devices such as low-pressure valves were also installed at schools. The
reclamation plant, which had been the municipality’s trump card since
2011 during water-stressed conditions, could normally provide 16% of
the town’s water needs. During the first half of 2018 it had been the last
stable source of water but struggled to cope in the latter part of the year
because less water became available to be cleaned and turned into potable
water. The plant was designed to produce about 21.1 mega litres per day
but at that rate could only produce one mega litre. On top of it all, the
town’s main sewage pipe broke in August 2018, which stopped waste
going into the reclamation plant. This situation caused parts of the town
to run out of water. By September a local distaster declaration was issued
[25-29].
By 2018 and 2019, the R23 million government financial grant, e.g. to drill
new boreholes and pipe water from the region south of the town, proved
inadequate to meet the pressing water needs. Additional water was
supplied by passing tourists and non-governmental charity organisations
such as Gift of the Givers, Cape Town Water Warriors, as well as private
businesses who trucked in water (See Figure 5). Eventually, the
municipality distributed stocks of emergency water when each
household received two 5 litre containers of water per day [25,27,30,31].
By January 2019, due to the municipality’s forced distribution of
emergency water, its reserve stock was critically low: there were only 700
two litre bottles of water, donated by Gift of the Givers, left in its
emergency storage room [32].
Fortunately drought relief came for the inhabitants of Beaufort West
when good rains returned in May 2019 and the Gamka Dam rapidly filled
to 44% of its capacity. Water load-shedding was rescinded and water
restrictions lowered to more tolerable levels. According to the
municipality’s new water distribution system each household could
utilise up to 15 kilo litre water per month [33].
6. FiguresPreprints (www.preprints.org) | NOT PEER-REVIEWED | Posted: 1 July 2021 doi:10.20944/preprints202107.0027.v1
Population of Beaufort West from 1921-2011
25000
20000
Population
15000
10000
5000
0
1921 1936 1946 1950 1960 1970 1985 1991 2011
Year
Figure 1. This is a figure. Schemes follow the same formatting.
450
400
350
300
Rainfall(mm)
250
200
150
100
50
0
1993
1994
1995
1996
1997
1998
1999
2000
2001
2002
2003
2004
2005
2006
2007
2008
2009
2010
2011
2012
2013
2014
2015
2016
2017
2018
2019
2020
Year
Total Rainfall Mean
Figure 2. Beaufort West total annual rainfall 1993-2020.Preprints (www.preprints.org) | NOT PEER-REVIEWED | Posted: 1 July 2021 doi:10.20944/preprints202107.0027.v1
Figure 3. Beaufort West SPI 12 Month 1994-2020.
Figure 4. Gamka dam running dry 2009-2011, 2017-2019.Preprints (www.preprints.org) | NOT PEER-REVIEWED | Posted: 1 July 2021 doi:10.20944/preprints202107.0027.v1
Figure 5. Municipal workers filling a retaining pond with bottled water, circa. 2019.
4. Discussion: Lessons learnt and applied
There are many similarities between the Beaufort West droughts of
2009-2011 and 2017-2017 and how the municipal authority dealt with
severe water-stressed situations. During both drought periods austerity
measures were imposed, such as water load-shedding, local disaster
declarations were issued, emergency distributions of bottled water took
place and external public involvement were initiated through potable
water donations to Beaufort West. Although the consequences of the
2017-2019 drought have not been investigated officially as yet, the
findings of the report by Holloway et al. on the Central Karoo drought of
2009-2011[2] is, in essence, applicable to both drought situations.
According to Mahed [34], “unsustainable water extraction happened
in Beaufort West. On average water levels in the aquifer dropped by 25
metres over a period of twenty years due to more water being pumped
out of the aquifer than recharged”. A long lingering problem which
preceded the droughts was that the Beaufort West municipality “faced
difficulties in monitoring leaks and illegal abstractions due to outdated
equipment such as water meters and infrastructure”. Research by
Holloway et al. [2] revealed “widespread evidence of poor or non-
existent water monitoring, with municipal water use remaining
unaccounted for due to poor metering and leakages”. Awareness of the
town’s acute water situation was, however, “increased through other
measures, including the publication of names of high water users in local
newspapers”. A number of drought risk drivers were also identified
which served as warning signs for future drought situations. There was
an “increased water demand prior to the droughts that outpaced
available supply, an under-recognition and investment in Integrated
Water Resource Management (IWRM), including diversification of water
supply options, and a limited capacity to understand and plan for
concurrent drought and urban water scarcity risks. An important factor
that delayed early signal detection of escalating water shortage risk was
the inadequate understanding of what drought is and its interface with
water scarcity. For example, in terms of IWRM anticipatory investmentPreprints (www.preprints.org) | NOT PEER-REVIEWED | Posted: 1 July 2021 doi:10.20944/preprints202107.0027.v1
in new water infrastructure was severely limited as the Gamka Dam
suffered unaccounted water losses of approximately 52%”. As the oldest
municipality in South Africa Beaufort West “has an ageing and
crumbling infrastructure that is prone to frequent water bursts”. In
addition, “population growth and town expansion were not matched by
investments to address identified needs for improved water supply
development. In Beaufort West a major risk driver was that the
development of alternative water supplies had not kept pace with rising
local demand”.
In fact, the emergency demand for water involved “a tension
between sustainable water resource management and basic service
provision. The provision of housing and basic services to previously
disadvantaged communities was identified as a key measurable
municipal performance area”. Therefore, factors such as “a steady growth
in the provision of state housing, together with an expansion in both the
number of new and the size of existing informal settlements” within the
municipal boundaries of Beaufort West, all contributed to the critical
water-stressed conditions during the droughts of 2009-2011 and 2017-
2019. Overall, annual and seasonal rainfall patterns that became more and
more unpredictable were identified as a major drought risk driver. “The
depletion of both groundwater and supplies from the Gamka Dam
resulted in the municipality drawing on water supplies from the
Springfontein irrigation dam located in the town, with negative
consequences for local small farmers who faced reduced supplies”[2].
According to Meyer [21], “tourists who had been staying over in
Beaufort West’s guest houses had put extra pressure on the already
drained resources, which in itself put severe pressure on the water
supply. But the town economy needed the tourists, therefore they were
accommodated”. On the other hand, Holloway et al. [2] also identified
some adverse socio-economic impacts of the Beaufort West droughts as
the severe water restrictions and water shedding impeded the normal
flow of business. Bed and breakfast businesses outside of Beaufort West’s
town centre “did suffer a loss of clientele” and schools were also affected
by the lack of water. A local car wash was forced to close while abattoirs
suffered a down-turn in production. Being a water-intense industry, it
was forced to reduce the number of slaughtering days”. The severe water
restrictions and water shedding also impeded the normal flow of
restaurants at petrol stations. In response, one of these enterprises
installed two 10 000 litre water tanks to keep business running during
scheduled water shedding. This ensured that toilets flushed and dishes
could be washed at such spots along the busy N1 auto route between
Cape Town and Johannesburg. In addition, a borehole was sunk, in
anticipation that the meagre water supply to the central town might dry
up. “Sporting activities ceased due to a lack of available water to irrigate
the school fields. In addition, an olive grove, originally planted to
augment the income of one of the schools, died”, because of a lack of
irrigation water. Furthermore, the municipality “reported the adverse
effects of reduced grey water on the functioning of the sewerage system.
Poor households noted that their gardens ‘died’, although many
attempted to maintain these with grey water”. The research done by
Holloway et al. “indicated that home gardens augmented livelihoods
directly as a source of food or indirectly as an income source from
vegetable sales. The loss of home gardening as a key droughtPreprints (www.preprints.org) | NOT PEER-REVIEWED | Posted: 1 July 2021 doi:10.20944/preprints202107.0027.v1
amelioration strategy constituted an additional hardship for poorer
households”.
Matthews [22] discusses the pros and cons of Beaufort West’s
reclamation plant that was installed as a result of the 2009-2011 drought.
According to her, “the advantages of water reclamation are that it
conserves the available water supply, which reduces the need to abstract
more water from surface or groundwater sources, or build new dams, all
of which have environmental and financial costs. It also reduces the
volume of treated effluent discharged back into aquatic systems, where it
may degrade natural water quality and cause the ripple-effect of
ecological changes associated with nutrient enrichment. On the other
hand, water reclamation for drinking purposes is considerably more
expensive. Potable reuse plants employing reverse osmosis as a treatment
method have high energy costs, because the process relies on high-
pressure pumping to overcome osmotic pressure. The Beaufort West
reclamation plant uses the reverse osmoses process as part of a multiple-
barrier approach that also incorporates, as said, rapid sand filtration,
ultra-filtration, UV-hydrogen peroxide and final chlorination. Reverse
osmosis also pushes up costs because of highly concentrated brine,
produced as a by-product, which is difficult to dispose of. Fortunately,
the Beaufort West plant has some extra evaporation ponds available at
the wastewater treatment works and the volumes are reasonably low”.
5. Conclusions
In terms of its drought experiences in 2009-2011 and 2017-2019
Beaufort West faced the same problems that many of South Africa’s other
inland towns face in the new millennium [27]. Holloway, et al. [2]
ascertained that “the severity of these droughts in the Central Karoo was
amplified by interacting risk drivers that had progressively escalated the
risk of a wide-spread water shortage. These included greatly increased
water consumption prior to the onset of meteorological drought
conditions, both in agriculture and in a rapidly growing town population.
Prior to the drought emergency such conditions had been accompanied
neither by rigorous water demand management, nor systematic
investment in water infrastructure and the requisite technical capacity to
manage water supplies sustainably. Water resource development had not
kept pace with demand. These risks were further exacerbated by a lack of
systematic drought risk management planning”.
Muller [35] states that “South Africa’s rainfall has always been
variable and unpredictable” and claims that “reliable supplies can be
provided to urban water users if storage infrastructure is built with
enough capacity to cope with regular dry periods, but such infrastructure
has to be managed with a watchful eye on the ever-changing climate. If
water is withdrawn without restraint during a dry period, shortages will
be the likely outcome”. Muller [36] also argues that “drought research
should no longer view water availability as a solely natural, climate-
imposed phenomenon and water use as a purely socio-economic
phenomenon, and instead more carefully consider the multiple
interactions between both”. In similar vein, after the 2017-2019 drought,
H. Haarhoff, Beaufort West’s municipal manager, pleaded with the
community that a water-saving culture should be maintained while
remaining hopeful that a normal rainfall pattern would return [33].
It is quite clear that equilibrium should be reached between the
water expectations of the community and the water availability in water-Preprints (www.preprints.org) | NOT PEER-REVIEWED | Posted: 1 July 2021 doi:10.20944/preprints202107.0027.v1
stressed towns such as Beaufort-West. Klopper [37] observed that in
many Karoo towns local authorities will have to face a growing hostility
among inhabitants should water supply become frequently unavailable.
With ageing infrastructure, prolonged droughts and increasing
population growth many of these towns do not enjoy a seamless,
uninterrupted water supply anymore - a sure instigator of future social
instability in such communities.
Author Contributions: Not applicable.
Funding: This research received no external funding.
Data Availability Statement: Data utilized in this study is available at Statistics
South Africa http://www.statssa.gov.za/?page_id=4286&id=286 and on the
rainfall data website of the Department of Water and Sanitation,
https://www.dws.gov.za/Hydrology/Unverified/DetailRainfall.aspx?Station=J2R
004FW&Type=Flow&Rain=Y
Acknowledgments: The author acknowledges the support and assistance of
Rouxan Rademan, student research assistant, in the gathering of census and
rainfall data, respectively.
Conflicts of Interest: The author declares no conflict of interest.
References
1. Le Maitre, D.; Colvin, C.; Maherry, A. Water Resources in the Klein Karoo: The Challenge of Sustainable
Development in a Water-Scarce Area. South African Journal of Science 2009, 105, 39-48, doi:10.1590/S0038-
23532009000100019.
2. Holloway, A.; Fortune, G.; Zweig, P.; Barrett, L.; Benjamin, A.; Chasi, V.; de Waal, J. Eden & Central
Karoo Drought Disaster 2009 - 2011: The Scramble for Water; Stellenbosch University: Stellenbosch, 2012;
pp. 1-119, Available online:
http://www.riskreductionafrica.org/assets/files/EDEN%20and%20CENTRAL%20KAROO%20DROUGH
T%20DISASTER%202009.pdf (accessed on 8 April 2021).
3. Meissner, R.; Jacobs-Mata, I. South Africa's Drought Preparedness in the Water Sector: Too Little too
Late? South African Institute of International Affairs Policy Briefing 2016, 155, 1-4,
https://saiia.org.za/research/south-africas-drought-preparedness-in-the-water-sector-too-little-too-late/.
4. Schreiner, B.G.; Mungatana, E.D.; Baleta, H. Impacts of Drought Induced Water Shortages in South Africa:
Economic Analysis; WRC Report No. 2604/1/18; Water Research Commission: Gezina, South Africa, 2018;
pp. 1-85, Available online: http://www.wrc.org.za/wp-content/uploads/mdocs/2604%20Vol%201.pdf
(accessed on 22 June 2021).
5. Tfwala, C.M.; van Rensburg, L.D.; Schall, R.; Dlamini, P. Drought Dynamics and Interannual Rainfall
Variability on the Ghaap Plateau, South Africa, 1918–2014. Physics and Chemistry of the Earth, Parts A/B/C
2018, 107, 1-7, doi:https://doi.org/10.1016/j.pce.2018.09.003.
6. Zhang, H.; Xu, Y.; Kanyerere, T. A Modelling Approach to Improving Water Security in a Drought-
Prone Area, West Coast, South Africa. Physics and Chemistry of the Earth, Parts A/B/C 2019, 114, 102797,
doi:https://doi.org/10.1016/j.pce.2019.08.005.
7. Visser, W.P. A Perfect Storm: The Ramifications of Cape Town's Drought Crisis. The Journal for
Transdisciplinary Research in Southern Africa 2018, 14, 1-10, doi:doi:10.4102/td.v14i1.567.
8. Statistics South Africa. Beaufort West. Available online:
http://www.statssa.gov.za/?page_id=4286&id=286 (accessed on 2 May 2021).
9. Mishra, A.K.; Singh, V.P. A Review of Drought Concepts. Journal of Hydrology 2010, 391, 202-216,
doi:https://doi.org/10.1016/j.jhydrol.2010.07.012.
10. DWS Rainfall Data. Available online:
https://www.dws.gov.za/Hydrology/Unverified/DetailRainfall.aspx?Station=J2R004FW&Type=Flow&R
ain=Y (accessed on 10 December 2021).
11. Vivier, W.G.H.; Vivier, S. Hooyvlakte: Die Verhaal van Beaufort-Wes 1818-1968; Nasionale Boekhandel:
Cape Town, South Africa, 1970.Preprints (www.preprints.org) | NOT PEER-REVIEWED | Posted: 1 July 2021 doi:10.20944/preprints202107.0027.v1
12. Erasmus, G.J. Navorsingsverslag: Sub-streek: Die Sentrale Karoo: Gebied: Beaufort-Wes en Omgewing;
Stellenbosch University: Stellenbosch, South Africa, 1986.
13. Marais, P.; Von Durckheim, F. Beaufort West Water Reclamation Plant: Project. Water & Sanitation Africa
2012, 7, 20-25, doi:10.10520/EJC106532.
14. Xu, Y.; Mahed, G.; Van Wyk, Y.; Lin, L.; Sun, X.; Xiao, L.; Talma, S. Towards a Sampling and Monitoring
Protocol of Radioactive Elements in Fractured Rock Aquifers for Groundwater Re-source Security in Beaufort
West: Report to the Water Research Commission; WRC Report No. 1694/1/12; Water Research Commission:
Gezina, South Africa, 2012, Available online: https://www.researchgate.net/publication/272495076
(accessed on 27 November 2020).
15. Visser, W.P. Between Drought and Deluge: A History of Water Provision to Beaufort West, ca. 1858-
1955. New Contree 2020, 85, 1-21, http://hdl.handle.net/10394/36923.
16. WCARS, 3/BFW, Vol. 1/1/1/23, Minutes of a Special Council Meeting, 1946, pp. 401-402 and Minutes of a
Special Council Meeting, 1949, pp. 970-971; Western Cape Archives and Records Service: Cape Town,
South Africa.
17. WCARS, 3/BFW Box 263, Vol. 5/1/14, Louw, C.A.; Munisipaliteit Beaufort-Wes Rioolskema
Vorderingsverslag, 1977; Western Cape Archives and Records Service: Cape Town, South Africa.
18. Nel, E.; Taylor, B.; Hill, T.; Atkinson, D. Demographic and Economic Changes in Small Towns in South
Africa’s Karoo: Looking from the Inside Out. Urban Forum 2011, 22, 395, doi:10.1007/s12132-011-9131-z.
19. Burger, K. Gee jou Water vir Beaufort. Rapport, 12 December 2010, 5. Available online:
https://www.news24.com/news24/nuus24/suid-afrika/nuus/gee-jou-water-vir-beaufort-20101212
(accessed on 20 June 2021).
20. Steyn, T. Beaufort-Wes het weer genoeg water. Die Burger, 16 February 2011, 6. Available online:
https://www.news24.com/news24/nuus24/suid-afrika/nuus/gee-jou-water-vir-beaufort-20101212
(accessed on 20 June 2021).
21. Meyer, W. Water from sewage for Karoo town. Weekend Argus, 1 January 2011. Available online:
https://www.iol.co.za/news/south-africa/weste rn-cape/water-from-sewage-for-karoo-town-1006911
(accessed on 3 May 2021).
22. Matthews, S. Water – Precious Resource to be used Again, and Again and Again... Water Wheel 2015, 14,
26-29, http://www.wrc.org.za/wp-content/uploads/mdocs/WaterWheel_2015_3_May.pdf.
23. Sorensen, P. The Chronic Water Shortage in Cape Town and Survival Strategies. International Journal of
Environmental Studies 2017, 74, 515-527, doi:10.1080/00207233.2017.1335019.
24. King, A.; Karoly, D. 2017 is set to be Among the Three Hottest Years on Record. The Conversation, 6
November 2017. Available online: https://theconversation.com/2017-is-set-to-be-among-the-three-
hottest-years-on-record-86934 (accessed on 17 May 2021).
25. Lepule, T. Beaufort West Needs Water after Long Drought. IOL, 4 November 2018. Available online:
https://www.iol.co.za/weekend-argus/beaufort-west-needs-water-after-long-drought-17765948
(accessed on 14 April 2021).
26. Sonnekus, S. Beaufort-Wes nog nie hééltemal droog. Die Burger, 14 November 2017, 10.
27. Kings, S.; Ritchie, G. Beaufort West Runs out of Water. Mail & Guardian, 24 August 2018. Available
online: https://mg.co.za/article/2018-08-24-00-beaufort-west-runs-out-of-water/ (accessed on 14 April
2021).
28. Kruger, J. Beurtwater ingestel op Beaufort-Wes. Die Burger, 6 September 2018, 6.
29. Nienaber, M. Wes-Kaap Help dié Dorpe, Hospitale, Skole eerste met Boorgate. Die Burger, 25 November
2017, 11.
30. Kruger, J. Dag Zero kán voorkom word. Die Burger, 30 December 2017, 7.
31. Kruger, J. Beurtwater maak nog verskil in dorp. Die Burger, 7 September 2018, 7.
32. Somdyala, K. Beaufort West about to Run out of Emergency Bottled Water – Official. News24, 23
January 2019. Available online: https://www.news24.com/SouthAfrica/News/beaufort-west-about-to-
run-out-of-emergency-bottled-water-official-20190123 (accessed on 1 May 2021).
33. Kruger, J. Beurtwater in Beaufort-Wes opgehef en perke aangepas. Die Burger, 15 May 2019, 1.
34. Mahed, G. Explainer: What there is to Know about South Africa’s Aquifers. The Conversation, 5
September 2018, 1-3. Available online: https://theconversation.com/explainer-what-there-is-to-know-
about-south-africas-aquifers-102660 (accessed on 20 June 2021).
35. Muller, M. South Africa’s Real Water Crisis: Not Understanding What’s Needed. The Conversation, 6
November 2019. Available online: https://theconversation.com/south-africas-real-water-crisis-not-
understanding-whats-needed-126361 (accessed on 5 March 2021).Preprints (www.preprints.org) | NOT PEER-REVIEWED | Posted: 1 July 2021 doi:10.20944/preprints202107.0027.v1
36. Muller, M. Not all Droughts are the Same: Here’s what’s Different about Them. The Conversation, 19
November 2019. Available online: https://theconversation.com/not-all-droughts-are-the-same-heres-
whats-different-about-them-127238 (accessed on 16 April 2021).
37. Klopper, H. The Organised Expansion and Permanent Settlement of People in Boesmanland in
Correlation with Accessible Water Sources, 1760-c.1960. Stellenbosch University, Stellenbosch, South
Africa, 2020. Available online: http://hdl.handle.net/10019.1/108154You can also read