VOTING UNDER THREAT: EVIDENCE FROM THE 2020 FRENCH LOCAL ELECTIONS - Elsa Leromain, Gonzague Vannoorenberghe
←
→
Page content transcription
If your browser does not render page correctly, please read the page content below
VOTING UNDER THREAT:
EVIDENCE FROM THE 2020
FRENCH LOCAL ELECTIONS

Elsa Leromain,
Gonzague Vannoorenberghe

        LIDAM Discussion Paper IRES
        2021 / 16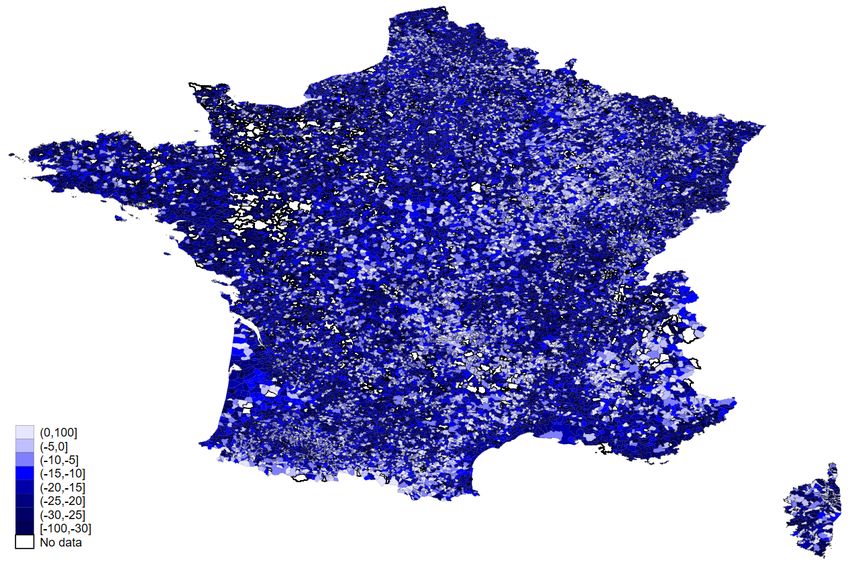
Voting under threat:
          Evidence from the 2020 French local elections
                                       ∗
                  Elsa Leromain                        Gonzague Vannoorenberghe
         IRES/LIDAM, UCLouvain and CEP                      IRES/LIDAM, UCLouvain

                                           July 8, 2021

                                              Abstract

         We study how Covid-related risk affected participation across the French territory
      in the March 2020 local elections. We document that participation went down dis-
      proportionately in towns exposed to higher Covid-19 risk. Towns that lean towards
      the far-right saw a stronger drop in turnout, in particular in the vicinity of clusters.
      We argue that these patterns are partly a result of risk perceptions, and not only of
      political considerations. We use data on the drop in cinema admissions in early March
      2020 and show that these went down more around infection clusters, especially in ar-
      eas with substantial vote for the far-right. Taken together, our findings suggest that
      the fear of Covid-19 may have been on average more prevalent among far-right voters,
      contributing to a drop in their electoral participation.

      JEL classification: D72
      Keywords: Electoral turnout, local elections, Covid-19, far-right

  ∗
   We would like to thank Guilhem Cassan and Marc Sangnier, as well as participants to the IRES lunch
seminar for useful comments. This work was supported by the Fonds National de la Recherche Scientifique
(FNRS) Projet de Recherche T025320F, “Globalization, inequality and populism across Europe”.

                                                  1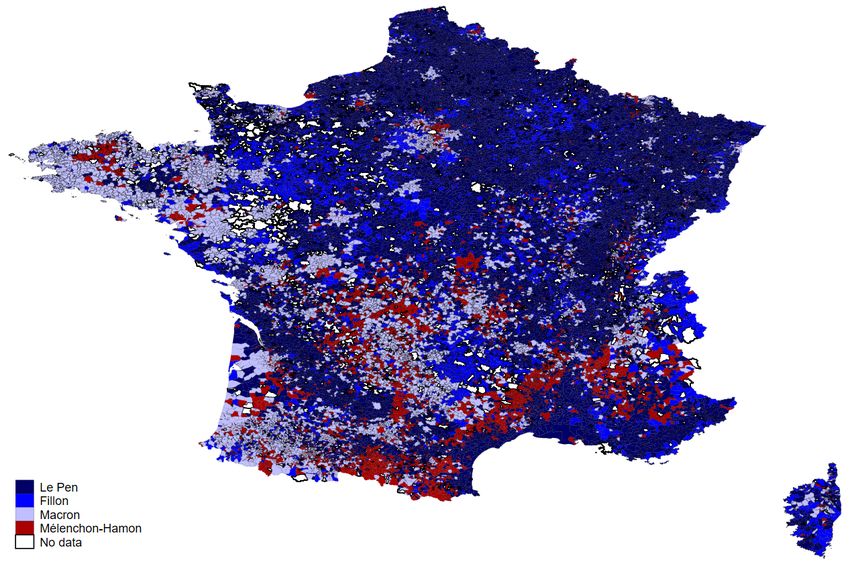
1     Introduction
      The first round of the French local elections of 2020 took place on March 14, when
      the country was just starting to grasp the severity of the covid-19 pandemic. All
      political parties expressed their support for maintaining the election but many voters
      were worried, or plain scared by the health situation1 . The nationwide turnout was
      44.75%, 18.8 percentage points lower than the previous election in 2014. The covid
      crisis is remarkable in that it made voting potentially life threatening, for oneself and
      for the others. While common in many countries, such a situation is unknown for most
      voters in advanced democracies. The timing of the French local election also makes
      it of particular interest. Data on infection at the time were unreliable, the disease
      transmission was poorly understood and protective equipment (hydroalcoholic gels,
      face masks) was in short supply. These circumstances provide a unique opportunity to
      study the factors that made voters respond to an unusual increase in the risk of voting.
          Our paper first establishes that towns more exposed to factors of risk linked to
      the pandemic saw a larger drop in turnout. We construct a group of towns identified
      as clusters in the media before the election and of towns connected to these clusters,
      which we measure by commuting patterns (or alternatively by geographic proximity).
      Together, these form our group of relatively more exposed towns given the information
      at the time. We show that the drop in turnout between 2014 and 2020 was significantly
      higher in exposed towns, in particular if they also had a high proportion of people aged
      60 or above, a known risk factor at the time. We also show that, conditional on our
      covariates, exposed towns had a similar evolution of turnout in previous local elections
      as the rest of the country, whether their population is old or not. Taken together,
      this suggests that voters did respond to factors influencing the known risk of voting.
      We confirm the risk interpretation by additionally looking at the evolution of cinema
      admissions between early March 2019 and early March 2020. We show that admissions
      went down more in cinemas close to identified clusters. Cinema admissions are inde-
      pendent of political considerations but should be correlated with the perceived risk of
      going out. The similarity of our results for electoral turnout and cinema admissions
      points to perceived risk as the main driver of the shift in the former.
          We also document the determinant role of political affinity in explaining the sub-
      jective perception of the pandemic risk. We find that towns in which Marine Le Pen,
      the far-right candidate, came first in the 2017 presidential election (short: “far-right
      towns”) saw a stronger decrease in turnout, in particular among exposed towns. This
  1
   In a survey conducted on the days after the elections, the CEVIPOF showed that 57% percent of those
who did not vote stated the coronavirus as a reason for abstaining.

                                                  1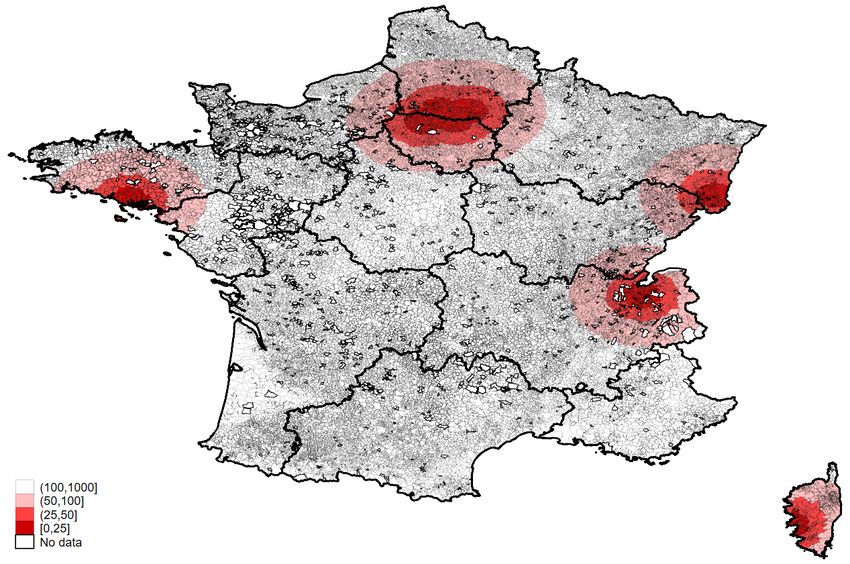
result holds conditional on observable measures of the risk and on a number of socio-
       demographic factors at the town level2 . It is robust across specifications and sub-
       samples, and cannot be explained by specific pre-trends in participation in far-right
       towns. One possibility is that far-right voters in France exhibit on average a higher
       degree of risk aversion, and respond more to the same increase in risk than other towns.
       Another is that they were more prone to lose faith in the political system due to the
       covid-crisis, or were less attached to voting and responded more to a given change in
       risk perception. To further disentangle the channels, we show that cinema admissions
       went down more in cinemas close to identified clusters, particularly so if the surround-
       ing towns were far-right towns. We take this as evidence that the subjective perception
       of risk can at least partly explain the differential response of far-right towns in terms
       of turnout.
          Our analysis relates to the very recent but quickly expanding literature on the effect
       of the Covid-19 pandemic on electoral participation for example in regional election
       in Spain (Fernandez-Navia et al., 2021) or presidential elections in Malawi (Chirwa
       et al., 2021). A contemporaneous paper by Noury et al. (2021) also examines how
       participation in the French municipal elections of 2020 reacted to the risk of catching
       the disease. While we differ slightly in our sample and implementation, we confirm
       that participation went down more in towns that were close to identified clusters and
       particularly so for towns with a high share of older voters. We however differ from these
       studies in two major ways. First, we we emphasize the determinant role of far-right
       voters in shaping these patterns. Second, using cinema admissions, we document that
       this may be driven by differences in perceived risk rather than political considerations.
          Our results also speak to the literature linking political preferences to the attitude
       towards risk or fear. Campante et al. (2020) show that the fear of the Ebola outbreak
       before the 2014 mid-term elections in the U.S. did affect voter turnout and that Repub-
       lican candidates were strategically exploiting this fear. Makridis and Rothwell (2020)
       find that, in the United States, Republicans are less likely to social distance, to self-
       isolate, and to wear masks. Adam-Troian et al. (2020) argue that the fear of the virus
       made voters turn to more conservative parties in the French municipal elections, while
       Fernandez-Navia et al. (2021) that voters turned more to nationalistic parties in the
       Basque country in July 2020. We also relate to the literature in political psychology
       showing how the need to manage uncertainty or threats correlates with conservatism
       or extremism (see e.g. Jost et al. (2007)).
   2
    Little was known about risk factors beyond age at the time and the few health-related characteristics
that were mentioned, such as obesity, diabetes or cancer are unlikely to be related with political affiliation
once we control for socio-demographic factors.

                                                      2
To our knowledge, three other papers look specifically at the context of French local
       elections in 2020. Two of them study the health impact of the elections, in terms of
       the spread of the disease (Cassan and Sangnier, 2020) and of risk for politicians (Bach
       et al., 2021). Giommoni and Loumeau (2020) on the other hand show that strong
       lock-down restrictions in the spring of 2020 favoured incumbent mayors in the second
       round of the election.
           Our paper is structured as follows. Section 2 gives some background about the
       French municipal elections and the health situation in March 2020,and presents our
       hypotheses. Section 3 studies the causal impact of the pandemic on turnout while
       Section 4 turns to the mechanisms, with a focus on cinema admissions. Section 5
       concludes.

       2      Background and hypothesis
       2.1     The French local elections and the epidemic percep-
       tion early March 2020
       The French “municipales” elections take place every 6 years in March. Registered voters
       elect the members of the city council by direct universal suffrage3 . The city council is in
       charge of the general affairs of the city. Specifically, it votes the city budget, it admin-
       isters the city public services and infrastructures (parks, roads, schools), it promotes
       the city economic activity, and it subsidizes local charities. French voters are relatively
       attached to local elections. As shown in Figure 1, while nationwide participation to
       local elections gradually decreased between 1990 and 2014, it is systematically above
       participation at parliament or regional elections.4
           In 2020, the elections took place under unusual circumstances. While Covid-19
       emerged in China in December 2019 before spreading in Europe in February 2020, by
       early March the centre of the epidemic had shifted from China to Europe where the
       rise in cases was steep. On February 26th 2020, the first French Covid patient - a
       teacher working in Crépy-en-Valois (Oise) - died in an hospital in Paris. The virus was
       then found in different French towns. There was no official comprehensive list of towns
       constituting core clusters and the official data at the time on the exact number of cases
       locally were extremely scarce and unreliable. The French media however extensively
   3
      The rules to elect the members of the city council differ slightly between towns above and below 1,000
inhabitants. Each voter can either choose a list with the possibility to remove some candidates in small
towns, while he picks one of the registered lists as it is in towns of at least 1,000 inhabitants.
    4
      Participation level is computed as casts voters over registered voters as typically done in official French
figures.

                                                       3
Figure 1: Turnout in the first round of French election
80
70
60
50
40
1990 2000 2010 2020
Year
Presidential Parliament
Local Regional
covered the emergence of new cases and is the most accurate representation of the
information that the French population had at the time. On March 6 2020, France
Bleu -a public regional radio channel which has strong ties with local administration -
provided a list of all core clusters at the time on its website based on its investigation
on the ground. We find in this list: four towns in Oise area (Creil, Crépy-en-Valois,
Vaumoise, Lamorlaye, Lagny-le-sec), three towns in Brittany (Auray, Cra’ch, Carnac),
Ajaccio in Corsica, la Balme de Sillingy in Savoy, Méry-sur-Oise in the North of Paris
and Mulhouse in Alsace. Official decrees by local authorities forbade public gatherings
in most of these clusters early March. In parallel, the acute health situation in Northern
Italy was making headlines. Cumulative Covid-19 deaths in French close neighbour
went from 34 to 1,441 between March 1st and March 14th. Italy progressively put in
place a nationwide lock-down between March 8 and 11. All this participated in raising
concerns in the French population. According to Google Trends, the week prior to the
elections (March 8-14 2020) was the week with the second highest share of searches for
4the word “Coronavirus” in France in the year 2020, just after the week of March 15-21.
This situation was unprecedented and the decision to maintain elections in that
context was not straightforward. While, the French government considered the possi-
bility of cancelling the elections early March, the French President Emmanuel Macron
announced on March 12 that the elections would be maintained. During his television
speech on that day, he stressed that the government was taking all the measures to
ensure the continuity of the political, economic and social life of the nation. A set of
measures were put in place by the government to limit the spread of the virus and
protect the members of the polling stations and the voters. First by reorganizing the
polling stations to limit proximity, proceeding to visual checks of IDs and cleaning the
polling station. Posters also informed voters of the good gestures to adopt: wash their
hands when entering and leaving the polling station, avoid any physical contact, distant
themselves from other voters. Masks were then not recommended and only reserved to
people at high risk.
On the day of the elections, the French Health Authority, Santé Publique France,
reported 6,378 confirmed cases in France, out of which 285 in intensive care and 161
deaths. It also observed a doubling of the number of declared cases between March 13
and March 15 and emphasized that these numbers may be underestimated, especially
in the regions that were more affected. On March 16, the day after the first round of
the elections, Emmanuel Macron announced a national lock-down effective at noon the
next day.
2.2 Hypothesis
Going to the polling station has long been formulated as the outcome of a rational
decision (Downs (1957)) where individuals weigh the costs C of casting a ballot (the
time it takes among others) and the expected reward of voting. Classically, this reward
depends on the outcome of the election, and can be expressed as the probability that
the voter is pivotal (p) times the benefit (B) of having his preferred party elected, where
B depends on the stakes of the election. Generating positive participation with p close
to zero, rests on the existence of additional benefits of the act of voting (D), which do
not depend on the outcome of the election (Riker and Ordeshook (1968), Feddersen and
Sandroni (2006)), such as a sense of duty. Individuals vote whenever the net benefit of
voting R = pB + D − C is positive. A large body of empirical evidence points to such
rational behaviour among voters in different contexts5 .
5
Blais (2006) among many others.
5Cost-benefits of voting with Covid-19 The most obvious and direct effect of
the pandemic on the trade-off faced by voters is to raise the expected costs of voting.
The pandemic raises the costs of voting from C to C + π̃ χ̃, with π̃ the perceived
probability of catching the disease when voting by an individual, and χ̃ the perceived
utility cost of catching the virus6 . π̃ depends on the local probability π of catching
the disease based on information available at the time (e.g. distance to identified
clusters), and χ̃ on objective measures of the severity of the disease χ (influenced by
age among others). We assume that individuals map local exposure measures into
perceived risk according to π̃ χ̃ = πχ + α, where α captures the degree of pessimism,
or fear, of the individual7 . The extent to which π̃ χ̃ decreases turnout depends on the
correlation between these costs and the other determinants of voting. If those who feel
most threatened by Covid typically have high or low D, their impact on turnout will be
moderate as they would vote or not vote regardless of circumstances. The mapping from
increased risk to lower turnout thus depends on the sensitivity of the voting decision
to a given increase in perceived risk.
Beyond the direct effect on the risk of voting, the pandemic may also have an
impact on other determinants of turnout. The Covid crisis may change the stakes of
the election, thereby affecting B. Voters may for example be more inclined to vote if
they believe that the mayor has a central role to play in such exceptional circumstances,
an unlikely effect in the French institutional context8 . The covid crisis may also affect
D, the benefits of the act of voting. Unlike in elections held under a terrorist threat
(see Gardeazabal (2010) and Kibris (2011)), in which voters defy terrorists by going to
the polling station (a rise in D), such a reaction is unlikely when the enemy is a virus.
Some voters may see the pandemic as a deep failure of a system in which they do not
want to participate any more (drop in D).
Political heterogeneity A recent literature has pointed to the crucial role of po-
litical affiliation in shaping the perception of the pandemic (Allcott et al. (2020), Milosh
et al. (2020)). Makridis and Rothwell (2020) find that, in the United States, Republi-
cans are less likely to social distance, to self-isolate, and to wear masks. Interestingly,
they show that age becomes insignificant in predicting the fear of contracting the virus
after they control for political affiliation. Such differences correlate well with the di-
6
An alternative explanation, which is observationally equivalent in our data, is that voters have a utility
cost of being potential spreaders of the virus, a less egoistic interpretation.
7
We are agnostic about the underlying determinants of α, which may also stem among others from different
(social) media exposure, different trust in science, etc. see Dryhurst et al. (2020)
8
In principle, the covid pandemic can also affect the perceived probability of being pivotal if voters
anticipate the drop in participation. While this may be at play in very small towns, it is unlikely to have
any real quantitative importance.
6vergence in political discourse about Covid-19 between Republicans and Democrats in
the United States. In France, all major parties consider the pandemic a serious issue,
justifying extraordinary measures. There are however good reasons to think that vot-
ers with different political orientations may react differently. Political preferences may
correlate with risk perceptions. Jost et al. (2017) documents a significant relationship
between subjective perceptions of threats and conservatism. There is a long standing
view in political psychology that emotions such as anxiety or anger contribute to the
populist vote (see e.g. Vasilopoulos et al. (2018) and the references therein). If far right
voters are typically more afraid of external threats such as the coronavirus (higher α)
or feel more anger at the system (drop in D), this may contribute to decreasing their
participation disproportionately. In its survey conducted the days after the election,
the CEVIPOF asked a representative panel of the French adult population their feelings
about the Covid crisis. Fear was mentioned across the political spectrum, and anger
was particularly marked among voters who identify with the Rassemblement National
(far right). When asked how serious the consequences on health would be, 58% of those
close to Rassemblement National answered “very serious”, by far the largest proportion.
They however had the lowest proportion stating “rather serious”, potentially reflecting
a substantial variation of attitudes among supporters of the Rassemblement National.
3 Data
This section presents the main variables used in our empirical analysis.
Turnout Our main outcome of interest is people’s willingness to go to the polling
stations. Thus, rather than excluding blanks and invalid votes from the definition of
turnout, as it is usually done in official figures in France, we define turnout as the number
of cast, blank and invalid votes on the number of registered voters. To compute it, we
use election results from the French Ministère de l’Intérieur at the town-level for local
and parliamentary elections.9 Figure 2 depicts the change in turnout between the first
rounds of the 2020 and 2014 local elections, our main outcome variable (∆T urnout).
We restrict our sample to 33,682 French towns for which there was no change in ad-
ministrative boundaries between 2014 and 2020 (merger, fusion, split, change of code
etc...). Turnout at the 2020 local elections appears generally low compared to the 2014
local elections and is significantly different across municipalities.
9
For Paris, Lyon, Marseille, we use election results at the level of an electoral district. Paris has 18
electoral districts, Lyon 9 and Marseille 8.
7Figure 2: Change in Turnout between 2020 and 2014 local elections in French towns
Clusters The list of core clusters provided by the radio channel France Bleu is the
basis for our definition of most exposed places, so-called clusters. The core clusters on
that list are in line with the coverage of major French media: the radio channel France
Info and the newspaper Le Monde covered the emergence of cases in each of these towns
between February 29 and March 6. We display the location of these core clusters in
Figure 3. These towns are located predominantly in the North of France, out of which
six are located in North of Paris, and are on average bigger that other French towns. In
these clusters, the drop in turnout was higher on average than in other towns in France.
To that initial list of core clusters, we add towns which have close interactions with the
core clusters as it was known to be the main transmission channel. Commuting flows
are a good proxy for the likelihood of close interactions between the population of two
towns. The French National Statistical Institute (INSEE) reports annual commuting
flows between towns in France for flows of at least 100 individuals in its dataset Flux
mobilité domicile-travail. We consider a town to be close to a core cluster if the INSEE
reports flows between this town and a core cluster. In total, we have 142 clusters.
We also provide two alternative definitions of clusters - Prox25 and Prox50 - where
8Figure 3: Core Clusters in early March 2020
we use distance rather than commuting flows as proxy for the likelihood of close interac-
tions. While these alternative definitions may be less precise measures of interactions,
they capture other types of links beyond commuting and are not subject to a mini-
mum threshold, which may be problematic for small towns. We calculate geographical
distances between towns using the great-circle distance, based on the geographical co-
ordinates from the public postal service La Poste. Prox25 is a dummy variable which
takes value 1 if a town is located at less than 25 km from a core cluster (smaller circle
in Figure 3). Prox50 is a dummy variable which takes value 1 if a town is located
at less than 50 km from a core cluster (first and second concentric circles in Figure
3). The number of exposed towns is significantly higher according to these definitions:
there are respectively 1,125 and 3,080 clusters in Prox25 and Prox50. As shown in
Table 1, which provides the mean and the standard deviation of the main demographic
characteristics of the towns for each of our definitions, the towns in these groups are
similar in all dimensions except for size.
9Table 1: Descriptive Statistics: Comparison between different groups
(1) (2) (3) (4)
Clusters Prox25 Prox50 Others
Log(population) 8.472 7.232 6.922 6.144
(1.347) (1.548) (1.566) (1.322)
Share 60+ 0.248 0.223 0.237 0.291
(0.0527) (0.0715) (0.0762) (0.0862)
Share Farmers 0.00401 0.00785 0.0120 0.0357
(0.00548) (0.0157) (0.0286) (0.0547)
Share Artisans 0.0353 0.0395 0.0400 0.0433
(0.0149) (0.0264) (0.0299) (0.0382)
Share Senior Executives 0.0876 0.102 0.0911 0.0537
(0.0511) (0.0638) (0.0661) (0.0480)
Share Intermediate Occupations 0.161 0.175 0.163 0.129
(0.0310) (0.0512) (0.0571) (0.0664)
Share Employees 0.170 0.168 0.163 0.153
(0.0314) (0.0513) (0.0527) (0.0634)
Share Other Occupations 0.542 0.508 0.531 0.585
(0.0619) (0.0891) (0.0980) (0.107)
Observations 142 1,125 3,080 30,592
Notes: The table gives the mean and the standard deviation in parenthesis of demographic character-
istics for town subsets. Column (1) presents descriptive statistics for the 142 clusters, column (2) for
the 1,125 towns in a 25-km range of core clusters, column (3) for the 3,080 towns in a 50-km range of
core clusters, and column (4) for the remaining towns.
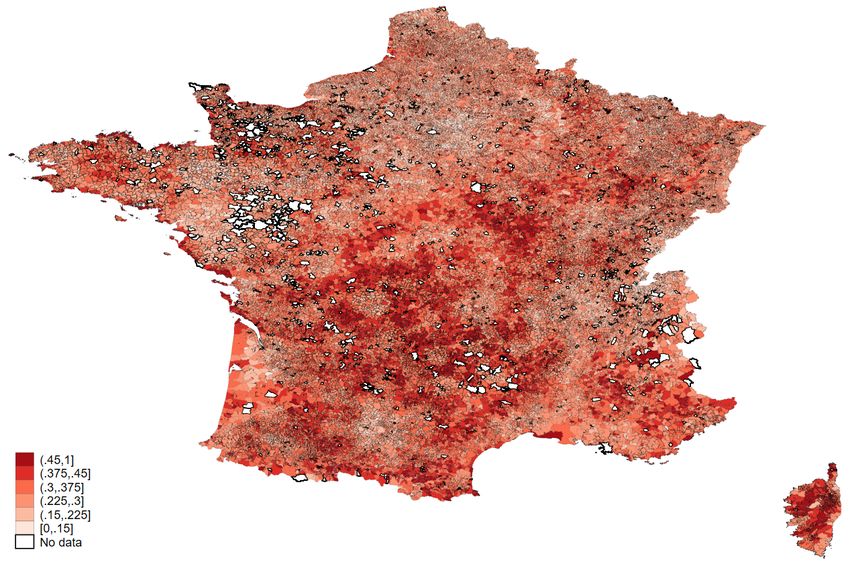
Demographic characteristics All variables on demographic characteristics are
taken from the 2016 Population Census, which is the latest that took place in France.
Along with the population of a town and the share of the population by occupation10 ,
we use the share of people above 60 as a proxy for objective risk denoted Share 60+.
Figure 4 shows this share as measured in the 2016 Census.
10
Occupations are grouped in 6 broad categories: Farmers, Artisans, Senior Executives, Intermediate
occupations, Employees, and Others occupations.
10Figure 4: Share of 60 years and older in 2016 in French towns
Political preferences We proxy political preferences for each French town by the
party of the candidate who collected the most votes during the first round of the 2017
Presidential elections. We exclude for this part of the analysis towns where there was
more than one leading candidate in the first round of the elections11 . The results of the
elections at the municipality level are taken from the French Ministère de l’Intérieur.
Figure 5 reveals significant heterogeneity in political affiliation across towns and regions
in France.
Table 2 shows descriptive statistics for the main variables.
11
We pool two candidates of the left, B. Hamon, the candidate of the Socialist party (center-left) and J-L.
Mélenchon (far-left) as the former came first only in a few towns.
11Figure 5: Top Candidate in the first round of the 2017 Presidential Elections
12Table 2: Descriptive Statistics: Main variables
mean sd min max p25 p50 p75
∆Turnout -15.24 11.08 -61.20 42.85 -22.34 -15.73 -8.08
Distance to core cluster (km) 196.66 137.84 0 586.18 97.65 155.38 262.8831
Proximity -5.01 0.82 -6.38 0 -5.58 -5.05 -4.59
Share 60+ 0.29 0.087 0 0.89 0.23 0.27 0.33
Log(Population) 6.21 1.37 0 13.07 5.27 6.09 7.01
Share Farmers 0.03 0 .05 0 1 0 0.01 0.04
Share Artisans 0.04 0.04 0 1 0.02 0.04 0.06
Share Senior Executives 0.06 0.05 0 1 0.02 0.05 0.08
Share Intermediate Occupations 0.13 0.07 0 0.67 0.09 0.134 0.17
Share Employees 0.15 0.06 0 1 0.12 0.16 0.19
Share Other Occupations 0.58 0.11 0 1 0.51 0.58 0.65
∆Turnout Parliamentary -8.68 5.96 -69.85 33.33 -12.17 -8.91 -5.46
Notes: ∆Turnout is our dependent variable. Distance to core cluster is the distance to the nearest core cluster in kilometre.
Proximity is defined as −log(1 + Distance). ∆Turnout Parliamentary is the change in turnout between the first rounds of the
2017 and 2012 parliamentary elections.
134 Covid and Turnout
This section studies how the rise of the epidemics affected the trade-off between costs
and benefits of going to the polling station.
4.1 Empirical strategy
To assess more systematically whether the epidemic had an impact on local turnout,
we estimate the following specification:
∆T urnoutc = β1 Clustersc + β2 Share60+c + β3 Clustersc × Share60+c (1)
+ β4 P oliticalP ref c + β5 Clustersc × P oliticalP ref c + Zc + δg + εc .
The dependent variable ∆T urnoutc is the difference in turnout at the local elections
between 2014 and 2020 in a city c. Explanatory variables aim at capturing the elements
in voters’ trade-off that were likely to be affected by the pandemic: elements related
to local exposure at the time (πχ) and elements capturing heterogeneity in individual
risk perception (α). More specifically, Clustersc is a dummy variable that takes value
one for all cities considered to be clusters and zero otherwise. In cities considered as
clusters, the local probability of catching the virus based on information available at the
time (π) was higher than in the rest of the French territory. We also add Share60+c ,
the demeaned share of the city population that is 60 or older, to capture higher risks of
severe consequences (higher χ). In line with section 2.2, we also include an interaction
term between the variable Clustersc and Share60+c to capture the higher costs of
voting for more exposed individuals in more exposed places. This interaction identifies
the total effect of greater local exposure to Covid-19. P oliticalP ref c captures hetero-
geneity in political preferences at the local level and the interaction with Clustersc its
potential effect on risk perception.
Zc is a vector of additional variables, unrelated to Covid-19, that may affect the
change in local turnout. Specifically, we include the logarithm of the population and
the share of population by occupation in city c. We also add the difference in turnout
between the 2012 and 2017 parliamentary elections at the city-level. The former controls
for specific demographic determinants of changes in turnout while the latter captures
the local trend in turnout. δg are regional fixed effects - France has 13 regions, depicted
in Figure 3 - and εc is the error term. Region fixed effects control for administrative
differences between regions, among others holidays, which take place in early March in
only a subset of regions on a rotating basis. We cluster standard errors at the canton
14level to correct for potential spatial autocorrelation.12
4.2 Local exposure to covid-19 and turnout
We first test that our variable Clusters is an accurate proxy for local exposure to
covid-19 by estimating the equation (1) without allowing for heterogeneity in political
preferences. Similarly to others papers in the literature, one expects turnout to be
relatively lower in more exposed places.
Results are presented in Table 3. Column (1) does not include any control. In
column (2), we add demographic controls.13 In column (3) we further include trend
in parliamentary election turnout. Our preferred specification is in column (4) where
we also include region fixed effects. In clusters, the decrease in turnout is much more
pronounced than in other towns in France. The share of people aged 60 and above is
on average positively related to the change in turnout, which likely reflects a stronger
attachment to elections in this group. Outside of clusters, towns with a one standard
deviation higher share of people aged 60 or more saw on average an 0.7 percentage point
smaller drop in participation. Among clusters, however, this drop was 6 percentage
point larger. Being in a cluster thus significantly reduced turnout, and significantly
more so for towns with a high share of people aged 60 years or older. This suggests
that the increase in πχ was big enough in some areas to affect the trade-off faced by
voters and induce voters to turnout relatively less. These results are in line with the
findings of Noury et al. (2021).
Table 4 displays the results of the estimation of our preferred specification using
our two alternative definitions of clusters P rox25 and P rox50. All columns include
demographic and parliamentary turnout trend controls as well as region fixed effects.
Column (1) is uses our baseline measure, which corresponds to the last column of Table
3. We substitute our preferred cluster definition with Prox25 in column (2) and with
Prox50 in column (3). Column (4) uses bins based on proximity to core clusters to
proxy for close interactions similarly to the different circles in Figure 3. The first bin,
Prox25, equals 1 for towns in a 25-kilometre range from a core cluster (area in the first
circle). The second bin, Prox2550, equals 1 for towns between 25 and 50 kilometres
of a core cluster (area between first and second circle). And, the last bin, Prox50100,
equals 1 for towns between 50 and 100 kilometres from a core clusters (area between
12
A canton is generally a group of towns in rural areas, while it may be a single neighbourhood in a town
in dense urban areas. Whenever the canton is defined by a single neighbourhood, we consider the city to
which it belongs to be the canton. For Paris, Lyon, and Marseille for which we have district-level electoral
outcomes, we define the canton to be an electoral district.
13
We lose 7 observations from towns for which we have missing demographic characteristics.
15Table 3: Turnout estimates: Clusters specification
(1) (2) (3) (4)
∆Turnout ∆Turnout ∆Turnout ∆Turnout
Clusters -9.744∗∗∗ -4.334∗∗∗ -4.363∗∗∗ -3.795∗∗∗
(1.312) (1.489) (1.481) (1.376)
Share 60+ 22.79∗∗∗ 10.74∗∗∗ 9.126∗∗∗ 8.244∗∗∗
(0.960) (0.943) (0.937) (0.956)
Clusters x Share 60+ -71.79∗∗∗ -81.43∗∗∗ -80.58∗∗∗ -70.45∗∗∗
(18.07) (20.27) (20.10) (19.45)
∆Turnout Parliamentary 0.171∗∗∗ 0.183∗∗∗
(0.0103) (0.0103)
Observations 33,682 33,675 33,675 33,675
R2 0.034 0.141 0.149 0.160
Region fixed effects NO NO NO YES
Notes: The dependent variable is the difference in turnout between 2020 and 2014 local elections at the
town level. Clusters is a dummy variable equals to 1 for towns considered to be clusters. Share60+
is the share of people of 60 or older. ∆T urnout is the difference in turnout between 2017 and 2012
parliamentary elections. Columns (2)-(4) include demographic controls, and column (4) also include
regional fixed effects. OLS estimation. Standard errors in parentheses are clustered by canton. ***
pTable 4: Turnout estimates: Alternative proximity measures
(1) (2) (3) (4) (5)
∆Turnout ∆Turnout ∆Turnout ∆Turnout ∆Turnout
Clusters Prox25 Prox50 Prox bins Prox Linear
Clusters -3.795∗∗∗ -1.228∗∗ -1.027∗∗
(1.376) (0.578) (0.400)
Share 60+ 8.244∗∗∗ 8.454∗∗∗ 8.926∗∗∗ 9.570∗∗∗ 7.116∗∗∗
(0.956) (0.967) (0.972) (0.971) (1.013)
Clusters x Share 60+ -70.45∗∗∗ -13.82∗∗∗ -12.94∗∗∗
(19.45) (5.342) (3.411)
Proximity (< 25km) -1.494∗∗
(0.593)
Proximity (>= 25km and < 50) -1.056∗∗
(0.448)
Proximity (>= 50km and < 100) -0.405∗
(0.240)
Prox25 x Share 60+ -16.17∗∗∗
(5.177)
Prox2550 x Share 60+ -13.75∗∗∗
(3.998)
Prox50100 x Share 60+ -5.193∗
(2.868)
Proximity -0.688∗∗∗
(0.177)
Prox x Share 60+ -4.392∗∗∗
(1.075)
∆Turnout Parliamentary 0.183∗∗∗ 0.183∗∗∗ 0.183∗∗∗ 0.182∗∗∗ 0.180∗∗∗
(0.0103) (0.0103) (0.0103) (0.0104) (0.0103)
Observations 33,675 33,675 33,675 33,675 33,675
R2 0.160 0.160 0.161 0.161 0.161
Region fixed effects YES YES YES YES YES
Notes: The dependent variable is the difference in turnout between 2020 and 2014 local elections at the town level. Clusters is a
dummy variable equals to 1 for towns considered to be clusters. In column (1), we use our baseline measure Clusters, while we
use alternative definitions in columns (2)-(5). All columns include demographic controls and regional fixed effects. OLS estimation.
Standard errors in parentheses are clustered by canton. *** p4.3 Role for Heterogeneity in Political Preferences?
As mentioned in section 2.2, individual perception and specifically political preferences
may influence individuals’ decisions to participate to the election during the covid pan-
demic. While political affinity does not affect the risk factors themselves (after control-
ling for the share of different occupations or the size of the town among others), it may
correlate with the risk perception of voters (α) or with other common determinants of
the decision to vote. Before delving into potential mechanisms, this section documents
the heterogeneous turnout response of towns along different dimensions of the political
spectrum. Our empirical specification rests on equation (1), which includes political
preferences variables and their interactions with Clusters.
Following the literature, we first check whether towns on the right of the politi-
cal spectrum reacted differently to the epidemic risk than other towns. To do so, we
construct a dummy variable Top Right which equals 1 for town where Francois Fillon
(Les Républicains) and Marine Le Pen (Rassemblement National) collected the abso-
lute majority of cast votes in the first round of the 2017 Presidential elections and zero
otherwise. Table 5 presents the results of the estimation equation (1) in which political
preferences,P oliticalP refc , are proxied by the dummy Top Right. All columns include
demographic controls and trends in turnout, as well as region fixed effects. In column
(1), we first include the dummy Top Right without its interaction with Clusters. The
coefficients of interest do not significantly change compared to column (4) in Table 3.
In column (2), we add an interaction term between Clusters and Top Right. The coef-
ficient on Clusters is no longer significant, while the coefficient on the new interaction
term is negative, significant and nearly twice as big as the Clusters coefficient in col-
umn (1). All other coefficients are unaffected. This also holds when using alternative
measures of clusters in columns (3) and (4). The effect of Clusters in towns with a
share of people aged 60 or older seems to be mainly driven by individuals on the right
of the political spectrum.
We then restrict the right to the far-right of the political spectrum. We define a
dummy variable, Le Pen, as equal to 1 in towns where Marine Le Pen was the leading
candidate in the first round of the 2017 Presidential elections and zero otherwise. We
exclude from the analysis the towns for which there was more than one leading candidate
in these elections. Table 6 displays the results substituting the Le Pen dummy for the
Top Right dummy. The columns are equivalent to the columns of Table 5. The results
are very similar to Table 5, suggesting that the effect of Clusters in towns with a share
of old people equal to the average seems to be mainly driven by towns on the far-right
of the political spectrum. The coefficient on the new interaction term appears even
18Table 5: Turnout estimates with Top Right dummy
(1) (2) (3) (4)
∆Turnout ∆Turnout ∆Turnout ∆Turnout
Clusters Clusters Prox25 Prox50
Clusters -3.785∗∗∗ -1.227 -0.348 -0.0650
(1.375) (1.188) (0.594) (0.407)
Share 60+ 8.188∗∗∗ 8.182∗∗∗ 8.407∗∗∗ 8.904∗∗∗
(0.955) (0.954) (0.966) (0.971)
Clusters x Share 60+ -70.15∗∗∗ -59.96∗∗∗ -12.32∗∗ -12.80∗∗∗
(19.41) (17.93) (5.206) (3.401)
Top Right -0.140 -0.112 -0.0706 0.0699
(0.142) (0.142) (0.144) (0.147)
Clusters x Top Right -6.050∗∗ -1.825∗∗∗ -2.081∗∗∗
(2.362) (0.695) (0.467)
∆Turnout Parliamentary 0.182∗∗∗ 0.183∗∗∗ 0.183∗∗∗ 0.182∗∗∗
(0.0103) (0.0103) (0.0103) (0.0103)
Observations 33,675 33,675 33,675 33,675
R2 0.160 0.161 0.160 0.161
Region fixed effects YES YES YES YES
Notes: The dependent variable is the difference in turnout between 2020 and 2014 local elections at
the town level. Clusters is a dummy variable equals to 1 for the towns considered to be clusters. In
columns (1)-(2), we use our baseline measure Clusters, while we use alternative definitions in columns
(3)-(4). Share60+ is the share of people of 60 or older. T opRight is a dummy variable equal to 1
for town where right-wing candidates collected the absolute majority of cast votes in the first round
of the 2017 Presidential elections. ∆T urnout is the difference in turnout between 2017 and 2012
parliamentary elections. All columns include demographic controls and regional fixed effects. OLS
estimation. Standard errors in parentheses are clustered by canton. *** pelections and zero otherwise. As shown in Table 7, neither the coefficient on Top Ex-
treme nor the interaction between Clusters and Top Extreme are significant. As a final
check, we add dummies for all major parties in Table 8. The dummies are constructed
based on the party of the candidate who collected the greatest share of cast votes during
the first round of the 2017 Presidential elections. The far-right is the only party for
which the interaction with Clusters is stable and statistically significant across all spec-
ifications. These tables confirm that the most relevant political dimension to explain
the heterogeneous turnout response to the covid crisis is the role of far-right voters.
20Table 6: Turnout estimates with Le Pen measure
(1) (2) (3) (4)
∆Turnout ∆Turnout ∆Turnout ∆Turnout
Clusters Clusters Prox25 Prox50
Clusters -4.289∗∗∗ -0.539 -0.0421 0.615
(1.622) (1.357) (0.670) (0.521)
Share 60+ 6.766∗∗∗ 6.770∗∗∗ 7.073∗∗∗ 7.721∗∗∗
(0.976) (0.975) (0.989) (0.993)
Clusters x Share 60+ -79.20∗∗∗ -83.80∗∗∗ -17.42∗∗∗ -16.84∗∗∗
(18.08) (16.35) (5.528) (3.330)
Le Pen -1.188∗∗∗ -1.162∗∗∗ -1.112∗∗∗ -0.948∗∗∗
(0.140) (0.140) (0.139) (0.140)
Clusters x Le Pen -6.795∗∗∗ -2.581∗∗∗ -2.876∗∗∗
(2.232) (0.675) (0.543)
∆Turnout Parliamentary 0.175∗∗∗ 0.175∗∗∗ 0.174∗∗∗ 0.173∗∗∗
(0.0105) (0.0105) (0.0105) (0.0105)
Observations 32,841 32,841 32,841 32,841
R2 0.160 0.160 0.160 0.161
Region fixed effects YES YES YES YES
Notes: The dependent variable is the difference in turnout between 2020 and 2014 local elections at
the town level. Clusters is a dummy variable equals to 1 for the towns considered to be clusters. In
columns (1)-(2), we use our baseline measure Clusters, while we use alternative definitions in columns
(3)-(4). Share60+ is the share of people of 60 or older. LeP en is a dummy variable equal to 1
for town where Marine Le Pen was the leading candidate in the first round of the 2017 Presidential
elections. ∆T urnout is the difference in turnout between 2017 and 2012 parliamentary elections. All
columns include demographic controls and regional fixed effects. OLS estimation. Standard errors in
parentheses are clustered by canton. *** pTable 7: Turnout estimates with Top Extreme measure
(1) (2) (3) (4)
∆Turnout ∆Turnout ∆Turnout ∆Turnout
Clusters Clusters Prox25 Prox50
Clusters -3.789∗∗∗ -3.941∗∗∗ -1.343∗∗ -0.982∗∗
(1.377) (1.450) (0.579) (0.443)
Share 60+ 8.367∗∗∗ 8.366∗∗∗ 8.550∗∗∗ 9.060∗∗∗
(0.979) (0.979) (0.991) (1.000)
Clusters x Share 60+ -70.36∗∗∗ -67.77∗∗∗ -12.67∗∗ -13.13∗∗∗
(19.41) (21.69) (5.620) (3.413)
Top Extreme 0.122 0.118 0.0951 0.139
(0.158) (0.158) (0.159) (0.163)
Clusters x Top Extreme 1.147 0.758 -0.186
(2.660) (0.948) (0.525)
∆Turnout Parliamentary 0.184∗∗∗ 0.184∗∗∗ 0.184∗∗∗ 0.184∗∗∗
(0.0103) (0.0103) (0.0103) (0.0103)
Observations 33,675 33,675 33,675 33,675
R2 0.160 0.160 0.160 0.161
Region fixed effects YES YES YES YES
Notes: The dependent variable is the difference in turnout between 2020 and 2014 local elections at
the town level. Clusters is a dummy variable equals to 1 for the towns considered to be clusters. In
columns (1)-(2), we use our baseline measure Clusters, while we use alternative definitions in columns
(3)-(4). Share60+ is the share of people of 60 or older. T opExtreme is a dummy variable equal to
1 for town where extreme candidates collected the absolute majority of cast votes in the first round
of the 2017 Presidential elections. ∆T urnout is the difference in turnout between 2017 and 2012
parliamentary elections. All columns include demographic controls and regional fixed effects. OLS
estimation. Standard errors in parentheses are clustered by canton. *** pTable 8: Turnout estimates with political parties interactions
(1) (2) (3) (4)
∆Turnout ∆Turnout ∆Turnout ∆Turnout
Clusters Clusters Prox25 Prox50
Clusters -4.364∗∗∗ 1.429 0.460 1.696∗∗∗
(1.628) (1.739) (0.905) (0.567)
Share 60+ 6.896∗∗∗ 6.897∗∗∗ 7.202∗∗∗ 7.786∗∗∗
(0.980) (0.979) (0.992) (0.996)
Clusters x Share 60+ -78.70∗∗∗ -80.35∗∗∗ -10.54∗∗ -13.51∗∗∗
(18.11) (19.82) (5.227) (3.372)
Melenchon/Hamon 1.388∗∗∗ 1.401∗∗∗ 1.270∗∗∗ 1.254∗∗∗
(0.233) (0.234) (0.235) (0.240)
Fillon 0.471∗∗ 0.476∗∗ 0.536∗∗ 0.755∗∗∗
(0.223) (0.224) (0.223) (0.226)
Le Pen -0.706∗∗∗ -0.678∗∗∗ -0.620∗∗∗ -0.380∗∗
(0.176) (0.176) (0.177) (0.180)
Clusters x Melenchon/Hamon -3.871 7.023∗∗∗ 3.578∗∗∗
(2.510) (1.191) (0.896)
Clusters x Fillon -3.601 -1.833 -3.054∗∗∗
(3.198) (1.282) (0.863)
Clusters x Le Pen -8.729∗∗∗ -2.598∗∗∗ -3.772∗∗∗
(2.441) (0.916) (0.595)
∆Turnout Parliamentary 0.177∗∗∗ 0.177∗∗∗ 0.177∗∗∗ 0.176∗∗∗
(0.0105) (0.0105) (0.0105) (0.0105)
Observations 32841 32841 32841 32841
R2 0.161 0.161 0.162 0.163
Region fixed effects YES YES YES YES
Notes: The dependent variable is the difference in turnout between 2020 and 2014 local elections at the town
level. Clusters is a dummy variable equals to 1 for the towns considered to be clusters. In columns (1)-(2),
we use our baseline measure Clusters, while we use alternative definitions in columns (3)-(4). Share60+ is
the share of people of 60 or older. M elenchon/Hamon, F illon, LeP en are dummy variables equal to 1 for
town where the respective candidates where the leading candidates in the first round of the 2017 Presidential
elections. The reference is towns where the leading candidates in the first round was Emmanuel Macron.
∆T urnout is the difference in turnout between 2017 and 2012 parliamentary elections. All columns include
demographic controls and regional fixed effects. OLS estimation. Standard errors in parentheses are clustered
by canton. *** pTo make sure that our results are stable we perform a series of robustness checks.
First we test that our results holds on alternative samples. Table 9 presents the first set
of results. Column (1) shows the results of the estimation of equation (1) on our baseline
sample of 32,841 towns. In column (2), we weight the estimation by the population of
the town. In column (3), we restrict to town which have a population of at least 1,000
inhabitants. In the remaining columns, the sample is restricted to towns in exposed
areas: in column (4) in a 100-kilometre range from a cluster, in column (5) to towns in
regions with at least a cluster and in column (6) to towns in departments with at least a
cluster. All specifications point to a large decrease in turnout in far-right towns located
close to core clusters.14 It is interesting to note that the effect of the far-right supports
in clusters seems particularly strong for small towns. To ensure that our results are not
driven by a specific set of clusters, we run our baseline specification on samples from
which we remove clusters linked to one core clusters. The results are displayed in Table
10. Column (1) is using our baseline sample, in column (2) we remove the 17 clusters
in the area of Ajaccio, in column (3) we remove the clusters on the area of Auray, in
column (4) we remove the clusters in the area of Carnac and so on. Coefficients in
Table 10 suggests that no specific set of clusters is driving the results, reassuringly the
magnitudes of the coefficients of interest is rather stable from one sample to the next.
We then allow for greater spatial autocorrelation in standard errors in Table ??. In
the first three columns, the standard errors are clustered at the level of a department,
which are significantly bigger than canton used in our baseline. In the remaining three
columns, we compute Conley standard errors which allow for spatial autocorrelation be-
tween observations in a 100-kilometer range. The results remains virtually unchanged.
Clusters is not significant, while all other variables of interest are statistically signifi-
cant.
Finally, we replicate our analysis at different levels of spatial aggregation, such as
canton, employment zones, and departments in Table ?? in the appendix. Our main
results also hold at these more aggregated levels.
14
This also holds when introducing a dummy variable for dense urban areas and interactions as shown in
Table A4 in the appendix.
24Table 9: Turnout estimates with Le Pen dummy - Alternative samples
(1) (2) (3) (4) (5) (6)
∆Turnout ∆Turnout ∆Turnout ∆Turnout ∆Turnout ∆Turnout
Baseline Weighted Pop ≥ 1,000 Dist > 100km Region Department
Clusters -0.539 -1.765∗ -1.356 -1.364 -0.208 -0.0212
(1.357) (0.993) (1.460) (1.409) (1.375) (1.479)
Share 60+ 6.770∗∗∗ -12.63∗∗∗ -3.666 1.528 3.937∗∗ 2.298
(0.975) (1.891) (2.482) (2.470) (1.584) (3.545)
Clusters x Share 60+ -83.80∗∗∗ -37.27∗∗∗ -59.18∗∗∗ -74.21∗∗∗ -81.92∗∗∗ -70.34∗∗∗
(16.35) (9.901) (15.21) (16.22) (16.36) (15.50)
Le Pen -1.162∗∗∗ -0.973∗∗∗ -0.556∗ -1.826∗∗∗ -1.360∗∗∗ -1.433∗∗
(0.140) (0.224) (0.288) (0.326) (0.235) (0.563)
25
Clusters x Le Pen -6.795∗∗∗ -3.265∗∗ -4.634∗∗ -5.706∗∗ -6.836∗∗∗ -5.611∗∗
(2.232) (1.504) (1.953) (2.326) (2.257) (2.265)
∆ Turnout Parliamentary 0.175∗∗∗ 0.281∗∗∗ 0.243∗∗∗ 0.170∗∗∗ 0.166∗∗∗ 0.142∗∗∗
(0.0105) (0.0261) (0.0377) (0.0231) (0.0156) (0.0343)
Observations 32,841 32,841 8,873 8,600 14,749 3,701
R2 0.160 0.094 0.029 0.093 0.144 0.115
Region fixed effects YES YES YES YES YES YES
Notes: The dependent variable is the difference in turnout between 2020 and 2014 local elections at the town level. Clusters is a dummy variable
equals to 1 for the 142 towns considered to be clusters on our baseline measure. Share60+ is the share of people of 60 or older. LeP en is a dummy
variable equal to 1 for town where Marine Le Pen was the leading candidate in the first round of the 2017 Presidential elections. ∆T urnout is
the difference in turnout between 2017 and 2012 parliamentary elections. Column (1) is estimated on the baseline sample, column (2) shows the
population-weighted estimates, column (3) restricts the sample to towns with at least 1,000 inhabitants, in column (4) to towns in a 100-km range
of a core cluster, in column (5) to towns in regions with at least a cluster, and in column (6) to towns in departments with at least a cluster. All
columns include demographic controls and regional fixed effects. OLS estimation. Standard errors in parentheses are clustered by canton. *** pTable 10: Turnout estimates with Le Pen measure: Sensitivity Analysis
(1) (2) (3) (4) (5) (6) (7) (8) (9) (10) (11) (12)
∆Turnout ∆Turnout ∆Turnout ∆Turnout ∆Turnout ∆Turnout ∆Turnout ∆Turnout ∆Turnout ∆Turnout ∆Turnout ∆Turnout
Clusters -0.539 0.311 -0.441 -1.140 -0.686 -0.180 -0.762 -0.470 -0.674 -0.847 -0.281 -0.553
(1.357) (1.329) (1.548) (1.387) (1.454) (1.387) (1.376) (1.363) (1.362) (1.438) (1.668) (1.356)
Share 60+ 6.770∗∗∗ 6.628∗∗∗ 6.772∗∗∗ 6.769∗∗∗ 6.768∗∗∗ 6.762∗∗∗ 6.771∗∗∗ 6.766∗∗∗ 6.754∗∗∗ 6.761∗∗∗ 6.753∗∗∗ 6.769∗∗∗
(0.975) (0.974) (0.975) (0.975) (0.975) (0.975) (0.975) (0.975) (0.975) (0.975) (0.974) (0.975)
Clusters x Share 60+ -83.80∗∗∗ -73.69∗∗∗ -94.65∗∗∗ -88.54∗∗∗ -84.87∗∗∗ -72.97∗∗∗ -86.13∗∗∗ -80.37∗∗∗ -78.87∗∗∗ -81.16∗∗∗ -96.07∗∗∗ -84.25∗∗∗
(16.35) (16.76) (15.28) (18.32) (16.28) (17.06) (16.33) (17.04) (15.99) (19.27) (20.74) (16.44)
∆Turnout Parliamentary 0.175∗∗∗ 0.175∗∗∗ 0.174∗∗∗ 0.175∗∗∗ 0.175∗∗∗ 0.175∗∗∗ 0.174∗∗∗ 0.175∗∗∗ 0.174∗∗∗ 0.174∗∗∗ 0.174∗∗∗ 0.174∗∗∗
(0.0105) (0.0104) (0.0105) (0.0105) (0.0105) (0.0105) (0.0105) (0.0105) (0.0105) (0.0105) (0.0105) (0.0105)
Le Pen -1.162∗∗∗ -1.153∗∗∗ -1.160∗∗∗ -1.162∗∗∗ -1.162∗∗∗ -1.159∗∗∗ -1.162∗∗∗ -1.162∗∗∗ -1.163∗∗∗ -1.164∗∗∗ -1.163∗∗∗ -1.161∗∗∗
(0.140) (0.140) (0.140) (0.140) (0.140) (0.140) (0.140) (0.140) (0.140) (0.140) (0.139) (0.140)
Clusters x Le Pen -6.795∗∗∗ -4.715∗∗∗ -7.345∗∗∗ -6.395∗∗∗ -6.694∗∗∗ -7.950∗∗∗ -6.400∗∗∗ -6.875∗∗∗ -6.791∗∗∗ -6.374∗∗∗ -9.128∗∗ -7.002∗∗∗
(2.232) (1.625) (2.327) (2.212) (2.270) (2.488) (2.245) (2.269) (2.271) (2.361) (3.915) (2.264)
Observations 32,841 32,824 32,828 32,837 32,839 32,823 32,839 32,838 32,837 32,833 32,774 32,839
R2 0.160 0.159 0.160 0.160 0.160 0.160 0.160 0.160 0.160 0.160 0.159 0.160
26
Region fixed effects YES YES YES YES YES YES YES YES
Core Clusters Removed NONE AJACCIO AURAY CARNAC CRACH CREIL CREPY LAGNY LAMORLAYE MERY MULHOUSE VAUMOIS
Notes: The dependent variable is the difference in turnout between 2020 and 2014 local elections at the town level. Clusters is a dummy variable equals to 1 for the towns considered to be clusters according to our baseline definition. Share60+ is the sha
of people of 60 or older. LeP en is a dummy variable equal to 1 for town where Marine Le Pen was the leading candidate in the first round of the 2017 Presidential elections. ∆T urnout is the difference in turnout between 2017 and 2012 parliamenta
elections. Column (1) is using our baseline sample, in columns (2)-(12) we remove clusters in the area of a given core cluster. The clusters removed in each columns is indicated in the bottom line of the table. All columns include demographic contr
and regional fixed effects. OLS estimation. Standard errors in parentheses are clustered by canton. *** pTable 11: Turnout estimates with Le Pen dummy - Alternative standard errors treatment
(1) (2) (3) (4) (5) (6)
∆Turnout ∆Turnout ∆Turnout ∆Turnout ∆Turnout ∆Turnout
Clusters Prox25 Prox50 Clusters Prox25 Prox50
Clusters -0.539 -0.0421 0.615 -0.539 -0.0421 0.615
(1.037) (0.986) (0.930) (1.059) (1.180) (1.178)
Share 60+ 6.770∗∗∗ 7.073∗∗∗ 7.721∗∗∗ 6.770∗∗∗ 7.073∗∗∗ 7.721∗∗∗
(1.246) (1.245) (1.224) (1.174) (1.173) (1.133)
Clusters x Share 60+ -83.80∗∗∗ -17.42∗∗∗ -16.84∗∗∗ -83.80∗∗∗ -17.42∗∗∗ -16.84∗∗
(20.42) (5.983) (5.222) (22.02) (6.543) (6.837)
Le Pen -1.162∗∗∗ -1.112∗∗∗ -0.948∗∗∗ -1.162∗∗∗ -1.112∗∗∗ -0.948∗∗∗
(0.166) (0.158) (0.156) (0.191) (0.161) (0.145)
27
Clusters x Le Pen -6.795∗∗∗ -2.581∗∗ -2.876∗∗∗ -6.795∗∗∗ -2.581∗∗∗ -2.876∗∗∗
(2.213) (1.133) (0.735) (2.134) (0.723) (0.545)
∆Turnout Parliamentary 0.175∗∗∗ 0.174∗∗∗ 0.173∗∗∗ 0.175∗∗∗ 0.174∗∗∗ 0.173∗∗∗
(0.0107) (0.0107) (0.0106) (0.00905) (0.00916) (0.00894)
Observations 32,841 32,841 32,841 32,841 32,841 32,841
R2 0.160 0.160 0.161 0.140 0.140 0.141
Region fixed effects YES YES YES YES YES YES
Notes: The dependent variable is the difference in turnout between 2020 and 2014 local elections at the town level. Clusters is a dummy
variable equals to 1 for the towns considered to be clusters. In columns (1) and (4), we use our baseline measure Clusters, while we use
alternative definitions in all other columns. Share60+ is the share of people of 60 or older. LeP en is a dummy variable equal to 1 for
town where Marine Le Pen was the leading candidate in the first round of the 2017 Presidential elections. ∆T urnout is the difference
in turnout between 2017 and 2012 parliamentary elections. All columns include demographic controls and regional fixed effects. OLS
estimation. Standard errors in parentheses are clustered by department in columns (1)-(3), and computed as Conley standard errors in
columns (3)-(6). *** pYou can also read