Countdown Alexandra Retail Impact Assessment - 28 April 2020 - final - Central Otago District Council
←
→
Page content transcription
If your browser does not render page correctly, please read the page content below
Countdown Alexandra
Retail Impact Assessment

28 April 2020 – final
Countdown Alexandra
Retail Impact Assessment

Prepared for
CPD 2012 Ltd

Document reference: CPD 001.20
Date of this version: 28 April 2020
Author: Derek Foy, Natalie Hampson
Director approval: Natalie Hampson
www.me.co.nz

Disclaimer: Although every effort has been made to ensure accuracy and reliability of the information
contained in this report, neither Market Economics Limited nor any of its employees shall be held liable for
the information, opinions and forecasts expressed in this report.
Contents
1         INTRODUCTION ............................................................................................................ 1

1.1       KEY ISSUES....................................................................................................................... 1

1.2       OBJECTIVE ....................................................................................................................... 1

1.3       METHODOLOGY ................................................................................................................ 2

2         CURRENT ENVIRONMENT OVERVIEW ........................................................................... 3

2.1       LOCAL GEOGRAPHY AND CATCHMENT ..................................................................................... 3

2.2       DISTRICT PLAN.................................................................................................................. 4

2.3       HOUSEHOLD PROJECTIONS ................................................................................................... 5

2.4       DEMAND PROJECTIONS ....................................................................................................... 6

2.5       SUPERMARKET AND GROCERY STORE SUPPLY ............................................................................ 7

2.6       CENTRES SURVEY ............................................................................................................... 8

3         PROPOSED DEVELOPMENT ......................................................................................... 13

3.1       THE PROPOSED DEVELOPMENT............................................................................................ 13

3.2       SALES PERFORMANCE ....................................................................................................... 14

4         IMPACT ASSESSMENT ................................................................................................. 18

4.1       IMPACT TYPES................................................................................................................. 18

4.2       DIRECT RETAIL IMPACTS .................................................................................................... 18

4.3       CENTRE HEALTH .............................................................................................................. 23

4.4       INDIRECT CENTRE IMPACTS................................................................................................. 27

5         ECONOMIC AND OTHER BENEFITS .............................................................................. 30

5.1       TRAVEL EFFICIENCY AND ACCESSIBILITY .................................................................................. 30

5.2       SHORT TERM CONSTRUCTION EFFECTS .................................................................................. 30

5.3       EMPLOYMENT EFFECTS ..................................................................................................... 30

6         CONCLUSION.............................................................................................................. 32

APPENDIX 1: MARKET METER METHODOLOGY .......................................................................... 33

Figures
FIGURE 2.1: CENTRAL OTAGO STUDY AREA CATCHMENTS (SA2S), SUPERMARKETS AND GROCERY STORES ............... 4

FIGURE 2.2: CENTRAL OTAGO HOUSEHOLD PROJECTIONS (MEDIUM PROJECTION) ................................................ 6

FIGURE 2.3: CENTRAL OTAGO SUPERMARKET AND GROCERY DEMAND PROJECTIONS ($M) .................................... 7

FIGURE 2.4: CENTRAL OTAGO SUPERMARKET AND GROCERY STORE SUPPLY (2020) ............................................. 8

FIGURE 2.5: CENTRAL OTAGO DISTRICT EMPLOYMENT BY LOCATION (2019) ...................................................... 9

FIGURE 3.1: PROPOSED COUNTDOWN ALEXANDRA ...................................................................................... 13

FIGURE 3.2: ALEXANDRA BUSINESS RESOURCE AREA AND PROPOSED COUNTDOWN SITE .................................... 14

FIGURE 3.3: COUNTDOWN ALEXANDRA SALES POTENTIAL (2022), SCENARIO 1 ............................................... 17

FIGURE 4.1: SUPERMARKET SALES WITHOUT COUNTDOWN ALEXANDRA........................................................... 19

FIGURE 4.2: SCENARIO 1: DIRECT RETAIL IMPACTS ON SUPERMARKET SALES (IN 2022) WITHOUT AND WITH
COUNTDOWN.......................................................................................................................................... 21

FIGURE 4.3: SCENARIO 2: DIRECT RETAIL IMPACTS ON SUPERMARKET SALES (IN 2022) WITHOUT AND WITH
COUNTDOWN.......................................................................................................................................... 21

1               Introduction
Market Economics Ltd (M.E) has been commissioned by CPD 2012 Ltd to assess the
potential economic and retail impacts of a proposed Countdown supermarket between
Centennial Ave and Ventry St in Alexandra, Central Otago (“the Site”).

1.1             Key issues
The proposed supermarket has been assessed as a discretionary activity under the Central Otago District
Plan (“CODP”) in the Assessment of Effects (“AEE”) that was lodged with Council, by virtue of its non-
compliance with certain rules in the CODP arising from the Site’s Residential Zoning. 1 The proposal would
represent an increase of supermarket supply in Alexandra, and change how consumers in the area access
supermarket and grocery goods. That change is likely to result in some of the spending that is currently
directed to existing supermarkets in Central Otago being diverted away from existing stores to instead be
directed to the new Countdown store.

This diversion is likely to result in some decrease in sales of existing supermarkets and grocery stores, with
potential flow-on effects for the centres those supermarkets are in. These are usually referred to as trade
competition effects and as such are not to be considered as part of an assessment under the RMA, except
where they are of a scale and direction that leads to effects that are above and beyond those associated
with trade competition. It is only when the effects of an activity causes significant impacts on centres’
amenity, vitality and viability that indirect effects are a relevant RMA consideration.

1.2             Objective
The specific objectives of this report are to:

                     •    Examine current and future demand (to 2033) for supermarket capacity in the study
                          area (as defined in section 2.1).

                     •    Determine current supermarket supply in the study area, and identify any likely changes
                          to that supply that are currently in the pipeline.

                     •    Assess the likely direct retail effects of the proposed supermarket on existing retail
                          centres in the study area.

                     •    Assess the likely cumulative direct retail effects of the proposed supermarket and any
                          other identified new supermarket supply on existing retail centres in the study area.

                     •    Consider the likely flow-on, indirect effects of the proposed supermarket that will occur
                          as a result of the direct retail effects.

                     •    Consider other positive and negative economic effects of the proposed supermarket.

1   Section 4.2, p11, “Resource Consent Application to Central Otago District Council” January 2020, Landpro Ltd

Page | 1
1.3 Methodology
This section describes the methodology applied to estimate the direct and indirect retail impacts of the
proposed Countdown Alexandra supermarket. The key to the assessment is a model that analyses
consumer demand (in dollar terms) directed to supermarkets and food and grocery stores in Central Otago,
and is built on an understanding of consumer origin-destination patterns. The model is calibrated to
describe the current demand-supply situation which serves as the basis to quantify the effect of changes
(such as through the creation of new supply in the market or market growth) to that situation. The model’s
engine identifies dollar spending power from households (according to socio-demography), tourists and
businesses, and includes demand projections based on household (and other growth). Modelled demand
projections take into account projected changes in retail spend per household, and estimated supermarket
sales for existing stores.
To assess the expected retail and economic effects of the proposed supermarket, the key steps have been:
• Quantify market size and growth.
• Assess how supermarkets in the Central Otago currently meet consumers’ demand.
• Assess how supermarket sales will change from current levels given expected market
growth. This becomes the assessment baseline against which the ‘with Countdown’
scenarios are compared.
• Estimate sales performance of the proposed Countdown Alexandra.
• Identify any other expected changes in supermarket supply in the study area, and
estimate the sales performance of that increased supply.
• Assess changes in the sales of existing supermarkets with the addition of Countdown
Alexandra to the supermarket supply environment, to produce trade competition
impact estimates.
• Assess the cumulative effects of changes in the sales of existing supermarkets with the
addition of both the Countdown Alexandra and any other changes in supply to the local
supermarket supply environment, to produce trade competition impact estimates.
• Assess the likely flow-on effects of the trade competition impacts, to produce estimates
of the indirect impacts of the proposed supermarket. It is these indirect impacts that
are relevant in RMA terms.
• Summarise the implications and significance of these indirect impacts in RMA terms,
considering the distinction between trade competition and effects that are of
importance to urban form and sustainability.
Page | 22 Current environment overview This section describes how the supermarket marketplace currently operates in Alexandra and wider Central Otago, to place the proposed supermarket in context. The assessment covers the current (2020) demand situation, and examines future growth projections for household growth and supermarket demand. 2.1 Local geography and catchment 2.1.1 Alexandra Alexandra is a rural town in Central Otago, with a usually resident population of 5,470 in 2,350 occupied dwellings, as recorded in the 2018 Census.2 Alexandra is a similar size to Cromwell, the other main town in Central Otago, located 30km north-west of Alexandra. Together Cromwell and Alexandra are home to just over 50% of the District’s population. The small town of Clyde (population just over 1,000) is located 7km north-west of Alexandra. Other small towns are located much further from Alexandra, with Roxburgh located 42km south and Ranfurly 89km north-east. A large proportion of Central Otago’s population lives in rural areas. The nearest larger towns are Wanaka (1 hour, or 84km north) and Queenstown (70 minutes or 90km north-west), both in Queenstown Lakes District. Access through the District is heavily constrained by topography, with road access to the north (Wanaka and Queenstown) limited to the road (State Highway 8) through the Cromwell Gorge. To the east access is limited to routes through the Manuherikia (SH85) or Ida Valleys, and SH8 is the only road in from the south. 2.1.2 The Site The proposed store will be located between Centennial Ave and Ventry St in Alexandra. The Site will be accessed by the public off Centennial Ave, with access from Ventry St limited to delivery vehicles. Centennial Ave is SH8, and the main route into Alexandra from the north (Queenstown, Wanaka, Cromwell, and Clyde). The Site is zoned Residential, and is currently occupied by nine dwellings, with neighbouring activities being residential to the north, and the Centennial Court Motor Inn to the south. Further description of the location of the proposed store is provided in section 3.1. 2.1.3 Catchment For this assessment we have assumed that the Countdown Alexandra’s catchment would be all of Central Otago District, although to recognise varying accessibility across that broad geographic area we have applied different market penetrations into each part of the catchment, defined by Statistics NZ’s Statistical Area 2s (“SA2s”). There are 10 SA2s in the District, yielding eight catchments, being Alexandra and Cromwell (each with two SA2s), and six predominantly rural SA2s. The District is a reasonable catchment to apply 2The Alexandra North and South SA2s (Statistical Areas). Note that these figures do not take into account the expected undercount of Census 2018, which is to be adjusted as a result of findings from the Post Enumeration Survey, due to be released before winter 2020. Page | 3
because the District boundary is broadly halfway between Alexandra and the nearest alternate supply. In
any case, the assessment is relatively insensitive to the exact outer boundary of the catchment because of
the very small population living near the boundary. The catchments applied are shown in Figure 2.1.

Figure 2.1: Central Otago study area catchments (SA2s), supermarkets and grocery stores

2.2        District Plan
The CODP contains objectives and policies relating to the Business Resource Area, including, most
importantly for this assessment:

               •   8.1.1: To maintain the business areas of the District’s urban areas as focal points for the
                   community.

               •   8.1.2: To ensure that the business areas are safe and convenient areas to visit and
                   conduct business within.

Page | 4
• 8.1.3: To maintain and enhance the environmental quality of the business areas to
ensure they remain pleasant places to visit and work.
• 8.2.1: To enable the development of a wide range of activities within the Business
Resource Area provided significant adverse effects are avoided, remedied or mitigated.
• 8.2.2: To ensure the visual amenity values of the Business Resource Areas are
maintained and enhanced.
The CODP therefore clearly sets out an expectation that the Business Resource Areas will continue to
function as focal points for the community, and will be pleasant and convenient places to visit. Assessment
of the application’s merits locating in the Residential Resource Area have already been provided in the AEE,
and this report focusses on effects of the proposal on the Business Areas with reference to CODP objectives
and policies. That assessment is provided in section 4.4.
2.3 Household projections
The projections used in this section are derived from high growth scenario household projections supplied
by Statistics NZ 3 Recent advice4 from Statistics NZ is that high growth scenario projections are the most
appropriate scenario for Central Otago, and CODC’s demographic advisers Rationale Ltd provided similar
advice in late 2018, replacing previous advice that the medium scenario was more appropriate. Preliminary
indications from Census 2018 are that population growth from 2013 to 2019 averaged 800 people a year,
much higher than the 400 previously projected under the medium growth scenario in that period. In any
case the projections are presented to show that the market is expected to grow, which means that impacts
of the proposed Countdown will be greatest on opening, rather than in the medium-long term. That then
means the impact assessment is not sensitive to the projections beyond the short-term, and the
conclusions would be unchanged whether medium or high scenario projections were used.
Alexandra and Cromwell are a similar size in terms of household numbers, with Alexandra home to around
100 more households (2,490 vs 2,390). Growth of around 1.5% per year on average is projected in the
District’s two largest towns, with Alexandra projected to grow more slowly (+400 households over the next
13 years) than Cromwell (+550 households). By 2033 there are projected to be nearly 2,900 households in
Alexandra. Total District household counts are projected to increase from 9,320 in 2020 to 11,260 in 2033
(Figure 2.2).
3 Projections were supplied for all NZ Census Area Units, and we have spatially allocated those down to meshblocks then up to
SA2s to reflect Statistics NZ’s new statistical geographies. New projections based on Census 2018 will not be available until mid-
2020 at the earliest, so these projections do not take into account any learnings from Census 2018.
4 https://www.stats.govt.nz/assets/Uploads/Subnational-population-projections/Download-data/2013-base-subnational-
population-projection-indication-december-2019.xlsx
Page | 5Figure 2.2: Central Otago household projections (medium projection)
Growth 2020-2033
Catchment 2020 2022 2023 2028 2033
n %
Alexandra 2,490 2,560 2,590 2,750 2,890 400 16%
Cromwell 2,390 2,480 2,520 2,740 2,940 550 23%
Teviot Valley 760 770 780 810 820 60 8%
Maniototo 760 770 780 820 850 90 12%
Manuherikia-Ida Valleys 530 550 570 620 680 150 28%
Lindis-Nevis Valleys 870 920 940 1,040 1,150 280 32%
Dunstan-Galloway 1,220 1,270 1,290 1,410 1,530 310 25%
Earnscleugh 300 320 330 360 400 100 33%
Total COD 9,320 9,640 9,800 10,550 11,260 1,940 21%
2.4 Demand projections
Households will be an important driver of retail spending in Central Otago, although less so than in many
other places in New Zealand, given the importance of tourism in the Central Otago economy, and the
significant contribution made to the retail economy by travellers visiting and passing through the District.
Demand from all of these market segments and businesses is summarised below as the basis for
understanding the pool of supermarket and grocery spending that is directed to Central Otago businesses.
Total supermarket and grocery store demand generated by resident households and businesses, and
tourists overnighting in the District in Central Otago is around $107m, with additional spend from
consumers that cannot be statistically linked to the area, such as visitors passing through. That total
demand is projected to increase by $35m between 2020 and 2033 (33%) (Figure 2.3). As discussed below
in section 4.2 the proposed Countdown store is viable in Alexandra, and these ongoing growth projections
will only increase the sales directed to it and all other supermarkets in the District.
These growth rates take into account historically observed trends for households to spend more on retail
goods over time.5. A description of the demand model used for these projections is provided in Appendix
1.
5 Assumed to continue at the average annual rate of 1%
Page | 6Figure 2.3: Central Otago supermarket and grocery demand projections ($m)
Growth 2020-2033
Catchment 2020 2022 2023 2028 2033
n %
Alexandra $ 26.7 $ 27.7 $ 28.3 $ 31.3 $ 34.4 $ 7.7 29%
Cromwell $ 29.3 $ 30.8 $ 31.5 $ 35.4 $ 39.4 $ 10.0 34%
Teviot Valley $ 8.0 $ 8.3 $ 8.4 $ 9.2 $ 9.9 $ 1.9 24%
Maniototo $ 9.6 $ 10.0 $ 10.2 $ 11.4 $ 12.6 $ 3.0 31%
Manuherikia-Ida Valleys $ 6.1 $ 6.4 $ 6.6 $ 7.5 $ 8.5 $ 2.4 38%
Lindis-Nevis Valleys $ 9.8 $ 10.4 $ 10.7 $ 12.2 $ 13.9 $ 4.0 41%
Dunstan-Galloway $ 13.4 $ 14.1 $ 14.5 $ 16.3 $ 18.4 $ 5.0 37%
Earnscleugh $ 3.5 $ 3.7 $ 3.8 $ 4.3 $ 4.9 $ 1.4 39%
Total COD $ 106.5 $ 111.5 $ 114.0 $ 127.8 $ 141.8 $ 35.4 33%
Figure 2.3 does not describe where that demand is directed to, and that is discussed in section 3.2.1. That
assessment shows that the vast majority of that Alexandra demand, and a large share of spend from
elsewhere in Central Otago and beyond is directed to Alexandra’s supermarket and grocery stores. The
market share and demand information, together with assumptions about store performance, flow into the
impact assessment in section 4.
2.5 Supermarket and grocery store supply
The 12 stores included in the assessment are a mix of supermarkets and smaller grocery stores. Excluded
are several dairies that play a strongly convenience role for their towns, sometimes in association with
other activities (e.g. stores in Roxburgh and Ranfurly that are joined dairy and takeaways), which are
assumed to be unaffected by virtue of their distance from Alexandra, the small size of the stores, the local
focus of those stores and the presence of other activities in the same tenancy (e.g. takeaways).
The largest single store is the New World Alexandra (3,150m2 GFA), estimated from Marketview data
(section 3.2.1) to be trading very strongly at over $21,000/m2, which would place it in the top tranche of
stores in the banner nationwide. There is a similar quantum of GFA (3,580m2) in Cromwell’s two
supermarkets (New World and FreshChoice), although both stores individually are much smaller than the
New World Alexandra (Figure 2.4).
Page | 7Figure 2.4: Central Otago supermarket and grocery store supply (2020)
Sales
Store GFA
$m $/m2
New World Alexandra 3,150 $ 66.7 $ 21,200
Four Square Alexandra 450 $ 4.3 $ 9,500
Bin Inn Alexandra 150 $ 1.4 $ 9,500
Night 'n Day Alexandra 150 $ 1.3 $ 8,500
New World Cromwell 2,200 $ 24.1 $ 11,000
FreshChoice Cromwell 1,380 $ 14.4 $ 10,400
Night 'n Day Cromwell 220 $ 2.1 $ 9,400
Old Town Store Cromwell 120 $ 1.1 $ 9,400
Four Square Maniototo 600 $ 4.3 $ 7,200
Ranfurly Supermarket 300 $ 2.2 $ 7,200
Four Square Clyde 350 $ 4.0 $ 11,400
SuperValue Roxburgh 470 $ 4.4 $ 9,300
Total 9,540 $ 130.2 $ 13,700
There are no other full-scale supermarkets in Central Otago, with other stores being smaller grocery stores
that service small towns and their hinterlands that are not large enough to support a larger store. That
means that to access larger stores, residents living outside Cromwell and Alexandra have to travel to those
locations to visit a larger supermarket, and from the market share data in section 3.2.1 at least half and
often closer to 70% of supermarket and grocery spend resident in each sub-catchment is directed to the
larger stores in Alexandra and Cromwell.
From the demand projections in section 2.4, only Cromwell and the Lindis-Nevis Valleys form the natural
catchment for Cromwell’s supermarkets, with all of the rest of Central Otago closer to Alexandra. Alexandra
then is the closest supermarket destination for 63% of District supermarket spending, and Cromwell closest
for 37%. That explains why the sole Alexandra supermarket (New World) is estimated to be performing at
nearly twice the sales productivity ($/m2) of the two Cromwell supermarkets, and is likely why Alexandra
has been identified by Woolworths as a good location for a Countdown store.
2.6 Centres survey
To understand the specific factual context within which each store is operating, and which will influence
the indirect effects assessed in section 4.4, we have undertaken a centres assessment of Central Otago’s
retail and commercial centres. The aim of the assessment is to understand the current size and role of, and
range of activities established within each centre. The centres assessed are those containing supermarkets
or grocery stores, as identified in section 4.2, and there is minimal presence of retail activities in other
places.
Employment has been assessed only for the centre, not for the entire urban area, so in Figure 2.5 reference
to “Alexandra” means the Alexandra Business Resource Area. Note, however, that the data comes from
Statistics NZ’s Business Directory, and the most detailed spatial resolution of that dataset (Statistical Area
1, or “SA1”) does not coincide exactly with zoning boundaries, so the spatial areas summarised will include
employment in some adjacent areas and there is no way of identifying the exact employment by zone.
Page | 8The data shows that the Alexandra centre is the largest in the District, with 1,870 total MECs6, nearly twice
the size of Cromwell (950 MECs), although the two centres are more similar when considering only retail
and hospitality MECs (Alexandra 560 MECs, Cromwell 480). Cromwell is much more dominated by retail
and hospitality employment, which makes up 51% of that centre’s employment, compared to Alexandra
(30%). A summary of centre activity follows.
Figure 2.5: Central Otago District employment by location (2019)
Sector Alexandra* Cromwell Clyde Roxburgh Ranfurly Non-centre Total CODC
Workers
Supermarket and grocery stores 200 180 10 20 40 20 470
Other food retail 20 20 - - - 20 60
Comparison retail 200 130 - 30 10 150 520
Hospitality 140 150 50 20 10 280 650
Retail and hospitality 560 480 60 70 60 470 1,700
Household services 330 130 - 10 20 490 980
Office 270 50 10 - 20 670 1,020
Public admin 170 10 - 10 10 50 250
Education and health 100 100 10 60 50 720 1,040
Industrial and rural 390 180 50 40 90 8,600 9,350
Other 50 - 60 - 40 470 620
Total 1,870 950 190 190 290 11,470 14,960
Structure
Supermarket and grocery stores 11% 19% 5% 11% 14% 0% 3%
Other food retail 1% 2% 0% 0% 0% 0% 0%
Comparison retail 11% 14% 0% 16% 3% 1% 3%
Hospitality 7% 16% 26% 11% 3% 2% 4%
Retail and hospitality 30% 51% 32% 37% 21% 4% 11%
Household services 18% 14% 0% 5% 7% 4% 7%
Office 14% 5% 5% 0% 7% 6% 7%
Public admin 9% 1% 0% 5% 3% 0% 2%
Education and health 5% 11% 5% 32% 17% 6% 7%
Industrial and rural 21% 19% 26% 21% 31% 75% 63%
Other 3% 0% 32% 0% 14% 4% 4%
Total 100% 100% 100% 100% 100% 100% 100%
*Employment is in each centre, not the total for the entire urban area of each town
2.6.1 Alexandra
Alexandra has many more workers engaged in household services (330 MECs), offices (270 MECs), and
public administration (170 MECs) than Cromwell, or any other centre in the District, and is also the
dominant centre for retail activity. Alexandra accommodates a broad range of businesses across retail,
commercial and service sectors including:
6 Modified Employment Count, a measure of employment that includes paid employees and working proprietors
Page | 9• Large retail anchors at either end of the centre, namely the District’s only department
store (The Warehouse, 70 MECs) and the existing New World supermarket (180 MECs).
• A wide range of smaller retail businesses, including stores selling clothing, footwear and
accessories, jewellery, furniture, floor coverings, appliances, sporting goods, hardware,
books and stationery, and pharmaceuticals.
• Specialist food retailers, including butcher, bakery, delicatessen and a Bin Inn
(wholefood and specialty groceries).
• A wide range of restaurants, cafes, takeaways, and bars, including national brands and
locally owned enterprises.
• Household services businesses including hair and beauty, travel agents and a
laundrette.
• Medical professionals, including dentists, medical centre, maternity hospital, physios,
and chiropractors.
• The District’s largest concentration of civic and community services, including the
council offices, library, Court, police station, ACC office, Ministry of Social Development,
and Alexandra Community House.
• Commercial activities including banks and professional offices such as real estate,
lawyers, insurance, engineers, and accountants.
• Tourism-oriented businesses, including i-Site, the Central Otago tourism agency and
accommodation such as backpackers and a hotel, with more in the surrounding
residential zone.
Alexandra functions as a service centre for Central Otago, with some higher order activities (computer
retail, marine equipment, housewares, and specialist professional services such as advertising and
marketing) not present in the town, and likely directed out of the District to Wanaka, Queenstown, or
Dunedin. However, there is a broad range of activities across all sectors represented in Alexandra,
indicating the centre’s importance to and pre-eminence within the District economy.
The Alexandra centre appears to be in excellent health at present, with only four retail and office vacancies
listed7:
• 1/86 Centennial Ave, 100m2 retail tenancy, recently occupied by flooring company
which shifted to larger purpose built premises in Cromwell.
• 2/86 Centennial Ave, a small (64m2) beauty salon which was operating as recently as
March 23 2020, but which is apparently now seeking to vacate the tenancy.
7 From a search of TradeMe Property, 7 April 2020
Page | 10• 108 Tarbert St, a large (1,083m2) farm and lifestyle equipment showroom that is still
operating from the premises, but the business (and property) owner is now seeking to
vacate the tenancy.
• 77 Centennial Ave, a 550m2 retail showroom near the New World that is vacant.
2.6.2 Cromwell
Cromwell is a smaller centre than Alexandra, with a more limited range of office and public administration
employment than Alexandra, but a similar quantum of retail employment. The Cromwell centre is anchored
by two supermarkets (New World and FreshChoice), with two large hardware/home improvement stores
(Mitre 10 and Placemakers). As with Alexandra, there is a wide range of retail and household service activity
in the centre, including:
• Smaller retail businesses, including a garden centre and stores selling clothing, sporting
goods, books, and stationery, agricultural supplies, and pharmaceuticals.
• Specialist food retailers, including butcher, bakery, delicatessen.
• A wide range of restaurants, cafes, takeaways, and bars, including national brands and
locally owned enterprises.
• Household services businesses including hair and beauty, a day spa and a travel agent.
• Medical professionals, including dentists, medical centres, physios, and osteopath.
• Several civic and community services, including the library, Council offices, museum,
and community house.
• Commercial activities including banks and professional offices such as real estate,
lawyers, insurance, surveyors, and accountants.
• Several motels in the surrounding residential zone.
There is some degree of replication of the retail and service activities found in Cromwell and Alexandra,
with the two stores servicing distinct catchments for most of the more frequently purchased goods and
services, and Alexandra the more dominant destination for less frequently purchased goods and services,
although still lacking the most specialised businesses which are not represented at all in Central Otago
District.
There is only one tenancy listed for lease in Cromwell,8 a 105m2 tenancy at 26 The Mall which will only be
available for occupation on 1 May 2020.
A smaller Business Resource Area zone is located in the Cromwell Heritage Precinct, although stores there
are tourist oriented, including cafes, an art gallery and gift shop, predominantly based in heritage buildings.
None are vacant.
8 Trade Me Property, 7 April 2020
Page | 112.6.3 Clyde Clyde is a much smaller centre than both Cromwell and Alexandra, with the most notable retail presence being a small Four Square grocery store, and most of the other employment in the centre being in accommodation or hospitality related (cafes and takeaways). The limited retail presence provides for only a small part of the town’s retail needs, although because Alexandra is so close (7km south) there is little need for a wider range of businesses, with those present having a tourism focus and leveraging off the appeal of the town’s heritage buildings. Clyde’s population is just over 1,000 people (Census 2018). There are no vacant retail tenancies listed on TradeMe Property (as of 7 April 2020). 2.6.4 Roxburgh Roxburgh has a small retail and commercial centre 30 minutes south of Alexandra, with a number of cafes, a grocery store, clothing store and pharmacy. The limited range of retail and services businesses reflects the limited retail demand resident in the town of less than 600 population, 9 and the proximity to Alexandra which provides for most of the town’s retail and service needs. There are no vacant retail tenancies listed on TradeMe Property (as of 7 April 2020). 2.6.5 Ranfurly Ranfurly is the town the greatest distance from the Alexandra-Cromwell retail and tourism core of the District, an hour east of Alexandra. However, the town’s population is only around 720, 10 which is insufficient to support a large retail or services base. Apart from the Four Square and small independent supermarket, there are few other retail or services businesses in the town, with a pharmacy, book store, and hairdresser, and little in the way of cafes or restaurants. There is one vacant tenancy listed on TradeMe Property (as of 7 April 2020), a 190m2 restaurant at 3 John St. 9 Census 2018 10 Census 2018 Page | 12
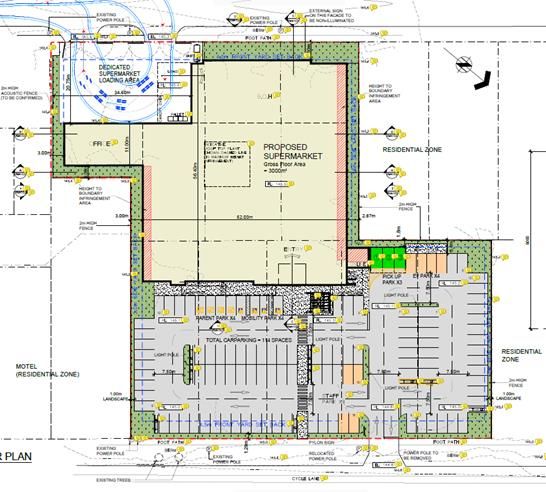
3               Proposed development
3.1             The proposed development
The application is to develop a new 3,000m2 gross floor area (“GFA”) Countdown supermarket across nine
residential properties11 on the northern fringe of the Alexandra town centre. The 3,000m2 store includes
the supermarket shop floor and back of house areas for storage, preparation, and offices etc.
Approximately 135m2 of rooftop plant is excluded from that GFA. No other retail is proposed for the Site.
The carpark is entered off Centennial Ave (Figure 3.1).

The Site is zoned Residential in the CODP, while to the southeast land fronting Centennial Avenue is the
Business Resource Area. The Business Resource Area is the Alexandra town centre, the northern edge of
which is some 75m south-east of the southern boundary of the Site, with only the Centennial Court Motor
Inn in between (which is zoned Residential) (Figure 3.2).

Figure 3.1: Proposed Countdown Alexandra

11   102, 104, 106, 108 and 110 Centennial Ave, and 57, 59, 61 and 63 Ventry St

Page | 13
Figure 3.2: Alexandra Business Resource Area and proposed Countdown site

3.2         Sales performance
This section assesses the potential sales performance of the proposed supermarket, as input to the impact
assessment, where the sales attributed to the supermarket will be diverted away from other supermarkets
and grocery stores, resulting in a decrease in sales at those stores.

3.2.1       Market share
To assess the potential sales of the proposed Countdown Alexandra, we have used the catchments
described in section 2.1 as the base for estimating likely sales capture across the study area. The capture
rates we have applied are based on data obtained from Verisk Marketview. Marketview data identifies
credit and debit card transactions from BNZ customers, and establishes the geographic link between the
residential address of the cardholders and the location and type of merchant involved in the transaction. It
is estimated that the Marketview transactions data accounts for approximately 15% of all retail spending
in the NZ economy. Marketview data is only made available in an aggregated form that protects the
confidentiality of customers and the commercial sensitivity of merchants and is factored up to reflect whole
of economy spending.

Page | 14
Data used in the assessment was commissioned specifically for this project, and covers the 2019 calendar
year. Data was provided for:

               •   The origin of spend in businesses in three merchant locations (Alexandra, Cromwell,
                   Rest of Central Otago)

               •   The destination of spend by people living in seven customer origin locations (Alexandra,
                   Cromwell, Rest of Central Otago, Queenstown Lakes District, Rest of Otago, Southland,
                   All Other Locations).

               •   All food retail stores (supermarket and grocery stores, fresh meat, fish and poultry
                   retailing, fruit and vegetable retailing, other specialised food retailing). It was necessary
                   to group all of those storetypes to satisfy Marketview’s confidentiality rules to ensure
                   there were sufficient businesses in each location.

That data provides an understanding of retail flows into and out of each town in Central Otago, and gives
a basis for estimating potential future changes to these patterns, as the catchment population and its retail
spending increases and can sustain a larger number and broader range of stores.

Applying the Marketview market share data to retail demand projections provides an indication of future
estimated retail sales in each store location. Some estimates have been applied to fill in gaps in market
share information where Marketview data was unavailable, namely the smaller towns in Central Otago
where there are only one or two food retailers (Clyde, Ranfurly, Roxburgh).

Notable findings from that data include that:

               •   Stores in Alexandra and Cromwell both capture very high proportions (84-86%) of the
                   demand resident in their respective towns.

               •   Residents of Alexandra and Cromwell direct only very small shares of their spending to
                   the other town (i.e. only 3% of Alexandra spend goes to Cromwell, and 4% flows the
                   other way).

               •   Very high shares of the sales in food retail merchants in each town come from people
                   not resident in Central Otago, both NZers and international visitors: 36% of spend in
                   Alexandra, 20% in Cromwell stores and 44% in other Central Otago food retailers. These
                   are very high non-local shares compared to a suburban metropolitan store which might
                   attract 10% non-local spend, and underlines the importance of tourism to the local
                   economy.

These market shares are consistent with what we know about how supermarkets operate – that the highest
shares are captured close to the store and much lower shares are captured when there is another store (of
any brand) closer to consumers than the new store is. This is especially pronounced in rural areas, where
the distance to the nearest alternative supermarket tends to be large, and there is a disincentive to drive
past a large supermarket of one brand to visit a similar sized store much further away.

Page | 15
3.2.2 Countdown sales
In this case we expect that Alexandra with two supermarkets (New World and Countdown) would have a
very similar market share from each catchment within Central Otago as Alexandra with only one
supermarket, addressed as two scenarios:
• Scenario 1: all of the sales from the new Countdown will be diverted away from other
stores in Alexandra only. This reflects an outcome in which established shopping
patterns are entrenched and unlikely to change as a result of the addition of a new
brand into the Alexandra supermarket marketplace.
• Scenario 2: Alexandra becomes a more attractive supermarket destination by virtue of
having two supermarkets of different brands. The share of spend from each location
that is directed to Alexandra would increase by 5%. That is a reasonable increase in
attractiveness, given the main driver of attractiveness in rural supermarket catchments
such as this is proximity and accessibility, rather than brand, so the introduction of a
new brand supermarket adjacent to an existing store will have little effect on
supermarket shopping patterns between towns.
This means that under scenario 1 Alexandra would not become a much more attractive supermarket
destination despite having two different brands represented, yielding a smaller pool of spending to go
around Alexandra’s food retail stores compared to if Alexandra had been assumed to become a more
attractive destination. Under scenario 2 the impacts on Alexandra stores would reduce (very slightly, and
not materially) compared to the nil market growth scenario adopted.
Under scenario 1 the proposed Countdown Alexandra would attract some 38% of the supermarket spend
resident in Alexandra, with the slightly larger New World Store in the town attracting 40%, the Four Square
4%, and the Bin Inn and Night and Day around 1% each. Those shares sum to 86%, which is the market
share of all of those stores now, as identified in the Marketview data. The other 14% of Alexandra residents’
spending on food retail goes to other locations, including spend on holiday in other parts of NZ. The
modelling assumes that the Alexandra Countdown and New World would achieve identical sales per m2,
and because the New World is slightly larger (3,150m2 GFA compared to 3,000m2) it would generate slightly
more sales, with a higher market share. In reality it would likely take several years for the new Countdown
to reach a similar level of sales performance as the long-established New World, as supermarkets typically
take at least three years, and often longer, to reach a ‘mature’ level of sales. The applied assumption of
immediately reaching a mature level of sales is a conservative one which will tend to overstate impacts in
the short-term.
The Marketview data also shows relatively large shares directed to Alexandra from surrounding rural areas
for which Alexandra is the nearest town and retail centre, especially:
• Manuherikia-Ida Valleys, from which 72% of spend is directed to Alexandra, resulting in
the proposed Countdown capturing 35% of spend). There is no supermarket destination
in the catchment.
Page | 16• Teviot Valley, from which 60% of spend is directed to Alexandra, including 29% to the
new Countdown. This catchment includes Roxburgh, where the SuperValue is an
alternative to Alexandra’s supermarket for consumers.
• Earnscleugh and Dunstan-Galloway (56% to Alexandra, including 27% to the
Countdown), with shares directed to the nearby, but small Four Square Clyde.
• Maniototo (50% to Alexandra, including 25% to Countdown), with 36% directed locally
(the Ranfurly Four Square or Ranfurly Supermarket).
Only very small shares (c.2%) would be directed to Alexandra from northern parts of the District (Cromwell
and the Lindis and Nevis Valleys), with consumers in those areas retaining a very strong preference to direct
their supermarket spending towards one of the two supermarkets (New World and FreshChoice) in
Cromwell. In line with the Marketview data assessed, the Countdown Alexandra would be expected to
make 36% of its sales to consumers not resident in Central Otago District, including tourists staying in the
District for a night (whether in commercial or private accommodation) and those just passing through.
Applying those market shares to the demand projections in section 2.4 indicates that the Countdown
Alexandra would be expected to achieve sales of $35.9m in the first full year of its operation (assumed to
be 2022) under scenario 1 (Figure 3.3). That equates to $12,000/m2, the same performance as is applied
to the existing New World after the proposed Countdown opens, as assessed in section 4.2. Under scenario
2 a broader attraction would yield $36.9m in sales, although with a much different distribution of impacts
(assessed in section 4.2.2).
Figure 3.3: Countdown Alexandra Sales Potential (2022), Scenario 1
Spend to
Market Origin of
Catchment Alexandra
share sales
CD
Alexandra 38% $ 10.7 30%
Cromwell 2% $ 0.6 2%
Teviot Valley 26% $ 2.1 6%
Maniototo 24% $ 2.4 7%
Manuherikia-Ida Valleys 34% $ 2.2 6%
Lindis-Nevis Valleys 2% $ 0.2 1%
Dunstan-Galloway 27% $ 3.9 11%
Earnscleugh 25% $ 0.9 3%
Total COD $ 23.0 64%
Outside COD $ 12.9 36%
Total Alexandra CD sales $ 35.9 100%
Page | 174 Impact assessment
This section summarises the results of the impact assessment.
4.1 Impact types
There are two main types of potential effects of the proposed development relevant to this assessment:
• Direct Impacts: These arise when a new store opens and causes a redistribution of retail
spending among existing stores, and a decrease in sales at some existing stores. Impacts
of this type are the effects of trade competition, and cannot be considered under the
RMA.
• Indirect Impacts: These arise as the flow-on consequence of direct impacts, and are
relevant under the RMA. As consumer travel patterns change, patronage of the centres
that those stores are in could also change. A decrease in patronage could have adverse
impacts on centres’ amenity, vitality, or vibrancy, making them less attractive places to
visit. Indirect impacts may not occur if centre patronage does not change, such as when
trips to a new development are additional to, and not a replacement for an existing
centre visit.
4.2 Direct retail impacts
4.2.1 Approach
By applying the expected market shares that the Countdown Alexandra will capture from each catchment
to the total demand from that catchment, we have, in section 3.2.2, estimated the sales potential of the
proposed store. To assess the direct impacts in this section, we apply two scenarios to test different impact
distributions, as described in section 3.2.2:
Using those two scenarios we have then applied the current origin-destination pattern (where people from
each part of the study area spend at supermarkets) to the amount of spend that we expect the Countdown
Alexandra to capture from each catchment. That yields an estimate of the amount of spend that will be
diverted from each existing supermarket. The impacts presented describe the difference in store sales with
the Countdown Alexandra in operation in 2022 compared to their expected sales if the Countdown
Alexandra were not to open. That opening year (2022) is the focus of impacts because it is the year when
total demand is smallest, and therefore when there is least spend to be allocated across all stores, and
hence when impacts on those stores would be greatest. After 2022, ongoing market growth would mitigate
those impacts.
We have investigated whether there are any other new supermarket and grocery stores in the pipeline in
Central Otago, but have found no indication that there are any plans for new stores. Plans to expand New
Page | 18World Cromwell are in the pipeline,12 reflecting recognition of ongoing growth potential in the area. Those
plans are not yet sufficiently advanced that the possible incremental expansion (+20%) of Cromwell
supermarket floorspace has been included in the impact assessment. An expansion of that scale would not
have any adverse effects on the viability of either Cromwell supermarket, nor, given the market distinction
between Cromwell and Alexandra (section 3.2.1) stores in Alexandra. Instead an expansion of the scale
identified represents forward planning in recognition of both healthy existing demand and projected
market growth. The Cromwell FreshChoice only opened in 2018, and no expansion plans for that store have
been identified.
Woolworth’s current application is all that is likely to change in Alexandra given the New World expanded
only two and a half years ago. Other towns in Central Otago are not large enough to support full service
supermarkets. That indicates it is likely that there are no plans for new stores in the District, beyond
Woolworths’ current proposal. That then indicates there will be no cumulative effects that need to be
considered as part of this assessment.
4.2.2 Results
The 12 supermarkets and grocery stores in the study area have current (2020) turnover of an estimated
$136m, at an average turnover of $14,200/m2. By 2022 (the assumed opening date of the proposed
Countdown Alexandra) their sales are projected to increase to $142m, a 5% increase in two years, which is
consistent with medium population growth in that time, and an allowance for a 1% increase in real spend
per household, in line with recent trends (Figure 4.1). As noted in section 3.2.2, the projected sales of the
Countdown Alexandra reflect a mature level of sales that would be unlikely to be achieved for several years
after opening, but are assumed to be achieved at opening for this assessment to reflect a maximum impacts
scenario.
Figure 4.1: Supermarket sales without Countdown Alexandra
2020 sales 2022 projected sales
Store GFA
$m $/m2 $m $/m2
New World Alexandra 3,150 $ 69.5 $ 22,100 $ 72.6 $ 23,000
Four Square Alexandra 450 $ 4.5 $ 9,900 $ 4.7 $ 10,400
Bin Inn Alexandra 150 $ 1.5 $ 9,900 $ 1.6 $ 10,400
Night 'n Day Alexandra 150 $ 1.3 $ 8,800 $ 1.4 $ 9,200
New World Cromwell 2,200 $ 25.1 $ 11,400 $ 26.3 $ 12,000
FreshChoice Cromwell 1,380 $ 15.0 $ 10,900 $ 15.7 $ 11,400
Night 'n Day Cromwell 220 $ 2.1 $ 9,800 $ 2.3 $ 10,300
Old Town Store Cromwell 120 $ 1.2 $ 9,800 $ 1.2 $ 10,300
Four Square Maniototo 600 $ 4.5 $ 7,500 $ 4.7 $ 7,800
Ranfurly Supermarket 300 $ 2.2 $ 7,500 $ 2.4 $ 7,800
Four Square Clyde 350 $ 4.1 $ 11,800 $ 4.3 $ 12,400
SuperValue Roxburgh 470 $ 4.5 $ 9,700 $ 4.7 $ 10,000
Total 9,540 $ 135.6 $ 14,200 $ 141.9 $ 14,900
12 https://www.odt.co.nz/regions/central-otago/supermarket-seeks-greenway-growth
Page | 19When the proposed Countdown Alexandra opens it would draw sales away from existing stores, and the
sum of all sales diverted from other locations would be the $35.9m of sales estimated in section 3.2.2
(under scenario 1), or slightly higher at $36.9m under scenario 2. Note that under scenario 2 the sum of
sales diverted from the 12 stores will be very slightly lower than the $36.9m total, with allowance for $0.2m
to be diverted from non-Central Otago stores, in line with Marketview data.
The assessment shows that there is sufficient demand directed to supermarkets and grocery stores in
Central Otago generally, and Alexandra in particular, to support two supermarkets in Alexandra. The store
projected to be most impacted by the Countdown Alexandra opening is the New World Alexandra, which
shares the greatest competitive overlap with the Countdown, is most similar in size and is closest, with the
closest parts of the two supermarket sites only 60m apart. The very strong current sales performance of
New World Alexandra will be reduced closer to national average performance levels, allowing a new
supermarket to establish in the town with the associated benefits that provides for consumers (increased
choice, less congested store, and access, etc.).
Other stores in Alexandra have points of difference to the proposed Countdown that would result in lower
impacts on them compared to the New World:
• The Four Square and Night 'n Day stores are much smaller than the New World (450m 2
and 150m2 respectively), and function like dairies, offering a convenience-based
product range for a smaller localised catchment. Those stores would be less attractive
to non-locals, and function less as destination stores than larger supermarkets do.
• The Bin Inn is a wholefood and bulk product store which competes with supermarkets
to some extent, but is distinguished by the nature of its products, and more limited
range than the New World and Countdown.
The Marketview data shows that there is a very strong local focus to supermarkets in Central Otago, so
consumers are very unlikely to travel from their home in Cromwell to shop in Alexandra, or the reverse.
That has a strong bearing on the impacts assessed. Under scenario 1 that local preference is assumed to
be so strong that consumers that currently shop in Alexandra would continue to do so, albeit splitting their
spending across two main supermarkets rather than having only one option. The increase in Alexandra
supermarket supply is assumed to not result in the town attracting any more supermarket spend, so
viability of the proposed store is not predicated on a change in shopping practices. However some change
in shopping patterns may result from the introduction of a Countdown into the Alexandra market. Both
Countdown Queenstown and Fresh Choice Cromwell deliver to Alexandra, indicating some extant leakage
of demand from Alexandra and demand for presence of a Woolworths brand in the town.
Under scenario 1 the New World would experience 97% of the impacts, that is, contribute 97% of the sales
of the new Countdown. Under scenario 2 the New World would contribute a lower share of sales (92%),
with more spend flowing into Alexandra and away from the stores in Ranfurly, Clyde and Roxburgh. Those
shares may be lower if the arrival of the Countdown results in reduced leakage of spend through deliveries
received from Countdown Queenstown and Fresh Choice Cromwell.
Impacts on the sales of the New World Alexandra are projected to be significant, at close to 50% under
both scenarios (Figure 4.2 and Figure 4.3). However, because the store is estimated to be trading so
strongly now, even that large percentage impact would leave the store performing at a reasonable level
Page | 20for New Worlds in a national context, at $11,300-11,700/m2, generating sales of $36-37m a year in the year
the Countdown opens.
Figure 4.2: Scenario 1: Direct retail impacts on supermarket sales (in 2022) without and with Countdown
2022 wo 2022 w CD impact
Store
CD CD $m %
New World Alexandra $ 72.6 $ 37.7 -$ 34.9 -48%
Four Square Alexandra $ 4.7 $ 4.1 -$ 0.6 -13%
Bin Inn Alexandra $ 1.6 $ 1.4 -$ 0.2 -13%
Night 'n Day Alexandra $ 1.4 $ 1.2 -$ 0.2 -13%
New World Cromwell $ 26.3 $ 26.3 $ - 0%
FreshChoice Cromwell $ 15.7 $ 15.7 $ - 0%
Night 'n Day Cromwell $ 2.3 $ 2.3 $ - 0%
Old Town Store Cromwell $ 1.2 $ 1.2 $ - 0%
Four Square Maniototo $ 4.7 $ 4.7 $ - 0%
Ranfurly Supermarket $ 2.4 $ 2.4 $ - 0%
Four Square Clyde $ 4.3 $ 4.3 $ - 0%
SuperValue Roxburgh $ 4.7 $ 4.7 $ - 0%
Total excl CD Alexandra $ 141.9 $ 106.0 -$ 35.9
Countdown Alexandra $ - $ 35.9
Total incl CD Alexandra $ 141.9 $ 141.9
Figure 4.3: Scenario 2: Direct retail impacts on supermarket sales (in 2022) without and with Countdown
2022 wo 2022 w CD impact
Store
CD CD $m %
New World Alexandra $ 72.6 $ 38.8 -$ 33.8 -47%
Four Square Alexandra $ 4.7 $ 4.2 -$ 0.5 -11%
Bin Inn Alexandra $ 1.6 $ 1.4 -$ 0.2 -11%
Night 'n Day Alexandra $ 1.4 $ 1.2 -$ 0.1 -11%
New World Cromwell $ 26.3 $ 25.9 -$ 0.4 -2%
FreshChoice Cromwell $ 15.7 $ 15.5 -$ 0.2 -2%
Night 'n Day Cromwell $ 2.3 $ 2.2 -$ 0.0 -2%
Old Town Store Cromwell $ 1.2 $ 1.2 -$ 0.0 -2%
Four Square Maniototo $ 4.7 $ 4.4 -$ 0.3 -6%
Ranfurly Supermarket $ 2.4 $ 2.2 -$ 0.1 -6%
Four Square Clyde $ 4.3 $ 3.9 -$ 0.4 -10%
SuperValue Roxburgh $ 4.7 $ 4.3 -$ 0.4 -9%
Total excl CD Alexandra $ 141.9 $ 105.2 -$ 36.7
Countdown Alexandra $ - $ 36.9
Total incl CD Alexandra $ 141.9 $ 142.2
Other stores would have much lower impacts, with the three Alexandra grocery retailers (Four Square, Bin
Inn and Night ‘n Day) projected to experience a decrease in sales of 11-13%, although continuing to operate
Page | 21at a reasonable level for stores of that type (in terms of sales/m2). Scenario 1 reflects an outcome in which
sales are only diverted away from stores in Alexandra, hence trade competition effects on all stores outside
Alexandra are modelled to be nil under that scenario.
Under scenario 2 there would be a more widespread distribution of impacts from the new Countdown
Alexandra, with the proposed Countdown drawing spend from across the entire District:
• The largest effects on non-Alexandra stores would be on the Four Square Clyde (-10%),
where sales are modelled to decrease from $4.1m to $3.7m. That store has the largest
effects because it is not currently served by a large supermarket in the town, and is the
closest non-Alexandra grocery store to the proposed Countdown.
• The situation is very similar for SuperValue Roxburgh, the only grocery store in the town
some 30 minutes south of Alexandra. That store is projected to experience only slightly
smaller effects (-9%, from $4.5 to $4.1m) than the Clyde store. The Countdown
Alexandra would induce some diversion of demand from Roxburgh residents to
Alexandra, although because there is already a large New World in Alexandra the main
influence on spending patterns would be the introduction of a new brand rather than
an increase in GFA, and it is likely that Countdown would not fundamentally change
supermarket travel patterns.
• The two stores in Ranfurly (Four Square and the independent Ranfurly Supermarket)
are projected to experience -6% sales impacts. Those impacts are primarily generated
by some redistribution of spend from the rural Manuherikia-Ida Valleys catchment,
which is in between Alexandra and Ranfurly. Spend by Ranfurly locals would be unlikely
to change much. Both Ranfurly stores are estimated to be performing at what would be
low levels for a supermarket, but above average13 for small rural grocery stores
($7,400/m2 pre-impact). Sales in those stores would drop to around $6,900/m2, still in
excess of the range in which they would become unviable.
• The Cromwell stores are modelled to experience very small effects of around -2%. That
is because the catchments of those stores and the Alexandra supermarket do not
overlap substantially, given the strongly local focus of supermarket and grocery stores,
as described in section 3.2.1. The proposed Countdown Alexandra would not be
expected to change the fact that the vast majority of supermarket demand living in
Cromwell would be directed to Cromwell.
Another way to look at the impacts is to consider the change in each store’s sales relative to the current
(2020) level. This comparison speaks to the future viability of each store, given that stores can be assumed
to be viable at their current level. Due to growth in the period 2020-2022, the Cromwell stores would still
experience an increase in sales post-impact (under both scenarios) compared to current 2020 sales. Sales
in the other affected stores would be 2-4% less negative than assessed in Figure 4.2 and Figure 4.3, so
impacts on the Four Square Clyde would be -6% instead of -10% under scenario 2, on Supervalue Roxburgh
13 Which is close to $6,000/m2
Page | 22You can also read