Heavy-Duty Vehicle Tire Market Analysis Study - Transport ...
←
→
Page content transcription
If your browser does not render page correctly, please read the page content below
CHEMINFO

             Heavy-Duty Vehicle Tire
              Market Analysis Study

                           Final Report

                         August 30, 2017

                          Submitted to:

                        Transport Canada

                          Submitted By:

                     Cheminfo Services Inc.
                   30 Centurian Drive, Suite 205
                    Markham, Ontario L3R 8B8
                      Phone: 905-944-1160

                               and

           North American Council for Freight Efficiency
                   1750 K Street NW, Suite 400
                     Washington, DC 20006
                      Phone: 260-750-0106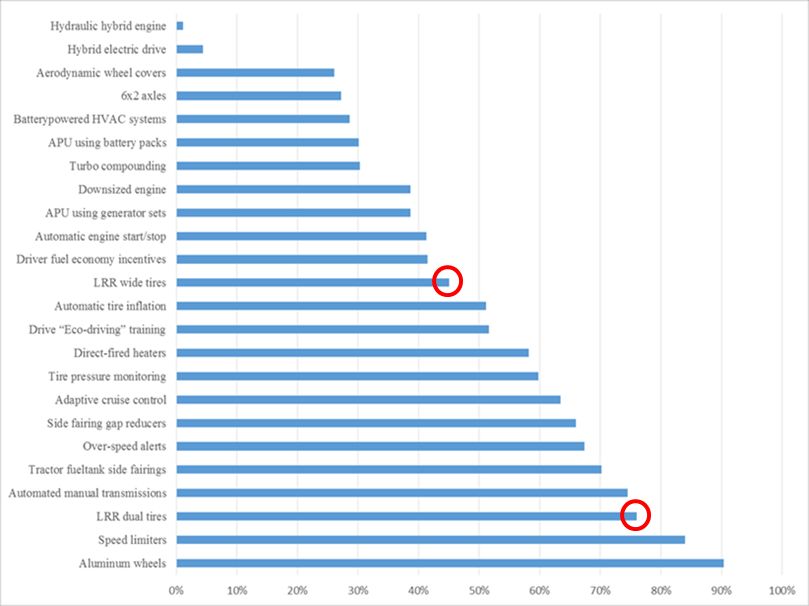
CHEMINFO

                                                 Table of Contents
1.       EXECUTIVE SUMMARY .................................................................................................................... 1
     1.1     INTRODUCTION ..................................................................................................................................... 1
     1.2     THE HEAVY-DUTY VEHICLE AND ENGINE GREENHOUSE GAS EMISSION REGULATIONS ........................................ 1
     1.3     FUEL ECONOMY OPTIONS AND LOW ROLLING RESISTANCE TIRES.................................................................... 2
     1.4     CANADIAN FLEETS ................................................................................................................................. 2
     1.5     TIRE MANUFACTURERS .......................................................................................................................... 3
     1.6     HEAVY-DUTY TRUCK MANUFACTURERS ..................................................................................................... 3
     1.7     HEAVY-DUTY TRUCK TRAILER MANUFACTURERS.......................................................................................... 3
     1.8     KEY FINDINGS AND CONCLUSIONS ............................................................................................................ 4
2.       INTRODUCTION .............................................................................................................................. 5
     2.1     CONTEXT ............................................................................................................................................. 5
     2.2     OBJECTIVES .......................................................................................................................................... 8
     2.3     METHODOLOGY .................................................................................................................................... 8
     2.4     STRUCTURE OF THIS REPORT.................................................................................................................... 9
3.       FUEL ECONOMY OPTIONS AND LOW ROLLING RESISTANCE TIRES ................................................ 10
     3.1 FUEL ECONOMY TECHNOLOGIES AND MEASURES ...................................................................................... 10
     3.2 LOW ROLLING RESISTANCE TIRES ............................................................................................................ 11
        3.2.1  Dual Tire Design Modifications Leading to Low Rolling Resistance ...................................... 11
        3.2.2  Wide Base Single Tires Leading to Low Rolling Resistance ................................................... 12
        3.2.3  Potential Advantages and Disadvantages of LRR Tires ........................................................ 13
        3.2.4  The SmartWay Program and SmartWay Verified Tires ........................................................ 14
        3.2.5  Adoption Rate for LRR Tires Among North American Truck Fleets ....................................... 14
4.       CANADIAN FLEETS......................................................................................................................... 18
     4.1 INTRODUCTION ................................................................................................................................... 18
     4.2 METHODOLOGY .................................................................................................................................. 18
     4.3 GEOGRAPHIC DISTRIBUTION OF THE FLEETS .............................................................................................. 19
     4.4 TYPES OF FLEETS ................................................................................................................................. 19
        4.4.1   For-Hire Fleets ....................................................................................................................... 20
        4.4.2   Private Fleets ........................................................................................................................ 21
        4.4.3   Rental Fleets ......................................................................................................................... 21
     4.5 TOTAL TRAVEL .................................................................................................................................... 22
     4.6 DISTRIBUTION OF FLEET TRAVEL ............................................................................................................. 23
     4.7 FLEET TIRES........................................................................................................................................ 24
     4.8 TIRES AND TRAVEL............................................................................................................................... 26
     4.9 PERSPECTIVES ON LOW ROLLING RESISTANCE AND WIDE BASE SINGLE TIRES .................................................. 26
        4.9.1   Low Rolling Resistance Duals ................................................................................................ 26
        4.9.2   Wide Base Singles ................................................................................................................. 27
        4.9.3   Comments from Fleets .......................................................................................................... 28

                                                                                 i
CHEMINFO
Table of Contents (Cont.)
5. TIRE MANUFACTURERS ................................................................................................................. 29
5.1 INTRODUCTION ................................................................................................................................... 29
5.2 SALES OF TIRES FOR HEAVY-DUTY TRUCKS IN CANADA ................................................................................ 29
5.3 PERCENTAGE OF ANNUAL SALES IN CANADA ESTIMATED TO BE LRR TIRES (2016) .......................................... 30
5.4 RANGE OF ROLLING RESISTANCE COEFFICIENTS (CRR) OFFERED ON LRR TIRES IN THE CANADIAN MARKET ........... 31
5.5 ADVANTAGES AND DISADVANTAGES OF LRR AND WIDE BASE TIRES ............................................................. 32
5.6 FUTURE PRODUCTION OF LRR TIRES ....................................................................................................... 33
6. HEAVY-DUTY TRUCK MANUFACTURERS ........................................................................................ 35
6.1 OVERVIEW OF THE MANUFACTURERS OF HEAVY-DUTY TRUCKS .................................................................... 35
6.2 ADOPTION RATE OF LRR TIRES ON HEAVY-DUTY TRUCKS SOLD IN CANADA (2016) ......................................... 36
6.3 PERCEIVED ADVANTAGES AND DISADVANTAGES OF LRR TIRES ..................................................................... 38
6.4 TRENDS IN THE ADOPTION OF LRR TIRES (2020) ON HEAVY-DUTY TRUCKS SUPPLIED TO THE CANADIAN MARKET 39
7. HEAVY-DUTY TRUCK TRAILER MANUFACTURERS .......................................................................... 40
7.1 OVERVIEW OF THE MANUFACTURERS OF HEAVY-DUTY TRUCK TRAILERS ........................................................ 40
7.2 ADOPTION RATE OF LRR TIRES ON HEAVY-DUTY TRUCK TRAILERS SOLD IN CANADA ........................................ 42
7.3 DISCUSSION OF ADVANTAGES AND DISADVANTAGES OF LRR TIRES ............................................................... 44
7.4 TRENDS IN THE ADOPTION OF LRR TIRES ON HEAVY-DUTY TRUCK TRAILERS SUPPLIED TO THE CANADIAN MARKET 45
8. KEY FINDINGS AND CONCLUSIONS................................................................................................ 46
8.1 CONTEXT ........................................................................................................................................... 46
8.2 CANADIAN FLEETS ............................................................................................................................... 46
8.3 TIRE MANUFACTURERS ........................................................................................................................ 47
8.4 TRUCK MANUFACTURERS ..................................................................................................................... 49
8.5 TRAILER MANUFACTURERS.................................................................................................................... 49
8.6 CONCLUSIONS .................................................................................................................................... 50
9. REFERENCES .................................................................................................................................. 51
APPENDIX A: FLEET SURVEY INSTRUMENT ............................................................................................ A-1
APPENDIX B: TIRE MANUFACTURERS SURVEY INSTRUMENT ................................................................ B-1
APPENDIX C: TRACTOR MANUFACTURERS SURVEY INSTRUMENT ........................................................ C-1
APPENDIX D: TRAILER MANUFACTURERS SURVEY INSTRUMENT ..........................................................D-1
APPENDIX E: DESCRIPTION OF LRR AND GHG MODEL ........................................................................... E-1
iiCHEMINFO
List of Tables
TABLE 1: SUMMARY OF TIRE SHARE INFORMATION, BY TIRE TYPE ................................................................................ 4
TABLE 2: TRUCK-BASED FUEL-SAVING TECHNOLOGIES AND STRATEGIES, BY FLEET SIZE .................................................. 17
TABLE 3: SURVEY SAMPLE HEAD OFFICE LOCATIONS ................................................................................................ 19
TABLE 4: SIZE OF THE FLEETS, BY TYPE .................................................................................................................. 19
TABLE 5: DISTRIBUTION OF DISTANCE TRAVELLED BY FLEETS ...................................................................................... 23
TABLE 6: REGIONAL SHARES OF FLEET TRAVEL (2016) ............................................................................................. 24
TABLE 7: NUMBERS OF TIRES ON TRACTORS AND TRAILERS, BY TYPE OF FLEET .............................................................. 24
TABLE 8: UPTAKE OF TIRES, BY TIRE AND FLEET TYPE ............................................................................................... 25
TABLE 9: 95% CONFIDENCE INTERVALS ................................................................................................................. 25
TABLE 10: TRAVEL BY TIRE TYPE (2016) ............................................................................................................... 26
TABLE 11: VIEWS OF LOW ROLLING RESISTANCE DUAL TIRES..................................................................................... 27
TABLE 12: VIEWS OF WIDE BASE SINGLE TIRES ....................................................................................................... 28
TABLE 13: PROJECTED SALES OF THE CANADIAN MEDIUM/HEAVY TIRE INDUSTRY (2016) .............................................. 30
TABLE 14: WEIGHTED AVERAGE TIRE SALES, BY TYPE (2016) ................................................................................... 30
TABLE 15: AVERAGED CRR PROVIDED BY FIVE SURVEY RESPONDENTS .......................................................................... 32
TABLE 16: SUMMARY OF ANTICIPATED CUSTOMER VIEWS ON LRR TIRES .................................................................... 33
TABLE 17: SUMMARY OF ANTICIPATED CUSTOMER VIEWS ON WIDE BASE SINGLE TIRES................................................. 33
TABLE 18: COMPARISON OF 2016 TO 2020 SALE SHARES ........................................................................................ 34
TABLE 19: CANADIAN CLASS 8 RETAIL SALES (2016) ............................................................................................... 35
TABLE 20: TOTAL NUMBER OF UNITS SOLD IN CANADA BY RESPONDENTS .................................................................... 36
TABLE 21: WEIGHTED AVERAGE SHARE OF SALES BY TIRE TYPE AND AXLE POSITION (2016) ........................................... 37
TABLE 22: SUMMARY OF MANUFACTURER VIEWS ON LRR TIRES ............................................................................... 38
TABLE 23: SUMMARY OF MANUFACTURER VIEWS ON WIDE BASE TIRES...................................................................... 38
TABLE 24: WEIGHTED AVERAGE SHARE OF SALES BY TIRE TYPE AND AXLE POSITION (2020) ........................................... 39
TABLE 25: NORTH AMERICAN TRAILER PRODUCTION FOR 2015 ................................................................................ 41
TABLE 26: MARKET SHARE BY TRAILER MANUFACTURER (2014) ............................................................................... 42
TABLE 27: SURVEY RESPONDENT SALES BY TRAILER TYPE .......................................................................................... 43
TABLE 28: SHARE OF TIRES, BY TYPE (WEIGHTED AVERAGE, 2016) ............................................................................ 43
TABLE 29: SHARE OF TIRES, BY TYPE FOR DRY VAN AND REFRIGERATED TRAILER MANUFACTURERS (, 2016) ..................... 43
TABLE 30: SUMMARY OF PERCEIVED CUSTOMER VIEWS OF LRR TIRES ........................................................................ 44
TABLE 31: SUMMARY OF PERCEIVED CUSTOMER VIEWS OF WIDE BASE TIRES............................................................... 45
TABLE 32: CURRENT AND EXPECTED FUTURE TIRE SALES, BY TYPE .............................................................................. 45
TABLE 33: SALES OF TRAILERS BY SURVEY RESPONDENTS .......................................................................................... 49
TABLE 34: SUMMARY OF TIRE SHARE INFORMATION, BY TIRE TYPE ............................................................................ 50
TABLE 35: SIMULATION RESULTS......................................................................................................................... E-3
iiiCHEMINFO
List of Figures
FIGURE 1: CANADA’S GREENHOUSE GAS EMISSIONS, BY SECTOR (2015) ....................................................................... 5
FIGURE 2: GREENHOUSE GAS EMISSIONS FROM CANADA’S TRANSPORTATION SECTOR (2015) .......................................... 6
FIGURE 3: GREENHOUSE GAS EMISSIONS FROM HEAVY-DUTY VEHICLES IN CANADA (2000 TO 2015) ................................ 7
FIGURE 4: CURRENT UPTAKE OF FUEL SAVING MEASURES......................................................................................... 10
FIGURE 5: ADOPTION OF LOW ROLLING RESISTANCE TRUCK TIRES BY NORTH AMERICAN FLEETS ...................................... 15
FIGURE 6: ADOPTION OF LOW ROLLING RESISTANCE TRAILER TIRES BY NORTH AMERICAN FLEETS .................................... 16
FIGURE 7: NUMBER OF UNITS OWNED BY FOR-HIRE FLEETS ...................................................................................... 20
FIGURE 8: NUMBER OF UNITS OWNED BY PRIVATE FLEETS ........................................................................................ 21
FIGURE 9: NUMBER OF UNITS OWNED BY RENTAL FLEETS ......................................................................................... 22
FIGURE 10: CLASS 8 RETAIL SALES IN CANADA (2006-2016) ................................................................................... 36
FIGURE 11: 2014 HEAVY-DUTY TRUCK TRAILER SALES, BY TYPE ................................................................................ 40
ivCHEMINFO
1. Executive Summary
1.1 Introduction
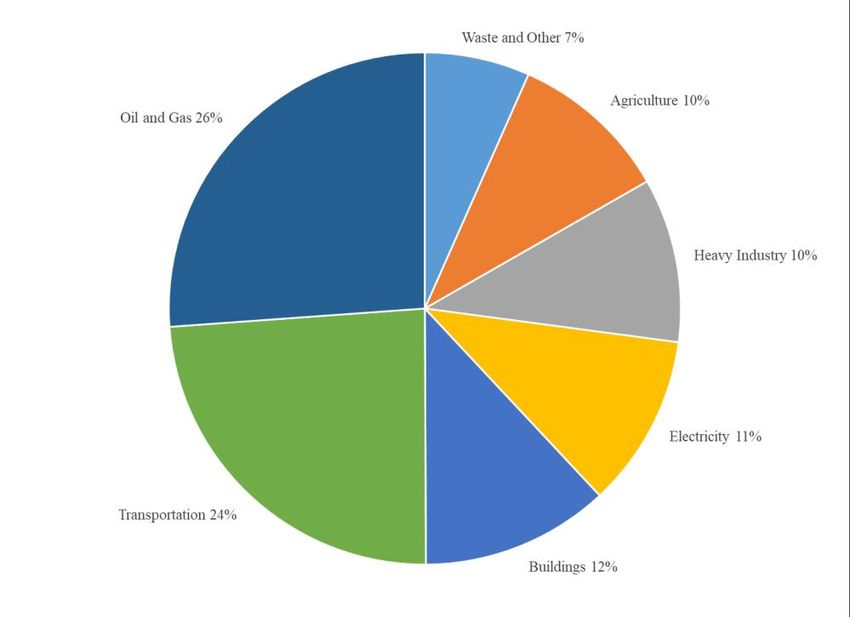
In 2015, Canada’s total greenhouse gas (GHG) emissions were 722 million metric tonnes
on a carbon dioxide equivalent (CO2 eq.) basis. Approximately 24% of these emissions
were from the transportation sector, including 62.5 million tonnes from heavy-duty
gasoline and diesel powered vehicles.
Given their contribution to total Canadian GHG emissions, and their growth over time, the
Government of Canada has proposed Regulations Amending the Heavy-duty Vehicle and
Engine Greenhouse Gas Emission Regulations and Other Regulations Made Under the
Canadian Environmental Protection Act, 1999 to further manage GHG emissions from
heavy-duty vehicles and engines. The proposed Regulations
One option for improving fuel economy and reducing GHG emissions for heavy-duty
trucks and trailers is the use of low rolling resistance tires. The objective of this study is to
collect information from the Canadian trucking industry (including Class 7 and 8 vehicles
and the trailers they pull) to provide a perspective on the rate of uptake of low rolling
resistance tires in Canada.
1.2 The Heavy-Duty Vehicle and Engine Greenhouse Gas
Emission Regulations
The Heavy-Duty Vehicle and Engine Greenhouse Gas Emission Regulations (the
Regulations) were published in the Canada Gazette, Part II, on March 13, 2013. These
regulations are now described as “Phase I” of the Regulations. The Phase I Regulations
applied to various vehicle classes, including tractors defined as Class 7 or Class 8 heavy-
duty vehicles manufactured primarily for pulling a trailer, but not for carrying cargo other
than the cargo in the trailer. The Phase I Regulations had requirements for manufacturers,
importers, and distributors, including CO2 emission standards.
Environment and Climate Change Canada proposed amendments to further reduce
greenhouse gas emissions from on-road heavy-duty vehicles and their engines for post-
2018 model years in the Canada Gazette, Part I, on March 4, 2017. The proposed
amendments would introduce more stringent GHG emission standards that begin with the
2021 model year for on-road heavy-duty vehicles and engines. Starting with the 2021
model year, the proposal introduces new CO2 emission standards for “heavy line-haul
tractors” and “heavy-haul tractors”. In addition, starting with the 2018 model year, CO2
emission standards are proposed for trailers that become progressively more stringent up
to the 2027 model year.
1CHEMINFO
1.3 Fuel Economy Options and Low Rolling Resistance Tires
The rolling resistance of a tire is defined as the force needed to keep the tire rolling at a
constant speed on a level surface and is usually expressed in the form of a rolling resistance
coefficient (CRR). Two types of low rolling resistance tires are now relatively widely used
by fleets, namely low rolling resistance conventional tires and low rolling resistance wide
base single tires. Various design modifications to tread design, tread depth, sidewalls,
rubber compounds, and other tire components can contribute to achieving lower rolling
resistance and improved fuel economy. These changes can also affect other aspects of the
tire’s characteristics such as traction in rain or on snow or ice, tread life, and cost.
The U.S. Environmental Protection Agency’s (EPA’s) Smartway Verified List identifies
close to 200 tire brands and over 750 low rolling resistance tire models. These tires are
those that reduce fuel consumption by 3% or more relative to the best-selling new tires for
line haul Class 8 tractor-trailers. Some empirical evidence from the U.S. suggests that:
a very high proportion of tires on sales of new trucks and tractors are low rolling
resistance duals or wide base singles; and
over 75% of fleets have some low rolling resistance tires, and nearly 50% have some
wide base singles.1
1.4 Canadian Fleets
Information was collected from a survey of fifty-four Canadian fleets with Class 7 and 8
tractors. The survey respondents included 42 for-hire fleets, 8 private fleets, and 4 rental
fleets. Fleets with head offices in every Canadian province were surveyed. In total, the
survey covered nearly 13,000 tractors and 35,000 trailers (an average of over 800 units per
fleet). Given an estimate of 402,000 heavy-duty trucks in Canada, the study sample
represents about 3.2% of the Canadian inventory of heavy-duty trucks.
The sampled fleets traveled 1,740 million vehicle kilometres in 2016, with over 80% by
for-hire fleets. In total, the 12,795 tractors had 115,114 tires and the 34,799 trailers had
306,912 tires. As a core finding from the study, the 422,026 tires were comprised of:
41% conventional (non-LRR) tires;
49% low rolling resistance dual tires; and
10% wide base single tires.
There were variations in the uptake of low rolling resistance tires by fleet type, with for-
hire fleets having the highest use of fuel saving tires.
1
References to materials in the Executive Summary are found in later sections of this report.
2CHEMINFO
1.5 Tire Manufacturers
Efforts were made to understand the 2016 national market for heavy-duty tires, and the
shares of those that were low rolling resistance dual tires and wide base single tires, through
consultations with tire manufacturers.
Seven North American tire manufacturers with sales in Canada completed surveys on their
tire businesses. These businesses had sales of approximately 1 million tires in Canada in
2016, representing about 40% of the market estimate of 2.5 million tires. As a second key
finding of the study, these tires were comprised of:
58% conventional (non-LRR) tires;
40% low rolling resistance dual tires; and
2% wide base single tires.
The tire manufacturers anticipated that there would be virtually no change in the shares by
tire type in 2020.
1.6 Heavy-duty Truck Manufacturers
Two of the four North American heavy-duty truck manufacturers provided information on
their sales of trucks and tires. The Canadian sales of those two manufacturers represented
approximately 40% of the estimated market for Class 8 trucks in Canada in 2016. Based
on reported sales, Class 7 trucks represented much less than 1% of the heavy-duty market.
The companies provided information on the types of tires found on their 2016 sales of
heavy-duty trucks, with:
31% being conventional (non-LRR) tires;
63% being low rolling resistance dual tires; and
6% being wide base single tires.
1.7 Heavy-duty Truck Trailer Manufacturers
Fourteen major North American trailer manufacturers were approached with questions
about their sales of tires on trailers, and ultimately eight responded with information. These
eight companies reported selling approximately 15,000 trailers in 2016, which is expected
to represent about 45% of the annual market for trailers in Canada.
3CHEMINFO
The companies provided information on the types of tires found on their trailers sold into
Canada in 2016, with:
28% being conventional (non-LRR) tires;
66% being low rolling resistance dual tires; and
6% being wide base single tires.
While these shares are very similar to those reported by tractor manufacturers, there was
diversity in terms of the responses from individual trailer manufacturers.
1.8 Key Findings and Conclusions
The rates of tire uptake found among fleets, tire manufacturers, tractor manufacturers, and
trailer manufacturers are summarized in Table 1.
Table 1: Summary of Tire Share Information, By Tire Type
Canadian Tire Truck Trailer
Tire Type
Fleets Mfrs. Mfrs. Mfrs.
Non-LRR Conventional 41% 58% 31% 28%
LRR Conventional 49% 40% 63% 66%
Wide Base Single 10% 2% 6% 6%
Total 100% 100% 100% 100%
On the basis of this evidence, it is expected that the shares of tire types on Canadian fleets
are:
45% non-LRR conventional tires;
50% low rolling resistance conventional tires; and
5% wide base single tires.
This conclusion weighs the inputs from the Canadian fleet relatively highly (but considers
the possibility of an unrepresentative sample, particularly in terms of wide base single
tires). It also reflects the fact that the inputs from the three manufacturing groups represent
the sales for a single year (2016) while the fleet estimates represent a sampling of the fleet
across various model years.
Several perceptions of fleet managers have deterred the uptake of low rolling resistance
tires. For low rolling resistance dual tires, these predominantly include concerns over
winter traction, off-highway traction, and an uncertain return in terms of fuel savings versus
costs. Fleets were also concerned with the weight limits that exist in some provinces for
wide base single tires and their availability particularly as replacements.
4CHEMINFO
2. Introduction
2.1 Context
In 2015, Canada’s total greenhouse gas (GHG) emissions were 722 million tonnes on a
carbon dioxide equivalent (CO2 eq.) basis.2 Figure 1 shows that 24% of these emissions
were from the transportation sector.
Figure 1: Canada’s Greenhouse Gas Emissions, by Sector (2015)
(Total of 722 M Tonnes, CO2 eq.)
Source: Environment and Climate Change Canada (2017), National Inventory Report 1990-2015:
Greenhouse Gas Sources and Sinks in Canada, Part 1, Table 2-12.
Figure 2 shows that almost half of the emissions within the transportation sector were from
light-duty vehicles, including gasoline and diesel powered cars and trucks, motorcycles,
and propane and natural gas powered vehicles. The second largest source of transportation
emissions was heavy-duty gasoline and diesel powered vehicles, accounting for over one-
third of emissions. Domestic aviation, rail, marine, and pipelines together account for the
remaining transportation emissions.
2
Environment and Climate Change Canada (2017), National Inventory Report 1990-2015: Greenhouse Gas
Sources and Sinks in Canada, Part 1, Table 2-12.
5CHEMINFO
Figure 2: Greenhouse Gas Emissions from Canada’s
Transportation Sector (2015)
(Total of 171.2 M Tonnes, CO2 eq.)
Source: Environment and Climate Change Canada (2017), National Inventory Report 1990-2015:
Greenhouse Gas Sources and Sinks in Canada, Part 3, Table A9-2.
Note: Some differences exist between Canadian economic sectors and Intergovernmental Panel on Climate
Change (IPCC) sectors. The information in the table above excludes categories of off-road transportation.
The 2015 emissions from heavy-duty gasoline and diesel powered vehicles totalled 62.5
million tonnes (see Figure 3). About 75% of these emissions are from heavy-duty diesel
vehicles, and 25% from heavy-duty gasoline vehicles. Notably, releases of greenhouse
gases from heavy-duty on-road fleets have been increasing over time, with a compound
annual growth rate of over 3.5% between 2000 and 2015.
6CHEMINFO
Figure 3: Greenhouse Gas Emissions from Heavy-duty Vehicles
in Canada (2000 to 2015)
(Million Tonnes, CO2 eq.)
Source: Environment and Climate Change Canada (various years), National Inventory Report.
Due to their significant contribution to total Canadian GHG emissions, and their growth
over time, there has been a need to regulate GHG emissions from heavy-duty vehicle. In
2013, Environment and Climate Change Canada (ECCC), implemented the Heavy-duty
Vehicle and Engine Greenhouse Gas Emission Regulations which established mandatory
GHG emission standards for new on-road heavy-duty vehicles and engines. The
Regulations applied to companies manufacturing and importing new on-road heavy-duty
vehicles and engines of the 2014 and later model years for the purpose of sale in Canada.
A Notice of Intent was published in the Canada Gazette, Part I on October 4, 2014, to
signal the government’s intent to develop a second phase of heavy-duty vehicle and engine
greenhouse gas emission regulations. The proposed Regulations Amending the Heavy-duty
Vehicle and Engine Greenhouse Gas Emission Regulations and Other Regulations Made
Under the Canadian Environmental Protection Act, 1999 was published in the Canada
Gazette, Part I, on March 4, 2017.
7CHEMINFO
The proposed Regulations would introduce more stringent GHG emission standards that
begin with the 2021 model year for on-road heavy-duty vehicles and engines. Further, the
proposed Amendments introduce new GHG emission standards that would apply to trailers
hauled by on-road transport tractors for which the manufacture is completed on or after
January 1, 2018, starting with model year 2018 trailers. These emission standards for
heavy-duty vehicles, engines and trailers would increase in stringency every three model
years to the 2027 model year and maintain full stringency thereafter.
2.2 Objectives
Low rolling resistance tires are one option for achieving compliance with the proposed
Regulations. As a result, the objective of this study was to collect and analyze data from
the trucking industry in Canada, with a focus on Class 7 and Class 8 vehicles and
the trailers they pull, in order to estimate the availability and adoption rates of low
rolling resistance tires in the Canadian market.
2.3 Methodology
This study was conducted primarily through:
a literature review investigating low rolling resistance tires and their uptake;
the distribution of electronic questionnaires to Canadian for-hire, private, and rental
fleets (see Appendices A through D);
the distribution of electronic questionnaires to North American tire manufacturing,
tractor manufacturing, and trailer manufacturing companies;
the further collection of information on tires and tire preferences through telephone
consultations with Canadian fleets; and
analysis of data collected through the questionnaires.
In total, 54 fleets provided information for this study, along with 7 tire manufacturers, 2
tractor manufacturers, and 8 trailer manufacturers. Both the Canadian Trucking Alliance
(CTA) and Private Motor Truck Council of Canada (PMTCC) assisted in the collection of
information from their respective members.
8CHEMINFO
2.4 Structure of this Report
The remainder of this report proceeds as follows:
Section 3 provides an overview of fuel economy options employed by heavy-duty
trucks and the trailers they pull, including low rolling resistance tires;
Section 4 summarizes information from a sampling of Canadian fleets focused on their
tire choices;
Section 5 provides information from North American tire manufacturers and the tires
they sell;
Section 6 includes information from North American heavy-duty truck manufacturers
and the tires on those trucks;
Section 7 presents information from North American heavy-duty truck trailer
manufacturers and the tires on those trailers; and
Section 8 reviews key findings and offers conclusions.
9CHEMINFO
3. Fuel Economy Options and Low Rolling
Resistance Tires
3.1 Fuel Economy Technologies and Measures
A 2016 survey from the U.S. provides information on market attitudes towards fuel saving
technologies.3 The survey was conducted from June 2016 through August 2016. The 96
fleets surveyed operate a combined total of just over 114,500 truck-tractors and
approximately 350,000 trailers, hauling a total of 9 billion tons of freight across 1.8 billion
miles annually. A summary of the uptake of various fuel saving measures is provided in
Figure 4. The study suggests that 76% of fleets are currently using LRR dual tires and 45%
are using wide base single tires. These results show the percentage of fleets currently using
LRR tires, not the percentage of LRR tires on those fleets.
Figure 4: Current Uptake of Fuel Saving Measures
Source: Data from Schoettle, B., M. Sivak, and M. Tunnell (2016), A Survey of Fuel Economy and
Fuel Usage by Heavy-Duty Truck Fleets, Table 7.
3
Schoettle, B., M. Sivak, and M. Tunnell (2016), A Survey of Fuel Economy and Fuel Usage by Heavy-Duty
Truck Fleets.
10CHEMINFO
3.2 Low rolling Resistance Tires
The rolling resistance of a tire is defined as the force needed to keep the tire rolling at a
constant speed on a level surface and is usually expressed in the form of a rolling resistance
coefficient (CRR). Tires are made of flexible materials, and as they move underneath the
weight of the truck they deform against the ground. Overcoming that deformation and
keeping a tire rolling forward requires energy and therefore fuel. Design features
incorporated within certain tires mitigate the impacts of this deformation and therefore
contribute to the LRR of that tire.
Historically, cost and tread life were the top considerations when specifying tires. Fuel
efficiency was not a large concern when diesel was relatively inexpensive. Nevertheless,
fuel-efficient tires with LRR appeared on the market in the early 1980s, known then as
low-profile tires. Characterized by a lower aspect ratio (aspect ratio is the ratio of tire
section height to tire section width) and shallower tread, they reportedly resulted in a 3-4%
increase in fuel efficiency. However, they were also approximately 15% more expensive
and the tread life was about 30% less than a non-LRR dual tire. At that time, due to the
inexpensive price of fuel, the extra cost of the tire combined with the reduced tread life was
difficult to make up in fuel savings. Consequently, sales of LRR tires when they were first
introduced were sparse.
However, high fuel prices and greenhouse gas regulations in Canada and the United States
have renewed interest in LRR tires. Two types of low rolling resistance tires are now
relatively widely used by fleets:
low rolling resistance dual tires; and
low rolling resistance wide base single tires.
3.2.1 Dual Tire Design Modifications Leading to Low Rolling Resistance
Every component of a tire has a role to play in determining rolling resistance, traction, and
tire life, and every component of a tire can be manipulated in some way to affect these and
other characteristics. In terms of rolling resistance, the tread normally contributes about
40% to a tire’s rolling resistance, the sidewalls and belts another 40% and the bead area
about 20%.
11CHEMINFO
Design modifications to these tire components that contribute to lower rolling resistance are
as follows:
Tread Design - the current trend in LRR tires is moving toward closed shoulder with a
tighter tread pattern. Manufacturers are now building tires with tightly packed lugs.
When tread lugs are packed tightly together, they support one another and squirming
is minimized. This lowers rolling resistance with minimal traction reduction.
Tread Depth - treads are typically shallower on LRR tires in order to minimize tread
movement at the contact patch. There has been a belief that shallower tread provides
less traction and will run fewer miles to removal, simply because there is less rubber
on the tread to begin with. However, tread compounds and manufacturing processes
developed by the leading tire manufacturers have improved over the years, enabling
engineers to specify stiffer, more resilient rubber for the tread faces that is capable of
running more miles with minimal impact to traction.
Sidewalls - manufacturers can lower the rolling resistance of a tire by making the
sidewall stiffer, as it will consume less energy if it flexes less. This is only possible
up to a point however, as making a sidewall stiffer also means sacrificing some of its
ability to withstand impact.
Rubber Compounds - different materials are mixed and blended to produce the rubber
used not just in the tread, but also the under-tread, the sidewalls, the bead, and the
interior of the tire. Engineers are designing rubber compounds to suit each application,
and for LRR tires they are striving for less elasticity overall so that less energy is
consumed in the process of deforming and then returning to their original shape.
3.2.2 Wide Base Single Tires Leading to Low Rolling Resistance
A second option available in the low rolling resistance tire category is wide base single
tires. Wide base tires are tires designed to replace two dual tires with one tire on drive or
trailer axles for over-the-road applications. Michelin introduced the first wide base tire
to the North American market in the year 2000. Though popular in Europe from some
years prior, they were slow to gain acceptance in North America.
The design has some advantages over dual tires in reducing rolling resistance since two
sidewalls are eliminated and the size of the overall contact patch is reduced. Depending
on the make and model, many of the tread patterns and tread depths found on dual tires
(outlined directly above) are also available on wide base tires, with some tread patterns
unique to the wide base singles.
12CHEMINFO
3.2.3 Potential Advantages and Disadvantages of LRR Tires
The primary benefit of LRR tires is lower fuel use and corresponding reduced fuel costs
and greenhouse gas and other emissions. Savings will depend on unitary fuel costs, the
extent of annual travel, and the life of the tire. In addition, the savings will be depend on
the fuel saving impacts of moving from one tire to another, a function of the rolling
resistance of the two tires. Moreover, any savings and return to investment must be
considered in the light of other costs, such as those arising from changes in purchase price,
maintenance costs, air pressure optimization costs, logistics effects, etc. As a result, fleets
face complex decisions in terms understanding the full financial impacts of their tire
choices.
A simple model was developed to show the relationships between the uptakes of various
types of tires, their fuel economy, and corresponding fuel use and CO2 emissions. A
summary of this model and its results are presented in Appendix E to this study. For
example, the model suggests that a 0.3 megatonne reduction in CO2 emissions may be
achievable by increasing the uptake of low rolling resistance tires from 50% to 70% (offset
by a corresponding reduction in use of conventional tires). This represents a reduction of
about 0.8% relative to estimated CO2 emissions from heavy-duty trucks (40 megatonnes).
One of the primary perceived disadvantages of LRR tires is irregular/premature tread wear
and consequently more frequent tire replacements. Nearly every tire manufacturer has
achieved a degree of its rolling resistance reductions by sacrificing tread depth, which has
negative effects on tire life and perhaps traction. One of the primary characteristics of LRR
tires is a thinner tread. Because there are simply fewer inches of rubber on the tread face,
it is logical to assume the tire will run fewer miles overall before the tread reaches the
removal point. Early versions of LRR tires certainly suffered from shorter than desired
tread life. More recently, advances in tire design and manufacturing, as well as tread
compounding have succeeded in extending tire life. Some tire manufacturers have
indicated that tread life now meets or even exceeds that of its non-LRR tires.
A second perceived drawback of low rolling resistance tires comes in terms of reduced
traction in snow. Because there have been concerns and limited data available to assess this
issue, Transport Canada asked the National Research Council (NRC) to undertake a
preliminary study of LRR tire traction for Class 8 long-haul vehicles based on a cross-
section of commercially available LRR tires in Canada.4 Based on the testing performed,
it was found that, on average, tires marketed as low rolling resistance had 29% lower rolling
resistance than their conventional counterparts. In addition, laboratory and vehicle-based
track testing of LRR tires demonstrated comparable levels of snow traction to non-LRR
tires. That said, concerns remain over the winter performance of at least some LRR times,
and their performance in some applications.
4
National Research Council (2012), Packed Snow Performance of Low Rolling Resistance Class 8 Heavy
Truck Tires, Document #: ST-GV-TR-0002.
13CHEMINFO
Other advantages and disadvantages of low rolling resistance dual tires and wide base
single tires are considered later in this report from the perspectives of Canadian fleets,
and North American tire, truck, and trailer manufacturers.
3.2.4 The SmartWay Program and SmartWay Verified Tires
In 2004, fifteen companies and freight sector associations worked with the U.S.
Environmental Protection Agency (EPA) to create the SmartWay program as a way of
using market-based incentives and technology solutions to address long-term trends,
changes and challenges in the freight transportation sector. One of the initiatives under the
SmartWay program is LRR tires. The program has been duplicated in Canada as Natural
Resources Canada’s SmartWay Transport Partnership.
Within the heavy-duty trucking industry, LRR tires are widely viewed as referring to tires
on the SmartWay verified tire list. For a tire to qualify for the SmartWay list, it must meet
a rolling resistance threshold for each type of tire. According to SmartWay, the threshold
is set at a level that reduces fuel consumption by 3% or more relative to the best-selling
new tires for line haul Class 8 tractor-trailers. However a limitation of the SmartWay list
is that it creates only one threshold for distinguishing between LRR and non-LRR tires,
that of a decrease in rolling resistance that reduces fuel consumption by 3% or more relative
to the comparable best-selling new tires for line-haul Class 8 tractor-trailers.
A consequence of the SmartWay list is that it only incentivizes tire manufacturers to reduce
rolling resistance to meet the threshold, but not any further than that. In fact, there is a
significant range of rolling resistance co-efficients among the tires on the SmartWay list,
and some are now much lower than others. As a result, it has been suggested that fleets
should begin to investigate their rolling resistance options in greater detail than simply
asking whether their tires are SmartWay verified. Though that list is a great starting point
for addressing rolling resistance, tire manufacturers are now offering tires with
substantially lower resistance than the SmartWay threshold. Those super LRR tires will
allow fleets to save even more on fuel costs (and to achieve even greater reductions in GHG
and other air pollutant emissions). However since tire manufacturers do not publically
share the LRR coefficients of their tires, it can be difficult for fleets to fully assess their
options.
3.2.5 Adoption Rate for LRR Tires Among North American Truck Fleets
One measure of the trend in increasing penetration rates for LRR tires is in the size of the
U.S. EPA’s SmartWay verified tire list. The verified tire list was launched as part of the
technology program in 2004 with the aim to accelerate adoption of fuel-saving
technologies. However by 2010, only eight tire brands were listed. But in the last 5 years
the list has grown dramatically, and today the list contains close to 200 tire brands and
over 750 tires.
14CHEMINFO
Adoption rates for LRR tires among Class 8 trucking fleets in North America has been
undertaken by the North American Council for Freight Efficiency (NACFE). Based on the
work of NACFE, there is a clear trend in North America among on-highway truck fleets
toward LRR tires. The two figures below show the results of NACFE’s most recent
Annual Fleet Fuel Study which finds that fleets have been moving toward LRR tires, both
duals and wide base singles. The majority of the fleets surveyed were in the U.S., however
some Canadian fleets are included in these data. This increasing LRR tire adoption rate is
true for both tractor tires and trailer tires.
Uptake of LRR duals and wide base singles has grown considerably over the past decade.
For example, the information in Figure 5 is drawn from NACFE’s Annual Fleet Fuel Study
and shows that the uptake of conventional tires has fallen dramatically on tractors since
2003. A similar pattern is shown for trailer tires in Figure 6.
Figure 5: Adoption of Low Rolling Resistance Truck Tires by
North American Fleets
Source: NACFE (2016), Annual Fleet Fuel Study, data drawn from Appendix A.
15CHEMINFO
Figure 6: Adoption of Low Rolling Resistance Trailer Tires by
North American Fleets
Source: NACFE (2016), Annual Fleet Fuel Study, data drawn from Appendix A.
The technology adoption rates in the Annual Fleet Fuel Study is for the North American
fleets (17 fleets were surveyed in 2015) that participate in the NACFE study. In total, these
fleets operate 62,000 tractors and 217,000 trailers and are considered to be more
progressive in their adoption of fuel-saving technology than the industry as a whole. The
purpose of the survey is to track changes in purchasing behavior as it relates to various fuel
saving technologies. Fleets are asked to complete the survey based solely on their
purchases for the prior year. Therefore, if a fleet only purchased equipment with LRR
conventional tires in the prior year, they would state 100% LRR conventional tire adoption
even if their inventory includes older tractors that may be equipped with non-LRR tires.
The individual responses are then weighted based on total miles travelled by the entire
fleet, to provide a view of how quickly technology use is changing in the survey group.
16CHEMINFO
In addition to the NACFE estimates, A Survey of Fuel Economy and Fuel Usage by Heavy-
Duty Truck Fleets suggests that over three-quarters of fleets (76%) are currently using low
rolling resistance dual tires on at least some of their units (see Table 2). In contrast, less
than half of the fleets were currently using wide base singles (45%), and a large share
(40%) indicated they would “never” use wide base tires. The study is based on U.S. fleets,
though some of these move goods in Canada and/or Mexico. For clarity, the statistics do
not indicate that, for example, 76% of tires on surveyed fleets are currently low rolling
resistance duals. Rather, they indicate that 76% of fleets are currently using the low rolling
resistance duals on some of their fleet vehicles. As such, the information is not immediately
comparable with Canadian data presented later in this report.
Table 2: Truck-Based Fuel-Saving Technologies and Strategies,
by Fleet Size
Considering Considering
Currently Would Never
Technology Fleet Size Using in the Using in 2 or
Using Use
Next Year More Years
1-20 60% 0% 20% 20%
Low Rolling 21-100 73% 0% 9% 18%
Resistance 101-500 83% 4% 13% 0%
Dual Tires 501 or more 85% 8% 0% 8%
All fleets 76% 3% 10% 11%
1-20 38% 10% 14% 38%
Low Rolling
21-100 38% 0% 5% 57%
Resistance
101-500 48% 4% 8% 40%
Wide Base
501 or more 54% 11% 7% 29%
Tires
All fleets 45% 6% 8% 40%
Source: Schoettle, B., M. Sivak, and M. Tunnell (2016), A Survey of Fuel Economy and Fuel Usage by
Heavy-Duty Truck Fleets, Table 7.
17CHEMINFO
4. Canadian Fleets
4.1 Introduction
This section provides information on Canadian for-hire, private, and rental fleets of Class
7 and Class 8 trucks and trailers. Information on fleet size, characteristics, and tire
preferences is provided based on a sampling of 54 fleets. The surveyed fleets include
companies headquartered in all ten provinces of Canada, and cover over 10,000 tractors
that pulled over 30,000 trailers more than 1.7 billion vehicle-kilometres in 2016. The main
finding is that the 420,000 tires on the tractors and trailers are comprised of 40%
conventional tires, 50% low rolling resistance tires, and 10% wide base single tires.
4.2 Methodology
Fleets were identified and contacted to participate in the study through three channels.
Canadian Trucking Alliance - The Canadian Trucking Alliance made numerous
requests to its membership to participate in the study. This included broad e-mail
distributions to members, discussions with provincial associations, and requests
directly to individual members. Fleets that identified themselves as being interested in
participating were contacted by telephone and e-mailed an electronic survey instrument
(see Appendix A). Several rounds of follow-up calls were made to companies for
clarifications and to request a completed questionnaire. This channel resulted in
approximately 50% of the responses received during the study.
Private Motor Truck Council of Canada - The Private Motor Truck Council of Canada
distributed several e-mail communications to its membership asking for participation
in the survey process. In addition, all Council members were contacted multiple times
by telephone. Private fleets indicating they would participate through the Council e-
mails or consultant telephone calls were e-mailed an electronic survey instrument (see
Appendix A). Several rounds of follow-up calls were made for clarifications and to
request completed questionnaires. This channel resulted in approximately 15% of the
responses received during the study.
Random Selection - Cheminfo Services Inc. randomly identified trucking fleets
across Canada based on a provincially-disaggregated Internet search. These
companies were contacted by telephone and asked to participate in the study through
a telephone consultation. The telephone consultation guide was an abbreviated
version of the full survey instrument sent to for-hire and private fleets. This channel
resulted in approximately 35% of the responses received during the study.
18CHEMINFO
4.3 Geographic Distribution of the Fleets
Efforts were made to understand the geographic distribution of the 54 fleets surveyed. In
terms of head office location, almost half of the companies surveyed had head office
locations in Ontario and Quebec (see Table 3). Fleets with head offices in every Canadian
province but not every territory were surveyed.
Table 3: Survey Sample Head Office Locations
Number of Share of Head Share of Cdn.
Region Fleets Office Locations Population
Atlantic Canada 11 20% 7%
Ontario and Quebec 25 46% 61%
Saskatchewan and Manitoba 6 11% 7%
British Columbia and Alberta 12 22% 25%
Territories 0 0%CHEMINFO
Information from the most recent (2009) Canadian Vehicle Survey indicates that there were
317,219 (in-scope) vehicles (Table 3-1) weighting 15 tonnes or more on provincial and
territorial registration lists. The Survey (Table 3-3) also reports that 202,890 of these were
tractor trailers, and 110,607 are straight trucks (with 3,022 other body types). More recent
information from Environment and Climate Change Canada suggests that there were
approximately 402,000 heavy-duty tractors in Canada in 2015.5 Information from Statistics
Canada indicates that there are about 463,000 vehicles weighing 15,000 kg or more in
Canada.6 Based on these estimates, the data collected as part of this study represent
approximately 3% of the national heavy-duty truck fleet.
4.4.1 For-Hire Fleets
Figure 7 shows the sizes of the 42 sampled for-hire fleets, with a total of almost 40,000
units (10,620 tractors and 29,337 trailers). The smallest for-hire fleet had fewer than ten
total units (Class 7 and Class 8 tractors, plus trailers) while the largest had over 5,000 units.
In total the five smallest for-hire fleets had approximately 100 units (about 0.2% of the
sample of 54 fleets). The largest five for-hire fleets had approximately 20,000 units (about
40% of the sample of 54 fleets). As such, the results of this study are heavily influenced by
a relatively small number of large for-hire fleets.
Figure 7: Number of Units Owned by For-Hire Fleets
(Fleets Arranged from Smallest to Largest)
5
E-mail from Environment and Climate Change Canada to Cheminfo Services Inc., July 2017.
6
Statistics Canada, Motor Vehicle Registrations, CANSIM Table 405-0004.
20CHEMINFO
4.4.2 Private Fleets
Figure 8 shows the sizes of the eight sampled private fleets, with a total of over 6,500 units
(1,826 tractors and 4,777 trailers). The smallest private fleet had fewer than one hundred
total units, while the largest had over 2,500 units. In total the eight private fleets comprised
about 15% of the units across the sample of 54 fleets.
Figure 8: Number of Units Owned by Private Fleets
(Fleets Arranged from Smallest to Largest)
4.4.3 Rental Fleets
Figure 9 shows the sizes of the four sampled rental fleets, with a total of about 1,000 units
(352 tractors and 685 trailers). The smallest private fleet had approximately ten units in
total, while the largest had over 500. In total the four private fleets comprise less than 2%
of the units across the sample of 54 fleets.
21CHEMINFO
Figure 9: Number of Units Owned by Rental Fleets
(Fleets Arranged from Smallest to Largest)
4.5 Total Travel
Forty-one of the fifty-four fleets surveyed provided information on total miles of travel (in
Canada) for 2016. Annual travel for eleven of the other fleets was estimated on the basis
of the number of power units owned and the average travel per tractor for the companies
that reported travel (one of the four rental companies provided travel data, and this
information was applied on a per-tractor basis for the other three rental fleets). Two of the
fleets were trailers-only, and did not have information on travel.
Total travel of the sampled fleets was estimated to be 1,740 million vehicle kilometres of
travel in Canada in 2016. This was comprised of:
1,539 million vkt by for-hire fleets;
148 million vkt by private fleets; and
53 million vkt by rental fleets.
22CHEMINFO
Not surprisingly, for-hire fleets accounted for the majority of travel (88%), and had the
most average travel per tractor by a considerable margin (almost 80% more travel than
private fleets at approximately 145,000 km compared to 85,000 km). This finding provides
an expectation that there may be a propensity by (some) for-hire fleets to prefer low rolling
resistance tires as they are better positioned to recoup investment costs through fuel savings
over a shorter period of time.
There were also significant differences in terms of the total travel by individual fleets (see
Table 5). Ten of the fleets surveyed travelled less than 2.5 million vehicle kilometres per
year. In contrast, four fleets had more than 100 million kilometres of travel.
Table 5: Distribution of Distance Travelled by Fleets
Travel (VKT) Number of Fleets
Less than 2.5 Million 10
2.5 - 5.0 Million 8
5.0 - 10.0 Million 7
10.0 - 20.0 Million 8
20.0 - 50.0 Million 8
50.0 - 100.0 Million 7
More than 100 Million 4
Total 52
Note: Two of the fleets are excluded from the information above as they
own trailers only.
4.6 Distribution of Fleet Travel
Fleets were also asked to provide information on their share of travel by region. Some fleets
did not provide this information, and some where not asked this information (i.e., those
surveyed by telephone). Some fleets did not know this information (in particular, the rental
fleets) and others did not track the share of travel in “northern” and “southern” areas.
Otherwise, “northern” and “southern” areas were subjectively established by the survey
respondents.
About two-thirds of the fleets provided regional travel information, with a national total of
over 1.4 billion vehicle kilometres of travel in Canada (Table 6). Not surprisingly, southern
areas of the provinces spanning Quebec through British Columbia saw the majority of
travel given the extent that populations are located in those areas.
23CHEMINFO
Table 6: Regional Shares of Fleet Travel (2016)
Region Million VKT Share
NL, NS, PE, NB 137 10%
Southern QC, ON, MB, SK, AB, BC 1,021 72%
Northern QC, ON, MB, SK, AB, BC 242 17%
NU, NT, YT 9 1%
Canadian Total 1,410 100%
Note: Information is provided only for the companies identifying regional shares of travel, which represents
1.41 billion km of the total travel of 1.74 billion km.
4.7 Fleet Tires
The 54 sampled fleets reported having 422,026 tires, as shown in Table 7. These included
115,114 tires on tractors and 306,912 tires on trailers. Almost 85% of tires were reported
on for-hire fleet vehicles.
Table 7: Numbers of Tires on Tractors and Trailers, By Type of
Fleet
Fleet Tractor Tires Trailer Tires Total
For-Hire 94,576 260,328 354,904
Private 17,018 40,092 57,110
Rental 3,520 6,492 10,012
Total 115,114 306,912 422,026
As the primary finding from this study, Table 8 describes the findings relating to uptake of
conventional dual tires, low rolling resistance tires, and wide base single tires. Across the
entire sample of 422,026 tires spanning 54 fleets:
41% were conventional dual tires;
49% were low rolling resistance dual tires; and
10% were wide base single tires.
As anticipated, the uptake of fuel saving tires (low rolling resistance duals or wide base
singles) was highest among for-hire fleets. It is notable that the data for rental fleets is
based on a very small sample of fleets.
24You can also read