Retail Redlining in New York City: Racialized Access to Day-to-Day Retail Resources
←
→
Page content transcription
If your browser does not render page correctly, please read the page content below
Journal of Urban Health: Bulletin of the New York Academy of Medicine
doi:10.1007/s11524-012-9725-3
* 2012 The New York Academy of Medicine

Retail Redlining in New York City: Racialized
Access to Day-to-Day Retail Resources

Naa Oyo A. Kwate, Ji Meng Loh, Kellee White,
and Nelson Saldana

   ABSTRACT Racial residential segregation is associated with health inequalities in the
   USA, and one of the primary mechanisms is through influencing features of the
   neighborhood physical environment. To better understand how Black residential
   segregation might contribute to health risk, we examined retail redlining; the
   inequitable distribution of retail resources across racially distinct areas. A combination
   of visual and analytic methods was used to investigate whether predominantly Black
   census block groups in New York City had poor access to retail stores important for
   health. After controlling for retail demand, median household income, population
   density, and subway ridership, percent Black was associated with longer travel distances
   to various retail industries. Our findings suggest that Black neighborhoods in New York
   City face retail redlining. Future research is needed to determine how retail redlining
   may perpetuate health disparities and socioeconomic disadvantage.

   KEYWORDS Segregation, African American/Black, Retail, Redlining, Neighborhoods,
   New York City

Racial residential segregation is thought to be the foundation on which Black–White
disparities in health status have been built.42 Three primary mechanisms through which
segregation operates include: (1) the concentration of poverty, (2) constrained access to
economic and educational opportunity structures, and (3) neighborhood social and
physical environments, including housing quality and the distribution of amenities and
retail resources.16,24,34,35,41,42 These pathways create economic, social, and physical
contexts that determine the likelihood of conditions that foster, support, or sustain health.
   One of the primary constituents of a healthy neighborhood is the provision of
public or private services that support people in their daily lives.21 Public or private
services include education, transportation, health care, and retail services. These
services, along with the reputation of an area, are important neighborhood features.
Reputation influences how areas are perceived by residents, service planners and
investors, and in turn, availability of services.21 Black segregated neighborhoods

Kwate and Saldana are with the Department of Human Ecology, School of Environmental and Biological
Sciences, Rutgers, The State University of New Jersey, New Brunswick, NJ, USA; Loh is with the AT&T
Labs-Research, Florham Park, NJ, USA; White is with the Department of Epidemiology and Biostatistics,
Arnold School of Public Health, University of South Carolina, Columbia, SC, USA; Saldana is now a
doctoral student at the Department of Sociology, University of Michigan, Ann Arbor, MI, USA.
   Correspondence: Naa Oyo A. Kwate, Department of Human Ecology, School of Environmental and
Biological Sciences, Rutgers, The State University of New Jersey, New Brunswick, NJ, USA. (E-mail:
nokwate@rci.rutgers.edu)
KWATE ET AL.

often face lacking or poor quality goods and services, and these deficits are often
characterized as a reflection of poor commercial viability or deficits in resident
consumerism. In other words, Black neighborhoods often have poor retail
reputations and have difficulty in attracting businesses and employment opportu-
nities. Research and commentary has demonstrated the health impact of the retail
environment in Black neighborhoods, both when needed resources (e.g., super-
markets) are scarce,27 and when health damaging products such as alcohol are
aggressively marketed.18
   In international settings, poverty has been associated with resources that are
deleterious to health opportunity,11,33 but this relationship is not consistent. For
example, evidence for food deserts in low income areas is equivocal in several
countries.5 In Scotland, deprivation was not always associated with fewer day-to-
day resources; nurseries, pharmacies, and credit unions were actually denser in
deprived areas.22 In the USA, the relationship between income and resource access
is also equivocal, but proportion Black is consistently negatively associated with
access to a variety of day-to-day resources that are directly and indirectly related to
health.

RETAIL REDLINING
Black neighborhoods are often characterized by the inequitable distribution (i.e.,
density and proximity) of amenities and retail resources important for health.20,40 In
one national study, proportion Black at the zip code level, but not neighborhood
poverty, was inversely associated with resources such as hardware stores,
pharmacies, savings banks and convenience stores.37 Across Baltimore, New York
City (NYC), and Winston-Salem, the spatial distribution of supermarkets, parks,
recreational facilities, and retail areas was racially patterned, with Black residents
having the lowest access. Additionally, within NYC (815 block groups in Upper
Manhattan), proportion Black was related to fewer supermarkets.38 In Atlanta,
predominantly Black census tracts had less access than income-matched predomi-
nantly White counterparts for a number of resources such as grocery stores, non-fast
food restaurants, small banks and movie theaters.15 In NYC, predominantly Black
zip codes (also true for low income zip codes) had smaller, less dense retail stores
than White zip codes, with lower diversity in food service, and no (0 %) upscale
chain groceries, compared with a value of 8 % in White zip codes.26 Because Black
zip codes had the same amount of retail space and more transit rail than White zip
codes, observed disparities were not driven solely by those cost-related factors26.
Disparities are especially acute for national retailers. Of the bottom 29 zip codes
across the five boroughs for the number of national retailers, 12 (41 %) were
predominantly Black.8 Finally, access to OTC syringes is racially patterned in NYC.
After accounting for the need for services, areas with low proportions of White
residents had fewer than half of such pharmacies than areas with high proportions
of White residents, and this disparity increased over time. Moreover, while racial
and ethnic composition accounted for 43 % of spatial variation in access, adding
poverty to the model had a negligible effect.10
   Why is the proportion of Black residents consistently inversely related to
resources important for promoting and maintain health? Small and McDermott37
contend that business operation is not based solely on customers’ pockets—political
and economic conditions such as government incentives and entrepreneurship grants
play a key role in where and how businesses operate. But if retailers systematically
RETAIL REDLINING IN NEW YORK CITY

avoid Black neighborhoods, and mark them as less desirable or tenable as consumer
markets, these areas are effectively being redlined for retail. Retail redlining12 refers
to spatial discrimination whereby retailers, particularly chain stores, fail to serve
neighborhoods or target them for unfavorable treatment based on the racial
composition of the customers and/or the store operators. From a health perspective,
retail redlining contributes to racialized risk environments. Cooper et al.10 articulate
a racialized risk environment as one in which health-related features occur in spatial
pockets of risk or protection based on the race and ethnicity neighborhood
populations.
   D’Rozario and Williams12 argue: “chain stores willingly cede profitable, inner-
city locations to independents while they saturate suburban, less-profitable locations
with their stores. This cannot be explained by any economic theory that we are
aware of” (p. 177). The authors note that retailers typically explain their absence by
citing stagnant or low populations, high crime rates and therefore high insurance
rates, low numbers of comparable retailers already in the area, insufficient
household incomes, and downscale tastes and preferences. Concerns about demand
(e.g., income and consumer preferences) are clearly a basic consideration for any
business. Retail markets depend on the supply of existing retail and the demand for
more.43 Evidence of retail redlining exists when resource disparities persist in the
absence of the negative consumer characteristics typically cited by retailers, or when
neighborhoods are disproportionately assigned negative attributes, such as being
low in consumer savvy and retail demand. In this paper, we empirically investigate
the presence of retail redlining in NYC among retailers that are potentially
important to health.

RETAIL DEMAND
Macintyre et al.21 contend that place-based needs for health rest on Maslow’s
hierarchy of human needs. Uppermost in the formulation are such needs as air,
water, food, shelter, security and hygiene; last is social, cultural and physical
recreation (play). Some of these broad human needs can be mapped onto retail
goods and services. For example, most people would find it desirable to have stores
in their neighborhood where needs for food (e.g., supermarkets), hygiene (e.g.,
Laundromats), and play (e.g., toy stores) can be met.
   Retailers are keenly aware of finely-measured demand for goods and services,
though they do not have perfect information about local tastes and buying power.15
Several metrics are available to measure retail demand; a common one is simply
household income. It is thought that at the most basic level, areas with high
household incomes should be better able to support retail. However, several have
criticized this reasoning, arguing that it does not take into account the latent
purchasing power of densely populated urban areas.9,43 One Pittsburgh study found
that using expenditures per square mile rather than household income revealed
greater purchasing power in an underinvested neighborhood than in an affluent
counterpart.9
   Retail demand is also assessed by calculating the market potential index (MPI),
which describes the expected number of consumers in a given area compared with
the US national average. The information used to derive the MPI index is usually
collected through market segmentation cluster analytic techniques. These methods
integrate information such as census data and purchasing and consumptive
behaviors to describe the lifestyle preferences, spending habits, and favorite brands
KWATE ET AL.
and products of neighborhood residents. Although the specific manner in which the
classifications are constructed is proprietary, the methodological approach is
similar7 and is offered by several companies, such as ESRI, Claritas, and Experian.
These systems enable businesses to capitalize on possible markets that might be
missed when solely relying upon census statistics, and can be useful in identifying
locations for new stores, selecting merchandise that matches consumer preferences,
and targeting advertising with the right message.13
ESRI’s14 retail demand is derived as:
n¼65
Expected number of consumers ¼ ðcountn consumption rateÞ ð1Þ
n¼1
where n is a count of community tapestry segments (descriptions of the lifestyle
preferences and spending habits of neighborhood residents) and the consumption
rate is for the unique segments that characterize a neighborhood;
Local consumption ¼ expected consumers = base count ð2Þ
MPI ¼ ðlocal consumption = US consumptionÞ 100 ð3Þ
In this formulation, 100 indicates the US national average; values above and
below 100 indicate retail demand that is higher, and lower than the national
average, respectively. Thus, a value of 85 would indicate that the retail demand was
15 % lower than the national average, and a value of 300 would indicate that the
retail demand was three times as high as the national average.
It is often argued that scarce retail in Black neighborhoods reflects low demand.
Thus, we used ESRI’s14 measure of demand to examine racialized access to a variety
of retail resources after controlling for key covariates. We hypothesized that after
controlling for socioeconomic and retail covariates, the proportion of Black
residents would be inversely associated with proximity to goods and services that
support health, and positively associated with proximity to goods that destabilize
health.
METHOD
Geography
We studied the 5,730 census block groups comprising NYC five boroughs:
Manhattan, Brooklyn, Queens, The Bronx, and Staten Island. In 2000, NYC had
8,008,278 residents, of whom 24.5 % were Black, 27 % Latino, 35 % White, and
9.8 % Asian or Pacific Islander, and the median household income was $38,909.28
By 2010, despite an increase in total population, there were declines among White
(33.3 %) and Black (22.8 %) residents.29 Although NYC is diverse in its racial/
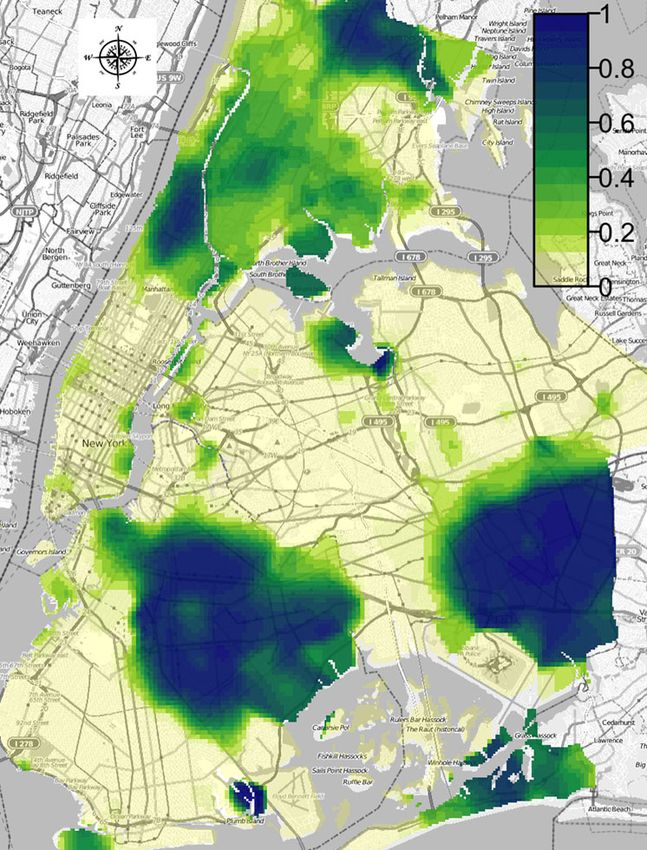
ethnic composition, it remains highly segregated (Figure 1).
Defining Retail Resources
As in other research22 we tried to operationalize retail resources that corresponded
to key human needs. Additionally, to address our research questions we required
stores with: (a) a strong retail presence in NYC, (b) a geographic scale that could be
expected to result in relatively high prevalence across the city (e.g., we would not
expect a large department store such as Saks Fifth Avenue in every census blockRETAIL REDLINING IN NEW YORK CITY FIGURE 1. Heat map of percent Black across the five boroughs of NYC. group), and (c) nationally available MPI data either for that particular brand or for the same category of stores. We focused on (multi)national and local NYC retail chains to meet these criteria. Wherever possible, we examined more than one retail chain for each need, in order to observe variability among brands and store types within the same category, as shown in Table 1. We extracted retail location from internet-based reference service ReferenceUSA, which contains data on businesses in North America. We searched the US Business/ Employers USA database using the custom search in February 2010. Retail chains
KWATE ET AL.

TABLE 1       Store sample by human need, retail category, and type of store chain

Need              Category                       Store chain                                Total stores (N)
Hygiene           Apparel                        Clothing store                                     72
                                                 Athletic shoe store                                58
                                                 Athletic shoe and sporting goods store             35
                                                 Shoe store (2)b                                   137
Healing           Pharmacies                     Pharmacy and household sundries no. 1              64
                                                 Pharmacy and household sundries no. 2             119
                                                 Pharmacy and household sundries no. 3             205
                  Health supplements             Vitamin supplements store no. 1                    34
                                                 Vitamin supplements store no. 2                    84
                  Nutritiona                     Fast food restaurant no. 1                         47
                                                 Fast food restaurant no. 2                         72
                                                 Fast food restaurant no. 3                         38
                                                 Fast food restaurant no. 4                         74
                                                 Fast food restaurant no. 5                        248
                                                 Fast food restaurant no. 6                         50
Information       Information and technology     Electronics goods and supplies                    118
                                                 Bookstore                                          17
                  Educational and professional   Office supply store                                 65
                    supplies
Play              Physical activity              Fitness club (3)b                                 109
                  Recreation                     Video game store                                   70
   a
       We used fast food to represent nutritional resources that are deleterious to health
   b
       Numbers in parentheses refer to the number of brands combined to represent stores in this category

were searched by name and the county that corresponds with each borough of NYC
(Manhattan=New York, Brooklyn=Kings, Bronx=Bronx, Queens=Queens, and
Staten Island=Richmond). Using county rather than borough names made for more
accurate retrieval of store locations, particularly for the borough of Queens, which
uses multiple names for mail delivery (e.g., Flushing, Jamaica). The results of the
query were downloaded in Excel format. Stores that were different divisions of the
same company were merged to represent one retail brand. All businesses (N=1,731)
were then plotted using the latitude/longitude XY-coordinates in the database.
   We purchased market potential data for the year 2008 from ESRI. For each of the
retail stores, we selected market potential variables that were exact or comparable
matches for the store name or retail type. As an example, if we were interested in
locations for Home Depot, we would search the ESRI database for MPI values for
Home Depot. If present, we used those data; if not, we used a proxy variable that
approximated the store category (e.g., hardware and building supplies). For all
stores, we used retail demand data for purchases in the last 3, 6, or 12 months (the
data varied for different retail categories).

Analytic Plan We used a combination of visual and analytic methods to study
retail redlining. Constructing maps of the city displaying MPI values and measures
of access together allowed us to visually detect spatial variations in MPI, retail
access, and relationships between the two that may not be easily modeled
statistically. Correlation coefficients were computed to identify possible dependence
and marginal relationships between variables of interest. To measure access, we
considered Euclidean, rather than network distances to the nearest store because we
were interested in the overall access to stores, rather than immediate walkable
RETAIL REDLINING IN NEW YORK CITY
proximity. And, as noted earlier, though we examined stores with relatively high
frequency throughout the city, we would not expect most people to be able or
inclined to walk to all of them. It is likely that shopping trips to these stores would
comprise a mix of walking, public transportation, or driving. Additionally,
variations in land use and automobile use in the boroughs made Euclidean distance
a more comparable measure across the city.
Besides percent Black from 2000 census data (PctBlk), we included as covariates
select population characteristics at the block group level that could be expected to be
associated with retail location. These included MPI values, because stores locate
where demand is high; population density (PopDens), because stores locate where a
dense consumer base is present; median household income (MHI), because stores
locate where consumers have incomes to support purchases at the outlet in question;
and average weekday subway ridership for the year 2000 (Subway), because store
locations near transit hubs are desirable.
We first employed generalized linear models (GLMs) to model access in terms of
the predictor variables. We did so separately for each type of store, using nearest
distance as the response variable.
Specifically, with nearest distance to block group i denoted by Yi, we have:
Y i N i ; 2
i ¼ a þ b 1 MPI þ b2 PopDens þ b 3 PctBlk þ b 4 MHI þ b 5 Subway
Where the observed nearest distance Yi is equal to μi plus normal error with
variance σ2, and where μi depends on the indicated covariates. The model is fit to
the data using the R statistical package, specifically the glm function, yielding
estimates for α and the β. These models are independent error models and do not
incorporate spatial information except through spatial correlations within the
predictor variables. When there is significant spatial correlation in the data, such
models can still provide accurate estimates of the coefficients but may be over
optimistic in terms of the uncertainty. We examined the residuals from the fitted
models for spatial correlations using variograms.
Next, we fit spatial GLMs to include spatially correlated errors (εi) to the right-
hand side of each linear equation. This was done using the geoRglm function in the
R package geoR. Smiley et al.38 investigated retail density with spatial lag models
and spatial error models. The former explicitly treats autocorrelation as a feature of
interest, wherein resource density is a function of neighboring area characteristics.
The latter treats autocorrelation as a confounder; this was our approach. Smiley et
al.38 found that in NYC, where autocorrelation was highest among the study cities,
including neighboring block group information did not strengthen observed
relationships. Additionally, spatial lag and error models produced similar findings.
Thus, we modeled autocorrelation with a spatial error approach. We expected the
direction of the relationship between the response and the predictors in the spatial
error model to be similar to the independent GLMs, but with perhaps reduced
significance.
We chose the exponential form for the correlation structure of the errors. In
general, parameters for the correlation structure consist of the nugget, variance and
range. We set the nugget, representing micro-scale variability, to be zero. The range
is estimated by fitting the exponential correlation model to the variograms of the
independent GLM residuals. We set an upper limit for the range to 5 km. TheKWATE ET AL.
variance parameter is estimated together with the coefficients of the predictors in the
spatial regression.
RESULTS
Descriptive Analyses
General Trends Figure 2 shows boxplots of distance in kilometers to nearest store
across all store categories. Several things are evident. First, the median distance
(black lines in each box) to nearest store was quite similar, at approximately 1 km or
12 city blocks or less for most store chains. Thus, residents in the middle 50 % of
block groups traveled a similar distance to the nearest store, regardless of type. The
stores with the shortest distances were fast food restaurant no. 5, pharmacy no. 3,
and the general shoes stores. These were the top 3 stores for number of locations,
comprising over a third of all the stores in our sample. A few stores had higher
median distances. The median distance to bookstores was about 3 km, and the
median for the clothing store was about 3.5 km.
Second, variability in distance to nearest (height of the boxes) was also quite
similar for most stores. The stores with the relatively high median distances showed
greater variability than most other stores (e.g., bookstores, vitamin/supplement store
no. 2, and clothing stores). Third, store chains within the same category (vitamin/
supplements, fast food, and pharmacy household sundries) were not consistent in
median distance or variability. As can be seen, the two vitamin stores and the two
Distances from block group to nearest store
15
10
5
0
Bookstore Vit SS #2 Video game FFR #2 FFR #4 FFR #6 Office supply P&HS #1 P&HS #3 Sporting goods
Vit SS #1 Fitness FFR #1 FFR #3 FFR #5 Electronics Clothing store P&HS #2 Ath. Shoe Reg. shoes
FIGURE 2. Boxplots of distance to nearest for all retail stores. Store abbreviations are: Vit SS=
Vitamin & Supplement store; FFR=Fast food restaurant; P&HS=Pharmacy & household supplies;
Ath shoe=Athletic shoes; Reg shoes=General shoe stores.RETAIL REDLINING IN NEW YORK CITY
shoe stores presented quite different profiles, fast food varied across the six chains,
and pharmacy no. 1 was more similar to office supplies than to the other
pharmacies.
Bivariate correlations (Table 2) show that predominantly Black areas faced
greater distances to retail outlets; percent Black was positively associated with
distance to nearest store for 65 % (13 out of 20) stores. Percent Black was also
inversely related to MPI for 40 % of stores, indicating that as the proportion of
Black residents increased, industry perceptions of retail demand declined. Of the 12
stores for which percent Black was positively associated with retail demand, six were
fast food restaurants.
Spatial Mapping: Retail Demand and Distance to Nearest Store Figures 3, 4, 5,
and 6 map represent each of the four human needs. In the interest of space, we show
only selected stores (clothing, one pharmacy, electronics stores, and fitness clubs). In
each map, shading indicates distance (kilometers) to nearest store, with darker
shading for higher distances. The contour lines in each map represent retail demand,
such that areas that with the same market potential index are connected by the same
contour lines. On these maps, MPI is smoothed so that we obtain values over a
continuous surface rather than only at block group centroids. As with an actual
landscape, the contour lines show the peaks and valleys in the market potential
index as well as the gradient (closely packed lines suggest a sharp increase/decrease
in market potential index). Each map has 16 contour levels from the minimum to
maximum of the smoothed market potential index.
Clothing stores (Figure 3), have low distances in most of Manhattan, and high
distances in Upper Manhattan, The Bronx, Central Brooklyn, North and
Southeastern Queens and the Rockaways. Most of these latter areas have high
TABLE 2 Bivariate correlations: percent black with retail demand and nearest distance
MPI Nearest distance
Clothing store −0.03 0.44
Athletic shoe store −0.21 0.08
Athletic shoes and sporting goods −0.21 0.09
Shoe stores −0.29 0.01
Pharmacy and household sundries no. 1 0.15 0.09
Pharmacy and household sundries no. 2 0.22 0.36
Pharmacy and household sundries no. 3 0.02 0.06
Vitamin supplements store no. 1 −0.22 0.28
Vitamin supplements store no. 2 0.14 0.46
Fast food restaurant no. 1 0.69 −0.42
Fast food restaurant no. 2 0.15 −0.25
Fast food restaurant no. 3 0.59 −0.20
Fast food restaurant no. 4 0.06 −0.04
Fast food restaurant no. 5 0.11 −0.02
Fast food restaurant no. 6 0.25 −0.04
Electronics goods and supplies 0.23 0.06
Bookstore −0.51 −0.08
Office supply store −0.23 0.36
Fitness club −0.44 0.17
Video game store 0.23 0.17KWATE ET AL. FIGURE 3. Heat and contour maps for MPI and distance to nearest store for clothing stores. percentages of Black and Latino residents. Tracing contour lines, however, shows that areas with quite different actual exposures to clothing stores in fact have similar retail demand. Electronics stores (Figure 4) are more widely dispersed across the city, as shown by the relatively uniform low shading of distance to nearest. Similarly, large swaths of the city share the same contours for retail demand, and there are fewer areas of closely packed lines. Fitness clubs (Figure 5) show more diverse patterning of distance to nearest. Some of the same areas that faced relatively high
RETAIL REDLINING IN NEW YORK CITY

FIGURE 4.   Heat and contour maps for MPI and distance to nearest store for electronics stores.

distances to clothing stores showed the same pattern for fitness clubs, but the
magnitude of distance is not as great (lighter shading). Retail demand for fitness
clubs is also defined more finely than clothing and electronics stores, as shown by
the dense tangles of contour lines throughout the city. Finally, the map for one
pharmacy and household supply store (Figure 6) shows that large areas of the city
have similar retail demand, but areas of Queens without large percentages of Black
KWATE ET AL.

FIGURE 5.   Heat and contour maps for MPI and distance to nearest store for fitness clubs.

residents have dense contour lines. The contours suggest that those areas are seen as
having fine distinctions in demand for pharmacies.
   Overall, Figures 3, 4, 5, and 6 suggest that areas with high concentrations of
Black residents (as per Figure 1) have longer distances to travel to a variety of stores.
Additionally, MPI contours suggest that stores are not equally distributed as a
function of retail demand. We employed regression models to investigate whether
areas with higher concentrations of Black residents have stores at greater distances
RETAIL REDLINING IN NEW YORK CITY

FIGURE 6.   Heat and contour maps for MPI and distance to nearest store for pharmacies.

even after accounting for area income, retail demand, and other population
characteristics thought to influence store locations.

Regression Analyses
We focus our discussion on the spatial, rather than the independent regressions. As
predicted, estimates in the spatial models (Table 3) were generally in the same
direction as those in the independent regression (not shown), but were reduced in
KWATE ET AL.

TABLE 3     Predictors of distance to nearest store

            Intercept     MN             MPI        PctBlk     PopDens      Income        Subway
Bookstores
Estimates      7.0700*     −0.0590*      −0.0001*   −0.0031     0.0000      −6.69E−08*     0.0000
SD             0.0380       0.0139       0.0000      0.0042     0.0000       0.0000        0.0000
p value        0.0000       0.0000       0.0151      0.4630     0.4680       0.0174        0.2310
Vitamin supplements store no. 1
Estimates      6.7000*     −0.2190*      −0.0001*    0.0128*   −6.20E−08*    0.0000       −1.44E−07*
SD             0.0330       0.0155       0.0000      0.0047     0.0000       0.0000        0.0000
p value        0.0000       0.0000       0.0013      0.0067     0.0000       0.0645        0.0005
Vitamin supplements store no. 2
Estimates      3.4900*     −0.5400*      −0.0001*    0.0645*   −1.33E−07*    0.0000       −2.73E−07*
SD             0.0196       0.0269       0.0000      0.0091     0.0000       0.0000        0.0000
p value        0.0000       0.0000       0.0012      0.0000     0.0000       0.4610        0.0007
Fast food restaurant no. 1
Estimates      4.8100*     −0.1160*      –          −0.0183*    0.0000       0.0000        0.0000
SD             0.0504       0.0184       0.0000      0.0057     0.0000       0.0000        0.0000
p value        0.0000       0.0000       0.0386      0.0014     0.0586       0.2100        0.2620
Fast food restaurant no. 2
Estimates      2.6100*     −0.2270*      −0.0001*   −0.0389*   −5.47E−08*    1.16E−07*    −1.04E−07*
SD             0.0150       0.0182       0.0000      0.0060     0.0000       0.0000        0.0000
p value        0.0000       0.0000       0.0000      0.0000     0.0023       0.0026        0.0480
Fast food restaurant no. 3
Estimates      3.9300*      0.0510*      0.0000     −0.0233*    0.0000       7.08E−08*     0.0000
SD             0.0270       0.0182       0.0000      0.0058     0.0000       0.0000        0.0000
p value        0.0000       0.0052       0.0790      0.0001     0.7250       0.0483        0.1550
Fast food restaurant no. 4
Estimates      3.8000*     −0.0997*      −0.0001*    0.0056     0.0000       0.0000       −2.17E−07*
SD             0.0534       0.0195       0.0000      0.0059     0.0000       0.0000        0.0000
p value        0.0000       0.0000       0.0376      0.3410     0.3910       0.3390        0.0000
Fast food restaurant no. 5
Estimates      1.9400*     −0.0799*      −0.0004*    0.0412*   −7.55E−08*    0.0000       −1.88E−07*
SD             0.0629       0.0230       0.0001      0.0070     0.0000       0.0000        0.0000
p value        0.0000       0.0005       0.0000      0.0000     0.0003       0.0648        0.0020
Fast food restaurant no. 6
Estimates      2.7700*     −0.1730*      –           0.0065    −4.62E−08*   −6.05E−08*     0.0000
SD             0.0134       0.0137       2.30E−05    0.0044     0.0000       0.0000        0.0000
p value        0.0000       0.0000       0.0481      0.1390     0.0004       0.0329        0.3240
Electronic goods and supplies
Estimates      2.6400*     −0.2120*      −0.0001*    0.0164*   −1.05E−07*    0.0000       −1.11E−07*
SD             0.0229       0.0181       0.0000      0.0057     0.0000       0.0000        0.0000
p value        0.0000       0.0000       0.0000      0.0041     0.0000       0.8500        0.0240
Office supply store
Estimates      3.2600*     −0.2830*      −0.0001*    0.0286*   −7.48E−08*    0.0000       −1.92E−07*
SD             0.0174       0.0193       0.0000      0.0062     0.0000       0.0000        0.0000
p value        0.0000       0.0000       0.0000      0.0000     0.0001       0.0975        0.0005
Clothing store
Estimates      4.8400*     −0.1730*      –           0.0150*   −3.89E−08*    0.0000       −8.46E−08*
SD             0.0238       0.0139       0.0000      0.0043     0.0000       0.0000        0.0000
p value        0.0000       0.0000       0.0042      0.0005     0.0023       0.7630        0.0235
General shoe store
Estimates      3.0400*     −0.1550*      −0.0001     0.0179*   −6.04E−08*    0.0000       −3.50E−07*
SD             0.0534       0.0195       0.0000      0.0059     0.0000       0.0000        0.0000
p value        0.0000       0.0000       0.0584      0.0025     0.0006       0.6930        0.0000
Athletic shoe and sporting goods store
Estimates      2.8000*     −0.2690*      −0.0001*    0.0222*   −8.36E−08*    0.0000*       0.0000
SD             0.0136       0.0151       0.0000      0.0049     0.0000       0.0000        0.0000
p value        0.0000       0.0000       0.0169      0.0000     0.0000       0.0316        0.1030
RETAIL REDLINING IN NEW YORK CITY
TABLE 3 (Continued)
Intercept MN MPI PctBlk PopDens Income Subway
Athletic shoe store
Estimates 4.8400* −0.2320* −0.0001 0.0148* −6.66E−08* 0.0000 0.0000
SD 0.0285 0.0163 0.0000 0.0050 0.0000 0.0000 0.0000
p value 0.0000 0.0000 0.0903 0.0030 0.0000 0.4510 0.2230
Pharmacy and household sundries no. 1
Estimates 3.6300* −0.0054 0.0000* 0.0106* −7.09E−08* 0.0000 −1.54E−07
SD 0.0325 0.0168 0.0000 0.0051 0.0000 0.0000 0.0000
p value 0.0000 0.7480 0.0487 0.0392 0.0000 0.9830 0.0006
Pharmacy and household sundries no. 2
Estimates 1.8200* −0.1030* −0.0001* 0.0377* −1.03E−07* 0.0000* 0.0000
SD 0.0110 0.0135 0.0000 0.0045 0.0000 0.0000 0.0000
p value 0.0000 0.0000 0.0000 0.0000 0.0000 0.0067 0.0561
Pharmacy and household sundries no. 3
Estimates 2.3400* −0.0551* −0.0001* 0.0228* −1.44E−07* 0.0000 0.0000
SD 0.0629 0.0230 0.0000 0.0070 0.0000 0.0000 0.0000
p value 0.0000 0.0167 0.0000 0.0011 0.0000 0.1990 0.4770
Fitness clubs
Estimates 2.7500* −0.1000* −0.0001* 0.0050 −8.26E−08* 0.0000 −1.37E−07*
SD 0.0206 0.0165 0.0000 0.0052 0.0000 0.0000 0.0000
p value 0.0000 0.0000 0.0021 0.3360 0.0000 0.8860 0.0025
Video game store
Estimates 3.8300* −0.1580* −0.0001* 0.0194* −4.00E−08* −1.11E−07* 0.0000
SD 0.0507 0.0186 0.0000 0.0057 0.0000 0.0000 0.0000
p value 0.0000 0.0000 0.0317 0.0006 0.0178 0.0017 0.7670
*pG0.05, level of significance
size. Including spatial correlation in the errors caused more of the variation in the
response to be taken up there. In comparison to the independent models, when
percent Black was significant, the direct effect was lessened because some of the
effect is due to what occurs in neighboring areas. In one instance (fast food
restaurant no. 5), the direction changed from negative to positive, but remained
statistically significant.
In all models, we examined the effect of the percentage of Black residents on
distance to nearest store, controlling for median household income, population
density, retail demand, subway ridership, and location in the borough of
Manhattan. Decreasing/negative distance to stores that are beneficial for health is
a positive outcome, because it indicates that residents do not have to travel as far to
the nearest store. Decreasing/negative distance to stores that are deleterious to health
is a negative outcome, because it indicates that residents in those areas face greater
risk environments. All stores except fast food were considered beneficial for health.
Overall, distance to nearest store tended to decrease as subway ridership,
population density, and retail demand (MPI) increased. Income tended not to be
associated with store distance. Location in Manhattan, the commercial and business
center of the five boroughs, was always negatively associated with distance to
nearest stores (though not statistically significant for two stores). Below we discuss
the association between percent Black and store access by human need and category.
For clarity, we use “nearby stores” to indicate decreasing distances to nearest store;
“distant stores” refers to increasing distances to nearest store.
Human Need: Hygiene The store category here was apparel (clothing and shoes).
For clothing, but not general shoes or athletic shoes, increases in retail demand wereKWATE ET AL. associated with nearby stores. After controlling for MPI and other variables, we found that each increase in percent Black was associated with a 0.015-km increase in distance to the nearest clothing store. Percent Black was also associated with distant athletic shoe stores, athletic shoe and sporting good stores, and general shoes. Human Need: Healing The first category was pharmacies, comprising three separate chains. For all pharmacies, increasing retail demand was associated with nearby stores. After controlling for MPI and other variables, percent Black was associated with distant stores for all three chains. These chains had many stores throughout the city; chain no. 3 had the second highest number of outlets of any store. Despite the high prevalence, residents in predominantly Black areas have to travel further distances to reach them. The estimate was largest for chain no. 2, at 0.038 km (0.4 city blocks) increase for each increase in percent Black. The second category, health supplements, had fewer stores than pharmacies and household sundries. Percent Black was again associated with distant supplement stores. Taken together, access is compromised in predominantly Black areas to medicines, medical supplies, health supplements, and household supplies. Conversely, distance to health-deleterious nutrition in the form of fast food generally decreased as percent Black increased. Retail demand was not significantly associated with one chain (no. 3), but otherwise, as demand increased, distance to fast food decreased. After controlling for MPI and other variables, percent Black was variably associated with three chains. For the remaining three, percent Black was associated with nearby stores. The largest estimate for nearby fast food (chain no. 2) was the same magnitude (0.038 km) as distant pharmacies (chain no. 2). Human Need: Information We examined the category information and technology with electronics stores and bookstores. Increasing retail demand was associated with nearby stores. And, as with most other stores, after controlling for MPI and other variables, percent Black was associated distant electronics stores. This was one of the more prevalent store chains in our sample. Percent Black was also related to distant bookstores, but this association was not statistically significant. Finally, we investigated educational and professional supplies in the form of office supply stores. Here again, percent Black was associated with distant stores. Human Need: Play We used fitness clubs and video game stores to operationalize play. For both categories, increasing retail demand was associated with nearby facilities. After controlling for MPI and other variables, percent Black was not significantly associated with distance to the nearest fitness club. Like most other stores, distance to video game stores increased as a function of percent Black. Secondary Analyses Although our primary focus was on percent Black as a predictor of retail access, we also examined the effects of percent White using the same models. Given the high levels of residential segregation in NYC, we might expect a neatly opposite set of findings for the proportion of White residents. This was only partially true. Of the seven stores for which percent Black was associated with distant stores (clothing, pharmacies, health supplements, and office supplies), we did indeed observe nearby stores for percent White. Additionally, three of the four fast food restaurants with a significant association with percent Black showed an opposite, and significant
RETAIL REDLINING IN NEW YORK CITY

relationship with percent White (distance to nearest increased). Stores that were
non-significant for percent Black (fitness clubs and two fast food restaurants) were
also non-significant for percent White. Finally, 7 stores (35 %) showed no
association with percent White after controlling for covariates. These stores showed
a statistically significant relationship with percent Black, but when modeled with
percent White, area characteristics such as MPI, median household income, and
subway ridership better explained distance to the nearest store. Race appears to
come more into the fore in predicting store location when residents are Black.

DISCUSSION
We investigated retail redlining in NYC by asking whether predominantly Black areas
had restricted access to retail resources after accounting for area characteristics that
would be central in business siting: median household income, population density,
subway ridership, and retail demand. We hypothesized that after these controls, as
percent Black increased, so too would distance to the nearest health-promoting store
(across several retail categories); conversely, we hypothesized that percent Black would
be inversely related to the distance to the nearest health-deleterious store (fast food).
Almost across the board, the results supported our hypotheses. Spatial mapping showed
that retail demand was often similar across areas with varied racial and socioeconomic
characteristics. Yet, spatial regressions revealed that as percent Black increased, the
distance to the nearest clothing store, shoe store (general and athletic), pharmacy, health
supplement store, electronics store, office supply store, and video game store increased.
Cooper et al.10 surmised that perhaps chain pharmacies have less coverage of urban
communities with low percentages of White residents. Our data support this assertion
for several pharmacy chains. Distance to fast food decreased with more Black
residents, concordant with other studies.19
   Retail demand was inversely associated with percent Black. That is, predominantly
Black areas were described as having low demand for a variety of goods and services.
Even after accounting for this low demand, inequalities in retail access persisted. Indeed,
the measure of retail demand we used—the market potential index—likely
underestimates demand in Black neighborhoods. The index is based in part on
surveys (e.g.,25) that ask respondents not necessarily to report affinities towards
particular brands, but to discuss the frequency of patronizing shops in their area.
Given that Black neighborhoods are unlikely to have the stores about which the
survey inquires, residents will perforce give responses that indicate minimal
shopping at these outlets, spuriously suggesting lack of demand. If the best
available measures artificially reduce demand in Black neighborhoods, our results
would underestimate the magnitude of retail redlining.
   Some study limitations should be noted. First, we focused on large national and
multinational retail chains, given literature on retail redlining, the necessity of
studying multiple store locations across the city, and the availability of data on retail
demand for these establishments. Thus, our analysis precluded the inclusion of small
independent retailers. Research is needed to investigate the number and trajectory of
small stores over time in Black neighborhoods. If they also cede these areas as
markets, our findings would again underestimate the lack of retail accessibility for
Black residents. A second limitation related to our data is the fact that we retrieved
our data from a private vendor database, and although we cleaned the data to be
free of obvious errors, some aspects of data integrity are unclear and are not easily
checked. For example, stores listed in the database may have closed, and new stores
KWATE ET AL.

may have opened, but were not yet included in the database at the time we compiled
our sample. Some stores may simply be missing altogether. If inaccuracies were not
distributed at random, our analyses could be biased. However, research has shown
good concordance between commercial databases and direct observation. For one of
the store types we studied (drugstores), 95.8 % agreement was observed between
vendor and street-collected data. When disagreement occurred, it was not associated
with population characteristics.2
   Our operationalizations of retail access also have some limitations. Macintyre,
Macdonald, and Ellaway22 argue that researchers should carefully theorize the direction
of effects for given resources. For example, bus stops may give access to transportation
and increase walking and access to jobs, but they may also produce more diesel fumes,
pedestrian and bicycle accidents and traffic noise. In our study, we categorized
pharmacies as health supportive because they provide day-to-day health related goods,
first aid supplies, and access to prescription medicines. However, pharmacies
increasingly resemble convenience stores, with more and more aisles dedicated to
processed and energy dense foods and beverages. Proximity to convenience stores is
related to overweight/obesity/poor diet.6 Also, we measured access by distance alone. In
fact, material and social attributes other than proximity affect retail access and healthy
behaviors.38 Indeed, research has shown that crime shrinks effective resource
availability, while public transit increases it in Black neighborhoods.3
   Finally, we did not control for every possible factor that could influence where
stores locate. Returning to D’Rozario and Williams’12 formulation, retailers
typically cite low populations, insufficient household incomes, and downscale tastes
and preferences. Our results showed that inequities in access persisted after
controlling for these variables. Retailers also cite high crime rates and high
insurance rates. We did not control for crime rates, as we did not have access to
detailed, temporally and spatially appropriate data (see30 for basic precinct-level
data). Still, it is difficult to articulate a coherent logic about why crime might drive
the racial patterning of six retail categories across NYC, after accounting for area
income, population density, retail demand and numbers of subway riders. Crime
levels are not constant across areas varying in these attributes. It also remains
unclear why fast food retailers (which had shorter distances to Black areas) would
be inured to high crime rates, if we expect crime to be uniformly high across all
Black neighborhoods. Thus, it is unlikely that spatial areas with high concentrations
of Black residents have greater distances to retail due to high crime levels.
   Taken together, our findings suggest retail redlining of predominantly Black areas
in NYC. Research is needed to investigate the processes by which these patterns
come to pass, and to investigate the complex relationships residents have with
stores, particularly independents vs. national chains. Meltzer and Schuetz26 found
that economically upgrading zip codes saw more retail presence between 1998 and
2007. However, in Central Harlem, despite years of gentrification and the
introduction of empowerment zones, retail declined markedly between 1995 and
2006, in part due to building demolition. Where retail increases in Harlem did
occur, gains took place among large chains and entrepreneurial “boutiques,” while
older, local retail declined.44 In gentrifying neighborhoods, residents may appreciate
more resources, but face disruptions in social bonds forged with small business
owners, and resent the linkage of new stores to White newcomers.44 It is not our
contention that the proliferation of large retail chains is always unequivocally to the
benefit of Black neighborhoods. But redlining by large chains broadly categorizes
Black communities as unwanted markets, which has implications for future
RETAIL REDLINING IN NEW YORK CITY

disinvestment. Retail redlining reflects and perpetuates inequalities that have
important social and health consequences.
    One such consequence is likely to be health status. More research is needed to
investigate how retail affects health. As with studies of segregation more generally,
research should investigate how health effects operate cross-sectionally and cumula-
tively.41 It will be important to investigate health effects beyond constrained access to
protective resources (e.g., pharmacies) or over-exposure to unhealthy resources (e.g.,
fast food). Retail redlining could also act as a stressor, initiating poor health outcomes
and exacerbating extant ones. Poor health status results from constricted participation
in the social and economic life of the country17 and neighborhood problems in
segregated neighborhoods are likely to lead to negative health outcomes as a result of
high allostatic load.23 A dearth of available retail can be counted among these kinds of
exposures. A lack of entertainment venues and places to shop are associated with
impaired health39 and lengthy travel to needed resources often at higher prices, is a
significant stressor for many residents in Black neighborhoods.4 Moreover, to the
extent that deficits in community resources are perceived as the result of racism,
residents again are at risk of negative health outcomes.31,32
    Longitudinal research is also needed to investigate whether retail redlining perpetuates
disadvantage. As noted earlier, measures of retail demand may derive in part from
reported behaviors, rather than expressed shopping preferences. In Black neighbor-
hoods, particular consumer behaviors may not occur simply because residents do not
have the access to facilities to do so. The end result is the initiation of a vicious cycle. Low
purported retail demand leads to a paucity of organizational resources; this paucity leads
to decrements in consumer behavior and in the retail reputation of Black neighborhoods,
which further mark these areas as untenable for stores. Black neighborhoods are
misperceived with regard to market size, buying power, and market risk and stability,1
and White, suburban and exurban spaces are construed as the most savvy and eligible
consumer markets. Retail reputation also affects asset accumulation vis-à-vis home-
ownership, the primary means through which Americans build wealth.36 Retail and
other organizational amenities are important determinants of neighborhood desirabil-
ity, making the under-resourced context in Black neighborhoods a factor in lower
home values. Together, retail redlining could harm African American health and well
being through effects on resource access, stress, and opportunity structures.

ACKNOWLEDGMENTS
This research was supported in part by grant #63155 from the Healthy Eating
Research Program of the Robert Wood Johnson Foundation.

REFERENCES
 1. Achugbue E. Nontraditional market analyses: dismantling barriers to retail development
    in underserved neighborhoods. Res Rev. 2006; 13(3): 15–18.
 2. Bader MDM, Ailshire JA, Morenoff JD, House JS. Measurement of the local food
    environment: a comparison of existing data sources. Am J Epidemiol. 2010; 171(5): 609–617.
 3. Bader MDM, Purciel M, Yousefzadeh P, Neckerman KM. Disparities in neighborhood
    food environments: implications of measurement strategies. Economic Geography. 2010;
    86(4): 409–430.
 4. Barnes SL. The Cost of Being Poor: a comparative study of life in poor urban
    neighborhoods in Gary, Indiana. Albany: State University of New York Press; 2005.
KWATE ET AL.
5. Beaulac J, Kristjansson E, Cummins S. A systematic review of food deserts, 1966–2007.
Prev Chron Dis. 2009; 6(3): 1–10.
6. Bodor JN, Rice JC, Farley TA, Swalm CM, Rose D. The association between obesity and
urban food environments. J Urban Health. 2010; 87(5): 771–781.
7. Burrows R, Gane N. Geodemographics, software, and class. Sociol. 2006; 40(5): 793–
812.
8. Center for an Urban Future. (2009). Return of the chains: this year’s borough by borough
analysis of New York City’s largest retailers (vol. 2). New York, NY: Center for an Urban
Future.
9. Chiefo S, Kneece S, Gasper S, Mundy T, Inamura M, Solomon B. Pittsburgh purchasing
power profiles. Pittsburgh: Carnegie Mellon University; 2004.
10. Cooper HL, Bossak BH, Tempalski B, Friedman SR, Des Jarlais DC. Temporal trends in
spatial access to pharmacies that sell over-the-counter syringes in New York City health
districts: relationship to local racial/ethnic composition and need. J Urban Health. 2009;
86(6): 929–945.
11. Cummins SCJ, McKay L, Macintyre S. McDonald’s restaurants and neighborhood
deprivation in Scotland and England. Am J Prev Med. 2005; 29(4): 308–310.
12. D’Rozario D, Williams JD. Retail redlining: definition, theory, typology, and measure-
ment. J Macromarket. 2005; 25(2): 175–186.
13. ESRI. Community tapestry handbook. Redlands: ESRI; 2007.
14. ESRI. Methodology statement: ESRI Data–Market Potential. Redlands: ESRI; 2009.
15. Hellig A, Sawicki DS. Race and residential accessibility to shopping and services. Hous
Policy Debate. 2003; 14(1 and 2): 69–101.
16. Kramer MR, Hogue CR. Is segregation bad for your health? Epidemiologic Reviews.
2009; 31: 178–194.
17. Krieger N. Embodying inequality: a review of concepts, measures, and methods for
studying health consequences of discrimination. Int J Health Serv. 1999; 29(2): 295–352.
18. Kwate NOA, Meyer IH. Association between residential exposure to outdoor alcohol
advertising and problem drinking among African American women in New York City.
Am J Public Health. 2009; 99(2): 228–230.
19. Kwate NOA, Yau CY, Loh JM, Williams D. Inequality in obesigenic environments: fast
food density in New York City. Health & Place. 2009; 15: 364–373.
20. LaVeist TA, Wallace JM. Health risk and inequitable distribution of liquor stores in
African American neighborhood. Soc Sci Med. 2000; 51: 613–617.
21. Macintyre S, Ellaway A, Cummins S. Place effects on health: how can we conceptualise,
operationalise and measure them? Soc Sci Med. 2002; 55(1): 125–139.
22. Macintyre S, Macdonald L, Ellaway A. Do poorer people have poorer access to local
resources and facilities? The distribution of local resources by area deprivation in
Glasgow, Scotland. Soc Sci Med. 2008; 67: 900–914.
23. Massey DS. Segregation and stratification: a biosocial perspective. Du Bois Rev Soc Sci
Res Race. 2004; 1(1): 7–25.
24. Mays VM, Cochran SD, Barnes NW. Race, race-based discrimination, and health
outcomes among African Americans. Annu Rev Psychol. 2007; 58: 201–225.
25. Mediamark Research & Intelligence. Survey of the American Consumer. New York: GfK
MRI; 2008.
26. Meltzer, R., & Schuetz, J. (2011, online first). Bodegas or bagel shops? Neighborhood
differences in retail and household services. Economic Development Quarterly, DOI:
10.1177/0891242411430328.
27. Morland K, Wing S, Diez RA. The contextual effect of the local food environment on
residents’ diets: the atherosclerosis risk in communities study. Am J Publ Health. 2002; 92
(11): 1761–1767.
28. New York City Department of City Planning. (2007). Census FactFinder. Retrieved
September 1, 2005 http://gis.nyc.gov/dcp/pa/address.jsp.RETAIL REDLINING IN NEW YORK CITY
29. New York City Department of City Planning. (2011). Population Census 2010. Table PL-
P2A NYC: Total Population by Mutually Exclusive Race and Hispanic Origin New York
City and Boroughs, 1990 to 2010. http://www.nyc.gov/html/dcp/pdf/census/census2010/
t_pl_p2a_nyc.pdf.
30. NYPD Crime Statistics. (2011). Crime Prevention, Crime Statistics. http://www.nyc.gov/
html/nypd/html/crime_prevention/crime_statistics.shtml.
31. Paradies Y. A systematic review of empirical research on self-reported racism and health.
Int J Epidemiol. 2006; 35: 888–901.
32. Pascoe EA, Smart Richman L. Perceived discrimination and health: a meta-analytic
review. Psychol Bull. 2009; 135(4): 531–554.
33. Pearce J, Blakely T, Witten K, Bartie P. Neighborhood deprivation and access to fast-food
retailing. Am J Prev Med. 2007; 32(5): 375–382.
34. Schulz AJ, Kannan S, Dvonch JT, Israel BA, Allen A, 3rd James SA, Lepkowski J. Social
and physical environments and disparities in risk for cardiovascular disease: the healthy
environments partnership conceptual model. Environ Health Perspect. 2005; 113(12):
1817–1825.
35. Schulz AJ, Williams DR, Israel BA, Lempert LB. Racial and spatial relations as
fundamental determinants of health in Detroit. Milbank Q. 2002; 80(4): 677–707.
36. Shapiro TM. The hidden cost of being African American: how wealth perpetuates
inequality. New York: Oxford University Press; 2005.
37. Small ML, McDermott M. The presence of organizational resources in poor urban
neighborhoods: an analysis of average and contextual effects. Soc Forces. 2006; 84(3):
1697–1724.
38. Smiley MJ, Diez Roux AV, Brines SJ, Brown DG, Evenson KR, Rodriguez DA. A spatial
analysis of health-related resources in three diverse metropolitan areas. Health & Place.
2010; 16: 885–892.
39. Steptoe A, Feldman PJ. Neighborhood problems as sources of chronic stress: development
of a measure of neighborhood problems, and associations with socioeconomic status and
health. Ann Behav Med. 2001; 23(3): 177–185.
40. Walker RE, Keane CR, Burke JG. Disparities and access to healthy food in the United
States: a review of food deserts literature. Health & Place. 2010; 16: 876–884.
41. White K, Borrell LN. Racial/ethnic residential segregation: framing the context of health
risk and health disparities. Health & Place. 2011; 17: 438–448.
42. Williams DR, Collins C. Racial residential segregation: a fundamental cause of racial
disparities in health. Public Health Rep. 2001; 116(5): 404–416.
43. Wright K. Restocking stores: Detroit’s retail market potential. Ann Arbor: Urban &
Regional Planning Program, University of Michigan; 2003.
44. Zukin S, Trujillo V, Frase P, Jackson D, Recuber T, Walker A. New retail capital and
neighborhood change: boutiques and gentrification in New York City. City &
Community. 2009; 8(1): 47–64.You can also read