Perceptions of Covid-19 lockdowns and related public health measures in Austria: a longitudinal online survey
←
→
Page content transcription
If your browser does not render page correctly, please read the page content below
Łaszewska et al. BMC Public Health    (2021) 21:1502
https://doi.org/10.1186/s12889-021-11476-3

 RESEARCH                                                                                                                                           Open Access

Perceptions of Covid-19 lockdowns and
related public health measures in Austria: a
longitudinal online survey
Agata Łaszewska*, Timea Helter and Judit Simon

  Abstract
  Background: Introducing national lockdown has been effective in containing Covid-19. However, several studies
  indicated negative impacts of lockdowns on the well-being and mental health of many people. In Austria, the first
  Covid-19-related lockdown was introduced on 16 March 2020 with most restrictions being lifted 1 month later.
  Seven months after that, in November 2020, the second full lockdown was implemented. The aim of this study was
  to compare the perceptions and experiences of the general population related to the first and second Covid-19
  lockdowns in Austria.
  Methods: Two waves of an online survey were conducted in May and December 2020 asking respondents about
  their concerns related to the Covid-19 illness, personal experiences of the lockdowns, perceptions of and
  compliance with imposed public health measures, and the impact of the Covid-19 pandemic on different aspects
  of life during the two lockdowns. Descriptive statistics including frequency analysis were used to compare
  respondents’ answers collected in the two waves of the survey. T-test and chi-square tests were used to test
  differences between the two lockdowns.
  Results: Five hundred sixty participants were included in the first wave and a sub-sample of 134 participants in the
  second wave of data collection. During the second lockdown, study respondents were more concerned about their
  family members contracting Covid-19 when compared with the first lockdown. Compliance with public health
  measures was overall lower during the second lockdown, although it varied according to the type of the measure.
  Closure of schools was seen as the least essential restriction during the second lockdown, while wearing masks
  gained additional approval between the first and the second lockdown. Larger negative impacts of the Covid-19
  pandemic on friendships, leisure activities, education and community were reported during the second lockdown.
  Conclusions: The study found that the extended duration of the pandemic and recurring lockdowns restricting
  freedom of movement and social contacts appear to have caused significant disruptions to many areas of life.
  Furthermore, declining adherence to most public health measures over time raises a question about the
  effectiveness of future lockdown measures.

* Correspondence: agata.laszewska@meduniwien.ac.at
Medical University of Vienna, Center for Public Health, Department of Health
Economics, Kinderspitalgasse 15, 1090 Vienna, Austria

                                        © The Author(s). 2021 Open Access This article is licensed under a Creative Commons Attribution 4.0 International License,
                                        which permits use, sharing, adaptation, distribution and reproduction in any medium or format, as long as you give
                                        appropriate credit to the original author(s) and the source, provide a link to the Creative Commons licence, and indicate if
                                        changes were made. The images or other third party material in this article are included in the article's Creative Commons
                                        licence, unless indicated otherwise in a credit line to the material. If material is not included in the article's Creative Commons
                                        licence and your intended use is not permitted by statutory regulation or exceeds the permitted use, you will need to obtain
                                        permission directly from the copyright holder. To view a copy of this licence, visit http://creativecommons.org/licenses/by/4.0/.
                                        The Creative Commons Public Domain Dedication waiver (http://creativecommons.org/publicdomain/zero/1.0/) applies to the
                                        data made available in this article, unless otherwise stated in a credit line to the data.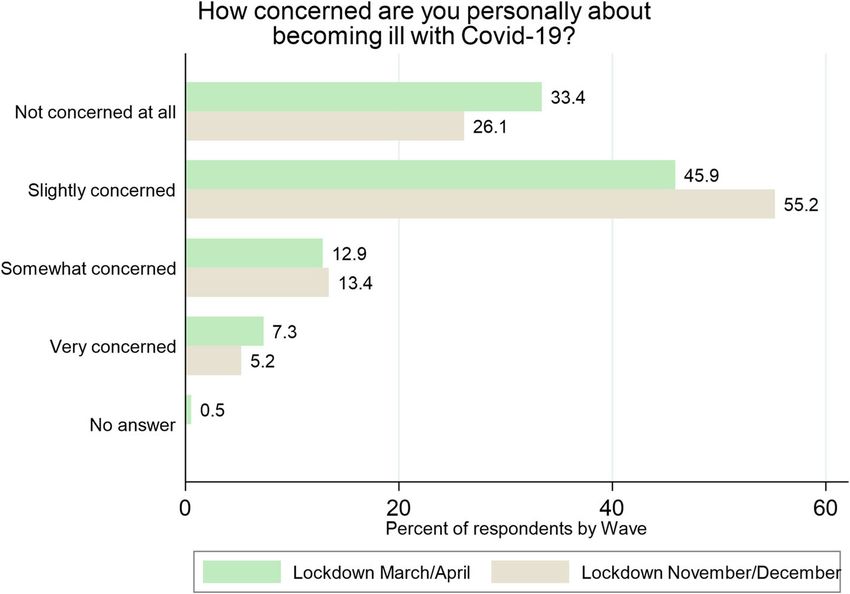
Łaszewska et al. BMC Public Health   (2021) 21:1502                                                            Page 2 of 14

Introduction                                                  largely suspended. Strict contact regulations and curfews
Lockdowns during the Coronavirus disease 2019 (Covid-         based on the Covid-19 law came into force [20]. On 26
19) outbreak include a range of largely non-                  March a peak of new daily cases (1050 cases) was re-
pharmaceutical interventions to limit physical interac-       ported and a peak of daily deaths from Covid-19
tions and introduce social distancing [1]. Although the       followed on 6 April with 31 deaths reported [19]. The
introduction of a lockdown is an effective strategy to        number of active cases started to decrease after reaching
slow the spread of infection [2], several studies pointed     its peak (8981 active cases) in the beginning of April
out its negative effects on mental health [3–5], health       2020, which led to an easing of restrictions beginning 14
behaviours [6], social connectedness, and loneliness [4].     April.
A recent report presented by the Association of Schools          After a summer with fairly low case numbers, a
of Public Health in the European Region found that            steeper growth curve was observed from September on-
lockdown restrictions contributed to an increase in           wards with a dramatic increase in new daily cases in Oc-
problems such as addiction, poor diet, lack of physical       tober [16, 19]. While at the end of September 8602
activity, deteriorating mental health, and domestic vio-      active Covid-19 cases were reported in Austria, this
lence [7]. As these lockdowns have so negatively affected     number grew to 43,187 by 31 October [19], an increase
individuals in these ways and have had a devastating im-      of 400%. On 11 November 2020 a peak of new daily in-
pact on economic growth, public debt and employment           fections was reported at 9216 confirmed cases.
[8], lockdown measures should be administered carefully          Based on the success of the first lockdown in reducing
and should be based on unbiased carefully collected data      the spread of the virus, the Austrian government imple-
[9, 10]. The adverse effects of the lockdowns should not      mented a second lockdown to hinder the rapidly grow-
be ignored and officials should take every measure to         ing pandemic curve. On 3 November a “light” lockdown
minimise the societal impact and ensure that this experi-     was imposed which quickly turned into another “hard”
ence is as tolerable as possible for the general population   national lockdown that began on 17 November. The re-
[11–14]. Therefore, the evaluation of lockdown strat-         strictions included closure of cafes, restaurants, hair-
egies and containment policies is crucial. In a cross-        dressers and beauty salons, and all shops except those
sectional study, Sabat et al. found that citizens of seven    providing essential services and selling essential goods
European countries (Denmark, France, Germany, Italy,          (e.g. grocery stores, pharmacies, post offices, gas stations,
Portugal, the Netherlands, and the UK) were generally         etc.) with an obligatory closing time of 7:00 pm. Primary
satisfied with their government’s responses to the Covid-     schools joined secondary schools and universities in
19 outbreak [15]. To the best of our knowledge, there         moving to distance learning. A 24-h curfew was intro-
are only a few studies published so far that assess policy    duced and people were allowed to leave their homes
responses and people’s perceptions of the implemented         only for essential purposes such as: caring for other
public health measures during the Covid-19 outbreak           people or animals, family duties, outdoor exercise, and
and their compliance with the government-advised pre-         visiting religious institutions. Visits in hospitals and
ventive measures across several time-points.                  nursing homes were reduced to one visit per week. In
                                                              public spaces, one meter distance between persons out-
Lockdowns in Austria                                          side the same households was required as well as com-
Austria initially reacted quickly to the Covid-19 pan-        pulsory masks in indoor spaces and public transport.
demic and was praised for the policies it implemented to      Only take-away and delivery was allowed for restaurants,
contain the virus [16]. The first lockdown was intro-         and hotels and accommodation establishments closed,
duced in March and the second one in November. Both           with an exception for business trips. Events were prohib-
required all non-essential business and schools to close      ited, and sports and leisure facilities were closed. Home
and reduce social contacts. According to the Oxford           office was recommended when possible but was not
Covid-19 government response stringency index, at the         mandatory [21]. This lockdown remained in effect until
time of the first and the second lockdown, the score for      6 December.
Austria on a scale from 0 to 100 (100 = strictest) was
81.48 and 82.41, respectively [17].                           Aim of the study
  The first case of Covid-19 in Austria was diagnosed on      Studies conducted in Austria reported many negative
25 February 2020 [18]. The first lockdown was imposed         impacts of the Covid-19 lockdowns including increased
20 days later on 16 March when the cases grew to 1192         loneliness [22], worsening of mental health [23–26], de-
[19]. Stores selling non-essential goods as well as bars,     creased quality of life [24], and decreased engagement in
restaurants, federal parks, sports facilities and public      sports [27]. In terms of the long-term impacts, one study
baths were forced to close. Supermarkets, chemist’s           reported that depression did not improve in the weeks
shops and pharmacies remained open. Air traffic was           after lifting lockdown measures [28]. The Austrian
Łaszewska et al. BMC Public Health (2021) 21:1502 Page 3 of 14
Corona Panel Project showed further negative effects of Survey design
the Covid-19 lockdowns [29] in terms of the economic, The survey was developed in the SoSci online survey
political and health aspects such as loss of income espe- platform [34]. The survey was conducted in German and
cially among low income households, loss of trust in the consisted of questions about socio-demographics, Covid-
parliament and the federal government, and an increase 19-related questions (including information about
in the cigarette and alcohol consumption during the first Covid-19 infections), lockdown-related questions (in-
lockdown [30–33]. Due to the negative consequences of cluding the perceptions of the public health measures in
the lockdowns and of the pandemic, nuanced evaluation place during the lockdown in Austria). The question-
of policies is crucial for the design of future restrictions naire used in the study (translated to English) is pro-
implemented to contain the spread of Covid-19. In this vided in Supplementary file 1. Further details of the
study, the aim was to assess and compare the general study design and recruitment can be found in Simon
population’s experiences of the Covid-19 situation and et al. [26].
their attitudes towards public health measures during
the two lockdowns in spring and fall of 2020 in Austria.
Data analysis
Collected data were checked for inconsistencies. Any
Methods entry with time of completion below 7 min was deleted
Recruitment of study participants from the dataset. Data were analysed primarily using de-
Study participants were recruited using convenience scriptive statistics. Mean values and standard deviation
sampling, i.e. people who self-selected to become were reported for continuous variables and frequencies
part of a study when responding to an advert. Any were reported for categorical variables.
adult over 18 years with sufficient German know- Data related to the personal experience of the Covid-
ledge and main residency in Austria was able to 19 lockdowns were collected on a five-point Likert scale
participate. (1 – Strongly disagree, 2 – Slightly disagree, 3 – Neutral,
The first wave of the survey was conducted between 4 – Slightly agree, 5 – Strongly agree) with higher scores
27 May and 16 June 2020, with all questions referring to presenting higher level of agreement with the statement
the one-month lockdown period in Austria between 16 presented to the study participants. Data were sum-
March and 15 April 2020. The weblink for the online marised using means and standard deviations for ease of
survey was distributed via social media platforms (Face- comparison of the answers between the two lockdowns.
book and Twitter) and by directly contacting several in- Differences between the two lockdowns were assessed
stitutions across Austria (e.g. universities, sport clubs, using the chi-square test for categorical variables.
the Red Cross, non-profit mental health organisations Variables related to the perceptions of the necessity of
such as pro mente). Information about the study was imposed public health measures and compliance with
shared on the Facebook and Twitter sites of the Medical the public health measures were collected on a scale
University of Vienna and through various Facebook from 1 to 10 (ranging from 1 ‘Completely unnecessary’
groups related to Covid-19 (e.g. Coronavirus Österreich, to 10 ‘Absolutely essential’; and from 1 ‘Not complying
Coronavirus Österreich Info, Das Coronavirus (Covid- at all’ to 10 ‘Complying completely’). These data were
19) Hilfe & Erfahrungen & Austausch). To reach a more re-coded to a 5-point scale: 1 – Completely unnecessary
diverse study sample, information about the study was (answers 1, 2), 2 – Unnecessary (answers 3, 4), 3 – Neu-
posted to the comments sections under Covid-19-related tral (answers 5, 6), 4 – Necessary (answers 7, 8), 5 – Ab-
articles on Facebook that were shared by the most popu- solutely essential (answers 9, 10); and 1 – Not
lar newspapers in Austria (e.g. Der Standard, Die Presse, complying at all (answers 1, 2), 2 – Not always comply-
Ö24, Heute and local online newspapers). As part of the ing (answers 3, 4), 3 – Neutral (answers 5, 6), 4 – Com-
first wave of data collection, all recruited participants plying most of the time (answers 7, 8), 5 – Complying
were invited to provide their e-mail addresses at the end completely (answers 9, 10) and presented as frequencies.
of the survey and agree to be contacted for follow-up Variables related to the impact of Covid-19 on differ-
data collection. ent areas of life were collected on a 1 to 10 scale (1 ‘No
The second wave of the study was conducted between disruption at all, 10 ‘Serious disruption’) and the differ-
2 December and 9 December 2020 with questions refer- ences in answers between the two lockdowns were
ring to the second national lockdown in Austria between assessed using a two-sample t-test with unequal
17 November and 6 December 2020. Those participants, variances.
who provided their e-mail addresses in the first round of We used an alpha level of 0.05 for all statistical tests.
data collection, were contacted and a link to the second All analyses were performed in Stata v.16. The graphs
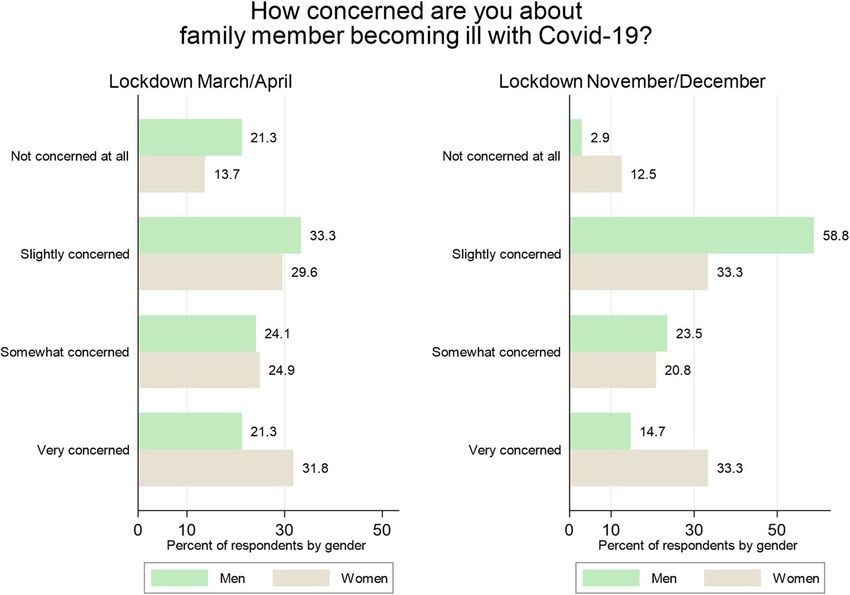
survey was provided. were created in Stata v.16 and Python.Łaszewska et al. BMC Public Health (2021) 21:1502 Page 4 of 14 Results family or friends (χ2(1,N = 694) = 67.58, p < .001) com- Participant characteristics pared to respondents in the first wave of the study. In the In the first wave of the survey (data collection in May– second wave of the study more respondents (10%) re- June 2020) valid answers were obtained from 560 partic- ported that they had to quarantine or self-isolate during ipants. Of these 560 participants, 228 provided their e- the previous month due to Covid-19, compared to the mail addresses and agreed to be contacted in the future. first wave (4%) (χ2(1, N = 694) = 8.61; p < .01) (Table 1). From the 228 persons who were re-contacted during the second wave of the survey (data collection in December 2020), 141 responded among which 134 (59% response Concern about Covid-19 rate) provided valid answers and were included in the The greater spread of the coronavirus among the Aus- analysis of the second wave of the survey (Fig. 1). trian population during fall 2020 was well-indicated in Table 1 presents the characteristics of study partici- the answers of the respondents about their concerns of pants during the two waves of data collection. Partici- contracting Covid-19. During the second lockdown in pants in the second wave were on average 3 years older. November/December, respondents were more con- Otherwise, there was no significant difference in the cerned that they might become infected than during the main socio-demographic variables between the two sur- first lockdown in March/April. In the first lockdown, veys. Data relating to the socio-demographic characteris- 34% of participants were not concerned at all, leaving tics of the sample compared to official Austrian 66% of respondents somewhat, slightly or very con- population statistics, with respect to age, gender, distri- cerned (Fig. 2). During the second lockdown, the pro- bution of population across federal states [35], migration portion of study participants who were somewhat, background [36], education level [37], and employment slightly or very concerned about infection rose to 74%. status [38], are shown in Supplementary file 2 (Table However, the differences between the two lockdowns 1A). were not statistically significant (χ2(4, N = 694) = 5.19; As indicated by the Covid-19-related variables, in the p < .27). During the first lockdown, women were slightly second wave of data collection significantly more respon- more concerned than men, however, during the second dents had indirect experience with Covid-19 through lockdown this difference was no longer observable. Fig. 1 Recruitment of study participants
Łaszewska et al. BMC Public Health    (2021) 21:1502                                                                   Page 5 of 14

Table 1 Respondent characteristics in the two waves of data collection
                                                  Lockdown March/April   Lockdown November/December   Difference
                                                  N = 560                N = 134
                                                  N          %           N             %
Gender
  Female                                          416        74%         98            73%            χ2(2, N = 694) = 1.24; p = .54
  Male                                            143        26%         35            26%
  Diverse                                         1          0%          1             1%
  Missing                                         0          0%          0             0%
Age (Mean, SD)                                    40.22      11.60       43.40         12.83          t(685) = −2.79; p < .01
  18–29                                           97         17%         20            15%            χ2(3, N = 687) = 9.87; p = .02
  30–49                                           319        57%         63            47%
  50–64                                           124        22%         45            34%
  65–79                                           13         2%          6             4%
  Missing                                         7          1%          0             0%
Federal state
  Vienna                                          215        38%         62            46%            χ2(1, N = 694) = 2.80; p = .09
  Other federal states                            345        62%         72            54%
  Missing                                         0          0%          0             0%
Migration background
  No migration background                         489        87%         118           88%            χ2(1, N = 691) = 0.40; p = .53
  Migration background                            66         12%         13            10%
  Missing                                         5          1%          3             2%
Education
  Primary education                               13         2%          4             3%             χ2(2, N = 694) = 3.97; p = .14
  Secondary education                             245        44%         46            34%
  Higher education                                302        54%         84            63%
  Missing                                         0          0%          0             0%
Employment status
  Housekeeping                                    28         5%          5             4%             χ2(6, N = 694) = 3.49; p = .74
  Student                                         37         7%          8             6%
  Employed                                        410        73%         95            70%
  Self-employed                                   37         7%          9             7%
  Unemployed                                      16         3%          4             3%
  Retired                                         25         4%          11            8%
  Missing                                         7          1%          2             2%
Family status
  Single                                          204        36%         49            37%            χ2(4, N = 694) = 0.28; p = .99
  Married or registered partnership               286        52%         69            51%
  Widowed                                         6          1%          1             1%
  Divorced                                        46         8%          10            8%
  Missing                                         18         3%          5             4%
Children
  Yes                                             311        56%         77            57%            χ2(2, N = 694) = 1.07; p = .59
  No                                              245        44%         57            43%
  Missing                                         4          1%          0             0%
Łaszewska et al. BMC Public Health (2021) 21:1502 Page 6 of 14
Table 1 Respondent characteristics in the two waves of data collection (Continued)
Lockdown March/April Lockdown November/December Difference
N = 560 N = 134
N % N %
Direct Covid-19 experience 39 7% 8 6% χ2(1, N = 694) = 0.17; p = .68
Tested positive for Covid-19 7 1% 3 2%
Experienced symptoms of Covid-19, not tested 32 6% 5 4%
Missing 0 0% 0 0%
Indirect Covid-19 experiencea 110 20% 73 58% χ2(1, N = 694) = 67.58; p < .01
Close friend tested positive for Covid-19 46 9% 50 40%
Family member tested positive for Covid-19 32 6% 32 25%
Knew someone who died of Covid-19 44 8% 25 20%
Missing 0 0% 0 0%
Quarantine or self-isolation in the past monthsb χ2(1, N = 694) = 8.61; p < .01
Yes 23 4% 14 10%
No 537 96% 120 90%
Missing 0 0% 0 0%
Note: Respondents included in the “Direct Covid-19 experience” variable were excluded from this group;
a
b
In the 1st Wave of data collection this question referred to the time from the beginning of the pandemic until time of data collection (May/June 2020); for the
2nd Wave of data collection, this question referred to the time since May 2020 until time of data collection (December 2020)
Women were more concerned about their family among men was observed. While during the first
members becoming infected than men. During the lockdown 21% of men reported having no concerns
first lockdown, 32% of female respondents were ‘Very over their family members becoming infected with
concerned’ compared to 21% of male respondents; Covid-19, this proportion was reduced to just 3% dur-
during the second lockdown, 33% of females were ing the second wave of the study (Fig. 3). Observed
‘Very concerned’ as opposed to 15% of males. Change differences between men and women were statistically
in the attitude to the risk of Covid-19 infection significant in the first lockdown (χ2(3, N = 550) = 8.35;
Fig. 2 Concerned about Covid-19 illnessŁaszewska et al. BMC Public Health (2021) 21:1502 Page 7 of 14
p < .04) as well as in the second lockdown (χ2(3, N = Perceptions of imposed public health measures
130) = 9.52; p < .02). During both lockdowns, about three-quarters of the
study respondents agreed that the implemented public
health measures restricting movement of members of
Personal experience of the Covid-19 lockdowns the general public during the Covid-19 pandemic, were
In the second wave of the study, substantially more necessary to limit the outbreak of the virus (74% in
respondents indicated that the Covid-19 lockdown March/April and 77% in November/December) (Fig. 1A
did not pose any threat to their livelihood/income in Supplementary file 2).
as compared to the first wave of data collection With respect to the accessibility of sufficient infor-
(59% in March/April and 84% in November/Decem- mation surrounding the pandemic, during the first
ber) (χ2 (4, N = 690) = 45.34; p < .01). However, this lockdown in March/April, respondents were more
could be associated with the characteristics of study convinced that they received clear advice about the
participants who, in comparison to the general Covid-19 situation from the government, compared to
population in Austria, had higher education level the second lockdown in November/December (χ2(3,
(Supplementary file 2 Table 1A). In the second N = 694) = 15.81; p < .01) (Fig. 2A in Supplementary
lockdown, study participants felt slightly less iso- file 2). In March/April two-thirds (66%) of all respon-
lated compared to the lockdown in March/April, dents felt that the government provided sufficient in-
however, not a statistically significant improvement formation about the Covid-19 situation (31% did not
(Table 2). Variables ‘I now know better what is agree with the statement, and 3% provided no an-
really important in life’, ‘people being nicer because swer), while in November/December less than a half
of the pandemic’ and ‘being more connected to the (48%) agreed with this statement (48% did not agree,
local community’ were significantly more pro- and 4% provided no answer). There were no statisti-
nounced in the first lockdown as compared to the cally significant differences between male and female
second lockdown (Table 2). This finding suggests participants in either wave of the study. Interestingly,
that unprecedented situation of the pandemic ini- during both lockdowns, participants with migration
tially invoked strong feelings of solidarity, commu- background reported they felt they received more
nity, and appreciation which might have faded away clear advice from government, compared to those
with the prolonged time of the pandemic. without migration background (73% vs. 65% during
Fig. 3 Concerned about family member becoming ill with Covid-19 by genderŁaszewska et al. BMC Public Health (2021) 21:1502 Page 8 of 14
Table 2 Personal experience of the Covid-19 lockdowns
Lockdown March/ Lockdown November/ Difference Direction of Test of differencec
April December difference
Variablea N Mean (SD) N Mean (SD)
Lockdown is a threat to my livelihood/income 556 2.43 (1.40) 134 1.58 (0.98) −0.85 improved χ2(4, N = 690) = 45.34;
p < .01
It is more difficult than usual for me to focus 557 3.11 (1.36) 133 2.65 (1.39) −0.46 improved χ2(4, N = 690) = 14.19;
on my work or my normal, daily activities p < .01
I am less busy than usual 558 2.34 (1.42) 134 2.19 (1.34) −0.15 improved χ2(4, N = 692) = 3.40;
p = 0.49
I feel more isolated than usual 557 3.46 (1.36) 132 3.27 (1.33) −0.18 improved χ2(4, N = 689) = 4.17;
p = 0.38
Variableb
The lockdown restrictions are necessary 559 3.97 (1.21) 134 4.04 (1.21) 0.07 improved χ2(4, N = 693) = 0.99;
p = .91
I now know better what is really important in life 558 3.13 (1.19) 134 2.66 (1.12) −0.46 worsened χ2(4, N = 692) = 19.49;
p < .01
I have been communicating with relatives more often 558 2.90 (1.15) 134 2.63 (1.06) −0.28 worsened χ2(4, N = 692) = 8.78;
p = .07
I have a greater sense of appreciation for the 555 3.50 (1.18) 134 3.38 (1.06) −0.11 worsened χ2(4, N = 689) = 7.27;
healthcare workers p = .12
People have become more friendly towards 555 2.75 (1.06) 133 2.22 (0.85) −0.53 worsened χ2(4, N = 688) = 35.72;
other people in my area p < .01
I feel more connected to the members of 559 2.57 (1.11) 133 2.06 (0.99) −0.51 worsened χ2(4, N = 692) = 25.23;
my local community p < .01
Note: aAnswers to the question “Indicate how much you agree/disagree with the following statement “were given on 1 to 5 Likert scale (1 – Strongly disagree, 2 –
Slightly disagree, 3 – Neutral, 4 – Slightly agree, 5 – Strongly agree), lower score represents better outcome; bHigher score represents better outcome; cPearson’s
chi-square test
the first lockdown, 61% vs. 46% during the second 30–49) for measures forbidding physical contact with
lockdown) (Fig. 3A in Supplementary file 2). family members outside the same household and closure
Perceptions of the necessity of certain measures chan- of non-essential businesses. Women expressed more ap-
ged between the first and the second lockdown with re- proval for most of the measures compared to men, as
spect to wearing masks in public closed spaces which well as people living in Vienna compared to respondents
gained substantial support over time. While wearing from the remaining federal states. During the second
masks was rated as the most unnecessary measure dur- lockdown in November/December, closure of schools
ing the first lockdown, it was rated as the most essential and distance learning was distinctly less supported by fe-
one during the second lockdown; 41% of respondents males, compared to males.
seeing this measure as absolutely essential in March/
April, compared to 80% in November/December Compliance with public health measures
(Table 3). The lowest acceptance among study partici- In terms of complying with the imposed public health
pants during the second lockdown was associated with measures during both lockdowns, respondents complied
closure of schools and distance learning with only 22% the least with restrictions limiting contact with relatives
seeing this as an absolutely essential measure. During outside the same household (Table 4). While 63% fully
the first lockdown, regulations about physical contact complied with this measure during the first lockdown,
with family from different household was rated the least only half of the participants (50%) did the same during
essential. the second lockdown. At both points of data collection
Fig. 4A and Fig. 5A in Supplementary file 2 reflect age, respondents reported complying the most with wearing
gender and regional heterogeneity of respondents’ opin- a mask in indoor public spaces (91 and 95% in the first
ions during the two lockdowns (Fig. 4A in March/April, and second lockdown, respectively). Reduced compliance
Fig. 5A in November/December). While the support for with restrictions on leaving private living spaces was ob-
different measures during the first lockdown was simi- served during the second lockdown, with only 58% of
larly distributed among the age groups, there seemed to study respondents reporting full compliance with this
be more support from younger age groups (18–39 and measure as opposed to 83% who reported complyingŁaszewska et al. BMC Public Health (2021) 21:1502 Page 9 of 14
Table 3 Perceptions of the necessity of public health measures
On a scale of 1 to 10 (ranging from 1 ‘Completely unnecessary’ to 10 ‘Absolutely essential’) please indicate how necessary you think the following
lockdown restrictions were to contain the Covid-19?
Lockdown March/April Lockdown November/December
Completely Absolutely Completely Absolutely
unnecessarya essentiala unnecessarya essentiala
Commuting to and from work only when 8% 48% Restrictions on leaving private living space 16% 31%
absolutely necessary
Walks only with people living in the same 15% 32% Distance of one meter in public space for 6% 71%
household people from different households
Closure of all non-essential shops and 15% 37% Closure of all non-essential shops and 13% 38%
business premises business premises
Only necessary purchases e.g. groceries, 11% 47% School closings and distance learning 26% 22%
medication
No physical contact with family members 20% 27% Physical contact only with closest relatives or 14% 40%
outside the same household individual important caregivers
Mouth and nose protection in open 20% 41% Mouth and nose protection in open business 5% 80%
business premises and public transport premises and on public transport
Visits in nursing homes and hospitals once a 12% 34%
week
Switch to home office wherever possible 5% 63%
Note: The most essential measures as indicated by respondents are in bold, the least essential are in italics.
a
Answers related to the necessity of the introduced public health measures reported by the study participants on the 1-10 scale were re-coded to a 5-point scale:
1 – Completely unnecessary (answers 1, 2), 2 – Unnecessary (answers 3, 4), 3 – Neutral (answers 5, 6), 4 – Necessary (answers 7, 8), 5 – Absolutely essential
(answers 9, 10)
completely with commuting to and from work only education, leisure and community life were significantly
when absolutely necessary in March/April. more disrupted during the second wave of the survey.
With respect to differences in compliance by age, gen-
der and federal state, women and respondents from Discussion
Vienna reported an overall higher level of adher- The study offers a comprehensive insight into experi-
ence to all public health measures during both ences of the Covid-19 pandemic situation as well as per-
lockdowns, as compared to men and respondents ceptions and attitudes towards imposed public health
from other federal states, respectively. The youngest measures of the general population during the two lock-
age group (18–29) reported slightly lower compli- downs in Austria. More specifically, the study provides a
ance with meeting only people from the same snapshot of people’s opinions, concerns, personal experi-
household in the first lockdown and with physical ences and perceptions of and compliance with prevent-
distancing during the second lockdown, compared ive measures throughout the Covid-19 pandemic in
to older age groups (Fig. 6A and Fig. 7A in Supple- Austria during the two lockdowns in March/April and
mentary file 2). November/December 2020. Based on the collected data,
we can draw conclusions from the two confinement
The impact of Covid-19 on various aspects of life stages in the Covid-19 pandemic that can facilitate the
On average, respondents reported more disruptions in discussion around the design of future lockdown strat-
all areas of their lives during the second lockdown in egies and confinement policies.
November/December compared to the first lockdown in Our findings suggest that, compared to the first lock-
March/April (Table 5). In both waves of the study, the down in March/April, the time period during the second
most impact of the Covid-19 pandemic was reported in lockdown in November/December appeared to have sig-
association with leisure activities (mean of 6.4 on 1 to 10 nificantly more negative effects in terms of personal ex-
scale in March/April, and 7.5 in November/December, periences of attachment to the local community,
the higher score represents more disruptions) and com- appreciation of healthcare workers and people around,
munity life (mean of 6.2 in March/April and 7.3 in No- and feeling of understanding better what really matters
vember/December), while the lowest impact was given in life. It also caused more disruption to friendships,
to spirituality. The impacts on friendships, family life, leisure activities, and community and family lives.Łaszewska et al. BMC Public Health (2021) 21:1502 Page 10 of 14
Table 4 Compliance with the public health measures during lockdowns
On a scale of 1 to 10 (ranging from 1 ‘Not complying at all’ to 10 ‘Complying completely’) please indicate how much were you complying with the
following lockdown restrictions?
Lockdown March/April Lockdown November/December
Not complying Complying Not complying Complying
at alla completelya at alla completelya
Commuting to and from work only 5% 83% Restrictions on leaving private living space 8% 58%
when absolutely necessary
Walks only with people living in the 5% 73% Distance of one meter in public space for 3% 71%
same household people from different households
Only necessary purchases e.g. groceries, 4% 81% Switch to home office wherever possible 13% 67%
medication
No physical contact with family members 6% 63% Physical contact only with closest relatives 10% 50%
outside the same household or individual important caregivers
Mouth and nose protection in open 2% 91% Mouth and nose protection in open 1% 95%
business premises and public transport business premises and on public transport
Note: Measures with which respondents complied the most are in bold, the least – in italics.
a
Answers related to the complying with the lockdown restrictions reported by the study participants on the 1-10 scale were re-coded to a 5-point scale: 1 – Not
complying at all (answers 1, 2), 2 – Not always complying (answers 3, 4), 3 – Neutral (answers 5, 6), 4 – Complying most of the time (answers 7, 8), 5 – Complying
completely (answers 9, 10)
Furthermore, compliance with the government-imposed both lockdowns which can be explained by an increased
restrictions reduced between the two lockdowns, except police presence and fines for not wearing a mask.
for the use of masks and face coverings in indoor public In the second wave of the study, more respondents in-
spaces. For instance, we observed the reduction in com- dicated that the Covid-19 lockdown did not pose any
pliance with restrictions on leaving private dwellings threat to their livelihood/income as compared to the first
during the second lockdown. This result confirms the wave of data collection. This could be associated with
analysis of the mobile phone mobility data during the the characteristics of study participants who, in compari-
two lockdowns in Austria which showed that there was son to the general population in Austria, were more ed-
a clear change from lockdown to lockdown. While the ucated (54% in the study sample in the first wave of data
observed reduction in mobility across nine federal states collection and 63% in the second wave of data collection,
varied between − 57% and − 80% during the first lock- compared to 13% in the general population [37]). A re-
down in March/April, the reduction observed during the cent study from Austria showed that the negative effects
lockdown in November/December was lower and ranged of the Covid-19 pandemic were most notable in lower
from − 30% to − 50%, as compared to the weeks preced- socio-economic groups especially in the case of job loss,
ing the introduction of restrictions [39]. Moreover, the decrease in financial stability, and declining mental
perceived necessity and compliance with some of the health [40]. A smaller proportion of respondents felt
public health measures was different among age groups, more isolated since the beginning of the second lock-
gender and regions of Austria. For instance, our study down in November/December, when compared to the
found that the compliance with the Covid-19 lockdown first lockdown. This may be related to the slightly differ-
measures was lower among men compared to women. ent regulations during the second lockdown in Austria
These results are consistent with similar international which allowed for visitation of close relatives and im-
studies [35, 36]. portant caregivers as well as partners who do not live in
The findings on the high support with the mandatory the same household which was not officially allowed
face mask use in public spaces observed in our study is during the first lockdown.
in line with the findings of the Austrian Corona Panel Two-thirds (66%) of respondents in our study agreed
Project which also showed the highest support for this that the government provided sufficient information
public health measure. In our study, 80% of study partic- about the Covid-19 pandemic situation in March/April,
ipants saw this measure as absolutely essential during compared to nearly 68% of respondents of the Austrian
the second lockdown, compared to 72% participants of Corona Panel Project who reported in March that they
the Austrian Corona Panel Project during a comparable were very or somewhat satisfied with the work of the
time period [30]. The compliance to this measure was government. When compared to other countries, during
the highest of all presented measures in our study during a similar time period, 45 and 61% of study respondentsŁaszewska et al. BMC Public Health (2021) 21:1502 Page 11 of 14
Table 5 Impact of the Covid-19 pandemic on various aspects of life
On a scale of 1 to 10 indicate how much the Covid-19 has impacted on the following domains of your life (1 ‘No disruption at all, 10 ‘Serious
disruption’)
Lockdown March/April Lockdown November/December
Mean 1 ‘No disruption 10 ‘Serious Mean 1 ‘No disruption 10 ‘Serious Change
(SD) at all’ disruption’ (SD) at all’ disruption’ in meana
Impact on family life 3.80 36% 5% Impact on family life 4.70 19% 5% 0.90**
(2.90) (2.68)
Impact on marriage 3.39 45% 7% Impact on marriage 3.56 36% 8% 0.17
(2.99) (2.94)
Impact on parenting 2.93 56% 2% Impact on parenting 3.45 44% 3% 0.52
(2.66) (2.86)
Impact on friendships 5.28 18% 11% Impact on friendships 6.73 5% 12% 1.45***
(3.00) (2.45)
Impact on work 4.60 28% 11% Impact on work 5.09 21% 11% 0.49
(3.22) (3.06)
Impact on education 3.83 47% 9% Impact on education 4.94 28% 11% 1.11**
(3.29) (3.32)
Impact on leisure 6.43 13% 21% Impact on leisure 7.51 6% 30% 1.08***
(3.01) (2.54)
Impact on spirituality 2.84 59% 5% Impact on spirituality 3.19 53% 5% 0.35
(2.72) (2.82)
Impact on community 6.24 14% 20% Impact on community 7.27 9% 26% 1.03***
(3.08) (2.76)
Impact on physical self-care 3.38 44% 3% Impact on physical self-care 3.85 28% 6% 0.47
(diet, exercise, sleep) (2.81) (diet, exercise, sleep) (2.76)
Note: The areas impacted the least are in bold, the areas impacted the most are in italics.
a
Two-sample t test with unequal variances; *pŁaszewska et al. BMC Public Health (2021) 21:1502 Page 12 of 14
This should be taken into account when planning fur- Acknowledgements
ther school and childcare facility closures. As outlined We thank Dr. Ross White and Carine van der Boor from the Institute of
Population Health, University of Liverpool for the conceptualisation of a
by Power (2020), specific policies during the Covid-19 similar survey in the UK. We would also like to thank all the survey
pandemic should focus on support and protection for participants and the support of colleagues at the Department of Health
unpaid care-givers, including subsidies to replace pay for Economics for piloting the survey.
workers who are unable to work due to the closure of Authors’ contributions
schools and daycare facilities, expanding access to paid JS, TH and AŁ conceived the idea for the study, developed the conceptual
family leave and paid sick leave, and extending benefits framework, research methods and the survey. JS provided the resources to
this study. TH and AŁ executed the survey. AŁ conducted the current
to those resigning from employment to provide child analysis. AŁ wrote the manuscript which was reviewed by all. All authors
care due to the pandemic [undefined]. Thirdly, we ob- provided critical feedback and helped shape the research, analysis and
served that people felt that they did not receive sufficient manuscript. All authors approved the final manuscript.
information about the Covid-19 situation from the gov- Funding
ernment during the second lockdown, when compared The study received no funding.
to the first lockdown. This is concerning as this finding
might also indicate that also the trust in the information Availability of data and materials
The datasets generated during the current study and the study protocol
received from the government decreased as the pan- have been released in a scientific data repository and can be accessed
demic progressed. Studies indicate associations between through the link: https://zenodo.org/record/4598821.
the political trust and social distancing practices by
Declarations
members of the general population [46] and overall
compliance with restrictions during the Covid-19 pan- Ethics approval and consent to participate
demic [47]. Trust in official governmental media proved The study and experimental protocols were approved by the Ethics
Committee of the Medical University of Vienna on 26 May 2020 (EK Nr: 1529/
to be an independent predictor of protective behaviours 2020). Informed consent was obtained from all individual participants
in a study from China [48]. Since adherence to included in the study. All procedures performed in studies involving human
government-imposed restrictions by the general popula- participants were in accordance with the ethical standards of the Ethics
Commission of the Medical University of Vienna (EK 1529/2020) and with the
tion is key in containing Covid-19, the focus should be 1964 Helsinki declaration and its later amendments or comparable ethical
on restoring political trust of the general population. standards.
Some limitations of this study need to be considered.
Consent for publication
The study sample was collected via online adverts and Not applicable.
the responses may not be generalizable to the whole
Austrian population. The majority of the participants Competing interests
The authors declare that they have no conflict of interest.
were women, and there was an overrepresentation of the
age group 30 to 49 years and underrepresentation of the Received: 12 March 2021 Accepted: 1 July 2021
age group above 65 years [35] as well as overrepresenta-
tion of people with higher education [37], compared to
References
the general population. This is a common limitation ob- 1. Douglas M, Katikireddi SV, Taulbut M, McKee M, McCartney G. Mitigating the
served in online surveys. Previous research has shown wider health effects of covid-19 pandemic response. BMJ. 2020;369:m1557.
that younger age [49, 50] and higher education [50, 51] https://doi.org/10.1136/bmj.m1557.
2. Nussbaumer-Streit B, Mayr V, Dobrescu AI, Chapman A, Persad E, Klerings I,
predict higher willingness to participate in online sur- et al. Quarantine alone or in combination with other public health
veys. Furthermore, the presented analysis is mostly de- measures to control COVID-19: a rapid review. Cochrane Database Syst Rev.
scriptive and any tests of differences are conducted on 2020;4(4):CD013574. https://doi.org/10.1002/14651858.Cd013574.
3. Chandola T, Kumari M, Booker CL, Benzeval M. The mental health impact of
unadjusted data. However, since the survey in the sec- COVID-19 and lockdown-related stressors among adults in the UK. Psychol
ond wave of the study was conducted on a sub-group of Med. 2020:1–10. https://doi.org/10.1017/S0033291720005048.
participants from the first wave, and there were no sig- 4. Benke C, Autenrieth LK, Asselmann E, Pané-Farré CA. Lockdown, quarantine
measures, and social distancing: associations with depression, anxiety and
nificant differences between the two groups in terms of distress at the beginning of the COVID-19 pandemic among adults from
participant characteristics, the presented results outlin- Germany. Psychiatry Res. 2020;293:113462. https://doi.org/10.1016/j.
ing differences observed between the two lockdowns are psychres.2020.113462.
5. Pieh C, Budimir S, Delgadillo J, Barkham M, Fontaine JRJ, Probst T. Mental
robust for this sample. health during COVID-19 lockdown in the United Kingdom. Psychosom Med.
2020;83(4):328–37. https://doi.org/10.1097/psy.0000000000000871.
Supplementary Information 6. Niedzwiedz CL, Green MJ, Benzeval M, Campbell D, Craig P, Demou E, et al.
The online version contains supplementary material available at https://doi. Mental health and health behaviours before and during the initial phase of
org/10.1186/s12889-021-11476-3. the COVID-19 lockdown: longitudinal analyses of the UK household
longitudinal study. J Epidemiol Community Health. 2020;75(3):224–31.
https://doi.org/10.1136/jech-2020-215060.
Additional file 1. 7. Prajapati N, Łaszewska A, Franco D, Ericson R, Leroy A, Lindert J, et al. What
Additional file 2. are the COVID-19 lockdown-induced illnesses and why should European
public health systems be investigating their epidemiology, treatment, andŁaszewska et al. BMC Public Health (2021) 21:1502 Page 13 of 14
prevention? Report to ASPHER COVID-19 task group. The Association of 28. Probst T, Budimir S, Pieh C. Depression in and after COVID-19 lockdown in
Schools of Public Health in the European Region (ASPHER) 2020. https:// Austria and the role of stress and loneliness in lockdown: a longitudinal
www.aspher.org/download/531/aspher-lockdown-induced-illnesses.pdf. study. J Affect Disord. 2020;277:962–3. https://doi.org/10.1016/j.jad.2020.09.
Accessed 7 Feb 2021. 047.
8. European Commission. Jobs and economy during the coronavirus 29. Kittel B, Kritzinger S, Boomgaarden H, Prainsack B, Eberl J-M, Kalleitner F,
pandemic. https://ec.europa.eu/info/live-work-travel-eu/health/coronavirus- et al. The Austrian Corona panel project: monitoring individual and societal
response/jobs-and-economy-during-coronavirus-pandemic_en. Accessed 13 dynamics amidst the COVID-19 crisis. Eur Polit Sci. 2020;20(2):318–44.
Feb 2021. https://doi.org/10.1057/s41304-020-00294-7.
9. Ioannidis JPA. Coronavirus disease 2019: The harms of exaggerated 30. Kalleitner F, Schiestl DW. Einkommenseinbußen in der Frühphase der
information and non-evidence-based measures. Eur J Clin Invest. 2020;50(4): Corona-Krise. Austrian Corona Panel Project. Corona-Blog. https://viecer.
e13222-e. https://doi.org/10.1111/eci.13222 univie.ac.at/corona-blog/corona-blog-beitraege/blog07/. Accessed 17 June
10. Ioannidis JPA, Cripps S, Tanner MA. Forecasting for COVID-19 has failed. Int J 2021.
Forecast. 2020. https://doi.org/10.1016/j.ijforecast.2020.08.004. 31. Resch T. Veränderungen der Haushaltseinkommen in der Corona-Krise: Wer
11. Brooks SK, Webster RK, Smith LE, Woodland L, Wessely S, Greenberg N, et al. ist betroffen? Austrian Corona Panel Project. Corona-Blog. https://viecer.
The psychological impact of quarantine and how to reduce it: rapid review univie.ac.at/corona-blog/corona-blog-beitraege/blog80/. Accessed 17 June
of the evidence. Lancet. 2020;395(10227):912–20. https://doi.org/10.1016/ 2021.
S0140-6736(20)30460-8. 32. Kowarz N, Pollak M. Wer vertraut dem Staat? Institutionenvertrauen in
12. Schippers MC. For the greater good? The devastating ripple effects of the Zeiten von Corona. Austrian Corona Panel Project. Corona-Blog. https://
Covid-19 crisis. Front Psychol. 2020;11:577740. https://doi.org/10.3389/ viecer.univie.ac.at/corona-blog/corona-blog-beitraege/blog70/. Accessed 17
fpsyg.2020.577740. June 2021.
13. Bavli I, Sutton B, Galea S. Harms of public health interventions against covid- 33. Schiestl DW. Tabak- und Alkoholkonsum in der Corona-Krise. Austrian
19 must not be ignored. BMJ. 2020;371:m4074. https://doi.org/10.1136/bmj. Corona Panel Project. Corona-Blog. https://viecer.univie.ac.at/coronapanel/
m4074. corona-blog/corona-blog-beitraege/blog14/. Accessed 17 Jun 2021.
14. Lytras T, Tsiodras S. Lockdowns and the COVID-19 pandemic: what is the 34. Leiner D. SoSci Survey (Version 3.1.06). https://www.soscisurvey.de. Accessed
endgame? Scand J Public Health. 2021;49(1):37–40. https://doi.org/10.11 17 June 2021.
77/1403494820961293. 35. Statistik Austria. Bevölkerung am 1.1.2019 nach Alter und Bundesland. 2019.
15. Sabat I, Neuman-Böhme S, Varghese NE, Barros PP, Brouwer W, van Exel J, http://www.statistik.at/web_de/statistiken/menschen_und_gesellschaft/
et al. United but divided: policy responses and people’s perceptions in the bevoelkerung/bevoelkerungsstruktur/bevoelkerung_nach_alter_geschlecht/
EU during the COVID-19 outbreak. Health Policy. 2020;124(9):909–18. https:// 023470.html. Accessed 9 Mar 2021.
doi.org/10.1016/j.healthpol.2020.06.009. 36. Statistik Austria. Bevölkerung 2017 nach detaillierter Staatsangehörigkeit,
16. Simon J. COVID-19 in Austria. November 2020 ASPHER newsletter. The Geschlecht und Bundesland. 2017. http://www.statistik.at/web_de/sta
Association of Schools of Public Health in the European Region (ASPHER). tistiken/menschen_und_gesellschaft/bevoelkerung/volkszaehlungen_
2020. https://www.aspher.org/download/527/aspher-newsletter-november-2 registerzaehlungen_abgestimmte_erwerbsstatistik/bevoelkerung_nach_
020.pdf. Accessed 3 Mar 2021. demographischen_merkmalen/index.html. Accessed 17 June 2021.
17. University of Oxford. Oxford COVID-19 Government Response Tracker. 37. Statistik Austria. Bildungsstand der Bevölkerung ab 15 Jahren 2017 nach
https://covidtracker.bsg.ox.ac.uk/. Accessed 15 Feb 2021. Altersgruppen und Geschlecht. 2017. http://www.statistik.at/web_de/sta
18. Kreidl P, Schmid D, Maritschnik S, Richter L, Borena W, Genger JW, et al. tistiken/menschen_und_gesellschaft/bildung/bildungsstand_der_
Emergence of coronavirus disease 2019 (COVID-19) in Austria. Wien Klin bevoelkerung/121189.html. Accessed 17 June 2021.
Wochenschr. 2020;132(21):645–52. https://doi.org/10.1007/s00508-020-01723-9. 38. Statistik Austria. Austria: Data. Figures Facts. 2021. http://www.statistik.at/
19. AGES. AGES COVID19 Dashboard. https://covid19-dashboard.ages.at/. wcm/idc/idcplg?IdcService=GET_NATIVE_FILE&dDocName=029252.
Accessed 7 Feb 2021. Accessed 17 June 2021.
20. Nagel A, Łaszewska A, Haidinger G, Simon J. The first 8 weeks of the 39. Klimek P, Heiler G. Von Lockdown zu Lockdown: Über die Entwicklung der
Austrian SARS-CoV-2 epidemic. Wien Klin Wochenschr. 2021;133(7-8):1–13. Mobilitätssreduktion in Österreichs Bundesländern. CSH Policy Brief,. 2021.
https://doi.org/10.1007/s00508-020-01804-9. https://www.csh.ac.at/wp-content/uploads/2021/01/2021-01-25-CSH-Policy-
21. BSGPK. COVID-19-Notmaßnahmenverordnung – COVID-19-NotMV. Gesundheit, Brief-BewegungsradiusUpdate.pdf. Accessed 10 Mar 2021.
Pflege und Konsumentenschutz: Bundesgesetzblatt für die Republic Österreich. 40. Oberndorfer M, Dorner T, Brunnmayr M, Berger K, Dugandzic B, Bach M.
Bundesministerium für Soziales; 2020. https://www.ris.bka.gv.at/Dokumente/ Equally affected? Health-related and socioeconomic adversities of the
BgblAuth/BGBLA_2020_II_479/BGBLA_2020_II_479.pdfsig. COVID-19 pandemic in Vienna (preprint). SSRN. 2020. https://doi.org/10.213
22. Stolz E, Mayerl H, Freidl W. The impact of COVID-19 restriction measures on 9/ssrn.3733369.
loneliness among older adults in Austria. Eur J Pub Health. 2020;31(1):44–9. 41. Helsingen LM, Refsum E, Gjøstein DK, Løberg M, Bretthauer M, Kalager M,
https://doi.org/10.1093/eurpub/ckaa238. et al. The COVID-19 pandemic in Norway and Sweden – threats, trust, and
23. Akkaya-Kalayci T, Kothgassner OD, Wenzel T, Goreis A, Chen A, Ceri V, et al. impact on daily life: a comparative survey. BMC Public Health. 2020;20(1):
The Impact of the COVID-19 Pandemic on Mental Health and Psychological 1597. https://doi.org/10.1186/s12889-020-09615-3.
Well-Being of Young People Living in Austria and Turkey: A Multicenter 42. Kowarz N, Kritzinger S. Nach 8 Monaten Corona-Krise: Wie sieht die Bilanz der
Study. Int J Environ Res Public Health. 2020;17(23). https://doi.org/10.3390/ Bundesregierung aus? Austrian Corona Panel Project. Corona-Blog. https://
ijerph17239111 viecer.univie.ac.at/corona-blog/corona-blog-beitraege/corona-dynamiken16/.
24. Pieh C, Budimir S, Probst T. The effect of age, gender, income, work, and 43. Lebernegg N, Kalleitner F. Stetiger Rückgang der positiven Einschätzungen
physical activity on mental health during coronavirus disease (COVID-19) über die Entwicklung des Zusammenhaltes in der Krise. Austrian Corona
lockdown in Austria. J Psychosom Res. 2020;136:110186. https://doi.org/10.1 Panel Project Corona-Blog. https://viecer.univie.ac.at/corona-blog/corona-
016/j.jpsychores.2020.110186. blog-beitraege/corona-dynamiken8/.
25. Traunmüller C, Stefitz R, Gaisbachgrabner K, Schwerdtfeger A. 44. Kim JK, Crimmins EM. How does age affect personal and social reactions to
Psychological correlates of COVID-19 pandemic in the Austrian COVID-19: results from the national understanding America study. PLoS
population. BMC Public Health. 2020;20(1):1395. https://doi.org/10.1186/ One. 2020;15(11):e0241950. https://doi.org/10.1371/journal.pone.0241950.
s12889-020-09489-5. undefined
Power K. The COVID-19 pandemic has increased the care burden of
26. Simon J, Helter TM, White RG, van der Boor C, Łaszewska A. Impacts of the women and families. Sustainability: Science, Practice and Policy. 2020;
Covid-19 lockdown and relevant vulnerabilities on capability well-being, 16(1):67–73. https://doi.org/10.1080/15487733.2020.1776561 .
mental health and social support: an Austrian survey study. BMC Public 46. Woelfert FS, Kunst JR. How Political and Social Trust Can Impact Social
Health. 2021;21(1):314. https://doi.org/10.1186/s12889-021-10351-5. Distancing Practices During COVID-19 in Unexpected Ways. Front Psychol.
27. Schnitzer M, Schöttl SE, Kopp M, Barth M. COVID-19 stay-at-home order in 2020;11:572966. https://doi.org/10.3389/fpsyg.2020.572966
Tyrol, Austria: sports and exercise behaviour in change? Public Health. 2020; 47. Chan HF, Brumpton M, Macintyre A, Arapoc J, Savage DA, Skali A, et al. How
185:218–20. https://doi.org/10.1016/j.puhe.2020.06.042. confidence in health care systems affects mobility and compliance duringŁaszewska et al. BMC Public Health (2021) 21:1502 Page 14 of 14
the COVID-19 pandemic. PLoS One. 2020;15(10):e0240644. https://doi.org/1
0.1371/journal.pone.0240644.
48. Ning L, Niu J, Bi X, Yang C, Liu Z, Wu Q, et al. The impacts of
knowledge, risk perception, emotion and information on citizens’
protective behaviors during the outbreak of COVID-19: a cross-sectional
study in China. BMC Public Health. 2020;20(1):1751. https://doi.org/10.11
86/s12889-020-09892-y.
49. Yetter G, Capaccioli K. Differences in responses to web and paper surveys
among school professionals. Behav Res Methods. 2010;42(1):266–72. https://
doi.org/10.3758/BRM.42.1.266.
50. Mulder J. dBM. Willingness of Online Respondents to Participate in
Alternative Modes of Data Collection. Survey Practice. 2019;12(1). https://doi.
org/10.29115/SP-2019-0001.
51. Fitzgerald D, Hockey R, Jones M, Mishra G, Waller M, Dobson A. Use of
online or paper surveys by Australian women: longitudinal study of users,
devices, and cohort retention. J Med Internet Res. 2019;21(3):e10672. https://
doi.org/10.2196/10672.
Publisher’s Note
Springer Nature remains neutral with regard to jurisdictional claims in
published maps and institutional affiliations.You can also read