The shifting contours of the Asia-Pacific disaster riskscape
←
→
Page content transcription
If your browser does not render page correctly, please read the page content below
CHAPTER 1

The shifting contours of
the Asia-Pacific disaster
riskscape

              1
ASIA-PACIFIC DISASTER REPORT 2021

O
          ver the past two decades, countries in Asia and the Pacific have made significant
          progress in achieving the Sustainable Development Goals related to disaster risk
          reduction (Goal 1, Goal 9, Goal 11), and to promoting good health and well-being
(Goal 3).1 But most are still ill-prepared for complex overlapping crises. The simultaneous
impacts of various hazards presents a riskscape that is expanding, and in particular,
when biological risks are combined with those from other natural hazards, such as
cyclones, earthquakes or drought. This was harshly demonstrated by the global spread
of the COVID-19 pandemic, which presented an additional biological shock of a scale
not experienced in a century. The world experienced deep consequences for health and
survival, and national economies and societies suffered. Adding biological risks into loss
calculations has increased current annual average losses from disasters to $780 billion.
The pandemic, combined with the persistent reality of climate change, is thus reshaping
and expanding the Asia-Pacific disaster riskscape. The region has regressed on the
critical goal of climate action (Goal 13),2 and the emerging disaster-climate-health nexus
demands a much more systemic approach to disaster risk reduction.

Since 1970, Asia and the Pacific has accounted for 57 per cent of global fatalities from disasters and
87 per cent of the global population that has been affected by natural hazards (Figure 1-1). Between 1970
and 2020, natural hazards in Asia and the Pacific affected 6.9 billion people and killed more than 2 million,
that is 41,373 lives per year, one life every 13 minutes.3 Nevertheless, there has been substantial progress:
from 2011 to 2020, the average loss of life per year fell to 10,936 lives, and in 2019 and 2020, the average
annual loss fell to around 6,200 lives (Figure 1-2).

FIGURE 1-1   Number of fatalities and people affected in the Asia-Pacific region and the
rest of the world, 1970–2020

    NUMBER OF FATALITIES                                                            NUMBER OF PEOPLE AFFECTED

    Asia-Pacific region                                                              Asia-Pacific region

    Rest of the world                                                               Rest of the world

                           0.0      0.5      1.0       1.5      2.0       2.5                            0.0 1.0 2.0 3.0 4.0 5.0 6.0 7.0 8.0
                            NUMBER OF PEOPLE, MILLIONS                                                     NUMBER OF PEOPLE, BILLIONS

       Floods              Storms            Earthquakes               Drought              Other

Source: Data from EM-DAT – The International Disaster Database. Available at https://www.emdat.be/ (accessed on 4 May 2021).

1     Asia and the Pacific SDG Progress Report 2021 (United Nations publication, 2021a). Available at https://www.unescap.org/sites/default/d8files/
      knowledge-products/ESCAP_Asia_and_the_Pacific_SDG_Progress_Report_2021.pdf
2     Ibid.
3     EM-DAT – The International Disaster Database. Available at https://www.emdat.be

                                                                                2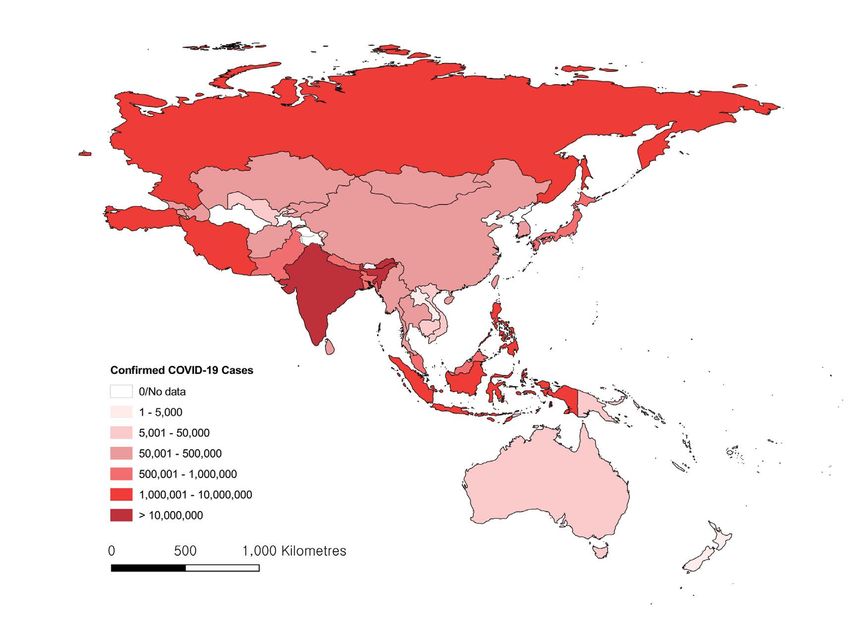
Chapter 1: The shifting contours of the Asia-Pacific disaster riskscape

FIGURE 1-2                                    Number of fatalities and people affected in the Asia-Pacific region,
1970–2020
                  NUMBER OF FATALITIES, ANNUAL AVERAGE                                                                             NUMBER OF PEOPLE AFFECTED, ANNUAL AVERAGE

                                       30                                                                                                    15

                                       25
NUMBER OF PEOPLE, THOUSANDS

                                                                                                                                             12

                                                                                                           NUMBER OF PEOPLE, MILLIONS
                                       20
                                                                                                                                             90
                                       15
                                                                                                                                             60
                                       10

                                         5                                                                                                   30

                                         0                                                                                                     0
                                                   1970–2010                 2011–2020                                                                  1970–2010              2011–2020

                                 Biological            Geophysical              Hydro-meteorological

Source: Data from EM-DAT – The International Disaster Database. Available at https://www.emdat.be/ (accessed on 4 May 2021).

This is heartening progress, and a testament to the efforts that governments and communities have
been dedicated to protecting human life. Indeed, disasters inevitably continue to affect the region but
the efforts to preserve life have clearly borne fruit. Despite the continued onslaught of natural calamities,
countries have learned important lessons and strengthened their resilience, anticipating where a disaster
might strike and creating early warning systems that protect lives, livelihoods, and economies.

Nevertheless, while the fatality rates are lower, the average yearly number of people affected has fallen
only slightly; from 139 million people between 1970 and 2010 to 122 million people between 2011 and
2020, with Asia and the Pacific accounting for around three-quarters of the world’s population that was
affected by disasters. Almost all of those affected were victims of water-related disasters, such as floods,
droughts and storms.4

Disasters frequently drive people away from their homes. In 2019 alone, over 19 million people were
displaced by natural hazards in Asia and the Pacific, which accounted for around three-quarters of
the global total. Indeed, the Asia-Pacific region had the four largest numbers of people displaced that
year: India, 5.1 million people; Philippines, 4.1 million people; Bangladesh, 4.1 million people; and China,
4 million people.5

Among the ESCAP subregions, fatalities from 2011 to 2020 were greatest in South and South-West Asia
(44 per cent), followed by East and North-East Asia (29 per cent), and South-East Asia (25 per cent)
(Figure 1-3). The numbers are inevitably low in the Pacific because of small population sizes. Nevertheless,
people in the Pacific are acutely vulnerable to disasters, which is clear from the number of deaths
calculated as a proportion of the population. From this perspective, the Pacific experienced a fatality rate
of 2.6 people per million, second only to the South-East Asia region which was at 4.3 people per million.

Disasters also caused huge economic damage (Figure 1-4). Between 1990 and 2018, the average annual
damage across the region was 0.34 per cent of gross domestic product (GDP), which was significantly
higher than the global average of 0.22 per cent. Among the subregions, the worst affected were South and
South-West Asia, followed by East and North-East Asia. While the Asia-Pacific region is regularly exposed
to geophysical hazards, such as earthquakes and tsunamis, the greatest damage, both human and
economic, tends to be caused by hydro-meteorological hazards, especially floods, droughts, hurricanes
and tornadoes.

4                             Ibid.
5                             Internal displacement monitoring centre, “Global Report on Internal Displacement, 2020”. Available at https://www.internal-displacement.org/sites/
                              default/files/publications/documents/2020-IDMC-GRID.pdf

                                                                                                       3
ASIA-PACIFIC DISASTER REPORT 2021
FIGURE 1-3 Number of fatalities and people affected in ESCAP subregions, 2011–2020
FATALITIES AFFECTED
0.7 0.9 0.1 0.5
14.9
24.8 29.2
34.9
PERCENTAGE
PERCENTAGE
OF POPULATION
OF FATALITIES
AFFECTED
44.4 49.6
5 3.5 3.2
4.3
PERCENTAGE OF TOTAL POPULATION
3.0 2.9
NUMBER OF FATALITIES PER YEAR
4 2.6
2.5
PER MILLION POPULATION
3 2.6 2.0
2.5
AFFECTED PER YEAR
2.0 1.5 1.4
2
1.0
1
0.3 0.5
0.0
0 0.0
East and North-East Asia South and South-West Asia South-East Asia North and Central Asia Pacific
Source: Data from EM-DAT – The International Disaster Database. Available at https://www.emdat.be/ (accessed on 4 May 2021).
The following sections track the contours of the Asia-Pacific riskscape as it has been reshaped by climate
change. The years 2015 to 2019 were reported as the warmest five-year period on record being 0.2°C
warmer than the previous five-year period. This affected both extreme weather events, such as cyclones,
and slow-onset disasters, such as droughts, while also accelerating the rise in sea levels.6
FIGURE 1-4 Average annual damage as a percentage of GDP, 1980–2018
0.5
0.4
ESCAP AVERAGE
0.3%
0.3
REST OF THE WORLD
0.2%
0.2
PERCENTAGE
0.1
0.0
East and North and Pacific South-East South and
North-East Asia Central Asia Asia South-West Asia
Geophysical Hydro-meteorological hazards
Source: Damage data (from 1990 to 2018) from EM-DAT – The International Disaster Database. Available at https://www.emdat.be/ and GDP data from United
Nations, Economic and Social Commission of Asia and the Pacific (ESCAP), Statistical Database. Available at https://www.unescap.org/stat/data
6 World Meteorological Organization (WMO), “The Global Climate in 2015–2019”, WMO Statements on Climate, (Geneva, 2019a). Available at https://library.
wmo.int/doc_num.php?explnum_id=9936
4Chapter 1: The shifting contours of the Asia-Pacific disaster riskscape
Tropical cyclones
Climate change appears to be affecting the intensity of tropical cyclones and related rainfall, though it
does not appear to be influencing the number of events.7 In the Western North Pacific and between 1978
and 2018, the strongest cyclones, which have a maximum surface wind speed of 100 knots or more, seem
to have been getting stronger, while the weaker cyclones of 50 knots or less have become somewhat
weaker (Figure 1-5).
FIGURE 1-5 Wind speeds of tropical cyclones in the Western North Pacific, 1978–2018
TROPICAL CYCLONES WITH MAX SURFACE WIND OF 100 KTS OR MORE TROPICAL CYCLONES WITH MAX SURFACE WIND OF 50 KTS OR LESS
170
160
150 50
45
140
40
130
35
WIND SPEED, KNOTS
WIND SPEED, KNOTS
120
30
110
25
100 20
1978 1983 1988 1993 1998 2003 2008 2013 2018 1978 1983 1988 1993 1998 2003 2008 2013 2018
Source: Data from Joint Typhoon Warning Center (JTWC), Annual Tropical Cyclone Reports.
A more positive trend is that there has been a decline in the number of fatalities (Figure 1-6). In the 1990s
and 2000s, countries in South and South-West Asia and South-East Asia experienced huge losses of life,
but over the past decade the number of fatalities has fallen dramatically. There has also been a decline,
though smaller, in the number of people affected, which was 206 million for the period 2011 to 2020.
FIGURE 1-6 Number of fatalities and people affected by tropical cyclones in Asia
and the Pacific, 1991–2020
NUMBER OF FATALITIES NUMBER OF PEOPLE AFFECTED
200 250
NUMBER OF PEOPLE, THOUSANDS
200
150
NUMBER OF PEOPLE, MILLIONS
150
100
100
50
50
0 0
1991–2000 2001–2010 2011–2020 1991–2000 2001–2010 2011–2020
East and North-East Asia South and South-West Asia South-East Asia North and Central Asia Pacific
Source: Data from EM-DAT – The International Disaster Database. Available at https://www.emdat.be/ (accessed on 4 May 2021).
7 Intergovernmental Panel on Climate Change (IPCC), “Managing the risks of extreme events and disasters to advance climate change adaptation”, (New
York, Cambridge University Press, 2012). Available at https://archive.ipcc.ch/pdf/special-reports/srex/SREX_Full_Report.pdf
5ASIA-PACIFIC DISASTER REPORT 2021
Droughts
Climate change is likely to alter the distribution of renewable water resources, reducing them most in
dry subtropical regions, while increasing them at higher latitudes.8 In Asia and the Pacific, this is likely to
increase the occurrence and intensity of droughts, especially in drylands.9 South-East Asia, in particular,
will be affected as the combination of varying rainfall and higher temperatures could lead to severe
droughts.10
Climate change projections from the Intergovernmental Panel on Climate Change (IPCC) are based on
a series of scenarios using ‘representative concentration pathways’ (RCPs).11 The business-as-usual, worst-
case scenario is ‘RCP 8.5’ which would deliver global warming at an average of 8.5 watts per square metre
across the planet and, compared with pre-industrial temperatures, an increase of about 4.3˚C, by 2100.
Figure 1-7 illustrates the projected maximum number of consecutive dry days for 2040 to 2059 under
RCP 8.5. It projects an increase in most of the low- and mid-latitude areas of the Asia-Pacific region. This is
especially alarming for countries in South and South-West Asia, South-East Asia, and Australia.
FIGURE 1-7 Number of consecutive dry days – projected change RCP 8.5, 2040–2059
N
! !
! ! ! !
!
! ! ! ! ! !
!!
!
!!
!!
!
!
Projected change 2040–2059 in
spatial variation for maximum
number of consecutive dry days
under RCP 8.5
0/No data
0–1.83
1.84–3.66
3.67–10.98
10.99–18.30
18.31–92.95
KILOMETRES
0 2 000 4 000
Source: Climate Change Knowledge Portal, 2018.
Note: Projected change 2040-2059 in Spatial Variation for Maximum Number of Consecutive Dry Days under RCP 8.5 ranges from 0 to maximum
number of days.
Disclaimer: The boundaries and names shown and the designations used on this map do not imply official endorsement or acceptance by the United Nations.
Dotted line represents approximately the Line of Control in Jammu and Kashmir agreed upon by India and Pakistan. The final status of Jammu
and Kashmir has not yet been agreed upon by the parties.
8 Rajendra K. Pachauri and Leo Meyer, eds., “Climate Change 2014, Synthesis Report”, Intergovernmental Panel on Climate Change (Geneva, 2014). Available
at https://www.ipcc.ch/site/assets/uploads/2018/02/SYR_AR5_FINAL_full.pdf
9 Food and Agriculture Organization, Proactive approaches to drought preparedness – Where are we now and where do we go from here? (Rome, 2019).
10 Ready for the dry years: Building resilience to drought in South-East Asia: With a focus on Cambodia, Lao People’s Democratic Republic, Myanmar and Viet
Nam, 2020 Update (United Nations publication, 2020d). Available at https://www.unescap.org/sites/default/files/publications/Ready%20for%20the%20
Dry%20Years.pdf
11 RCPs specify concentrations of greenhouse gases that will result in total radiative forcing increasing by a target amount by 2100, relative to pre-industrial
levels. Total radiative forcing is the difference between the incoming and outgoing radiation at the top of the atmosphere.
6Chapter 1: The shifting contours of the Asia-Pacific disaster riskscape
Floods
In recent decades, floods seem to be having less impact in terms of fatalities and the number of people
affected (Figure 1-8). In the 1990s, floods killed 55,000 people, but that number fell to 39,000 in the 2000s.
Moreover, the number of people affected, in the same period, fell by more than half. However, this
decrease was mostly seen in East and North-East Asia. In South and South-West Asia and South-East Asia
the impacts remained similar.
FIGURE 1-8 Number of fatalities and people affected by floods, 1991–2020
NUMBER OF FATALITIES NUMBER OF PEOPLE AFFECTED
60 1 500
50
NUMBER OF PEOPLE, THOUSANDS
1 200
NUMBER OF PEOPLE, MILLIONS
40
900
30
600
20
10 300
0 0
1991–2000 2001–2010 2011–2020 1991–2000 2001–2010 2011–2020
East and North-East Asia South and South-West Asia South-East Asia North and Central Asia Pacific
Source: Data from EM-DAT – The International Disaster Database. Available at https://www.emdat.be/ (accessed on 4 May 2021).
The risks are greater in lower-latitude regions. This can be assessed by the ‘return period’, which is the
frequency with which the maximum cumulative precipitation over five consecutive days is likely to return
during a ten-year period. Figure 1-9 shows the ten-year return period for the period 2040–2059 under RCP
8.5. More precipitation does not necessarily lead to more floods, but the risks can increase, especially in
flood-prone countries, such as Bangladesh and India, in coastal areas in South-East Asia and in the Pacific
small island developing States.
Extreme temperatures
Countries in the Asia-Pacific region also experience extreme temperatures, often in the form of heatwaves.
Between 1998 and 2017, heatwaves caused almost 166,000 deaths.12 Between 2000 and 2016, the number
of people exposed increased by around 125 million, while the heatwaves lasted longer.13
• 2015 – There were more than 55,000 fatalities in the Russian Federation, 2,200 in India and 1,200 in
Pakistan.14
• 2018 – There was a heatwave emergency in the Democratic People’s Republic of Korea, with
temperatures as high as 40˚C recorded across the country.15
• 2020 – Exceptionally high temperatures were recorded in eastern Australia, Hong Kong, China, Japan,
New Zealand and the Russian Federation.16
12 World Health Organization, Heatwaves. https://www.who.int/health-topics/heatwaves#tab=tab_1 (accessed on 22 July 2021).
13 World Health Organization, “Heat and Health: Key Facts”, 1 June 2018. Available at https://www.who.int/news-room/fact-sheets/detail/climate-change-
heat-and-health (accessed on 22 July 2021).
14 EM-DAT – The International Disaster Database. Available at https://www.emdat.be
15 International Federation of Red Cross and Red Crescent Societies, “Emergency Plan of Action Final Report: DPR Korea: Heat Wave”, 28 July 2019. Available
at https://reliefweb.int/sites/reliefweb.int/files/resources/MDRKP010dfr.pdf
16 World Meteorological Organization, “State of the Global Climate 2020: Unpacking the indicators”, provisional report, 20 April 2021. Available at https://
library.wmo.int/doc_num.php?explnum_id=10444
7ASIA-PACIFIC DISASTER REPORT 2021
FIGURE 1-9 Maximum five-day cumulative precipitation amount projected to return in
a ten-year period, RCP 8.5, 2040–2059
N
! !
! ! ! !
! ! ! ! ! !
!
!
!
!
!
!
!
!
Projected change 2040–2059 in
spatial variation for the 10-year return
level of the maximum 5-day cumulative
precipitation under RCP 8.5
0/No data
11.00–14.87
14.88–18.73
18.74–27.25
27.26–35.77
35.78–135.72
KILOMETRES
0 2 000 4 000
Source: Climate Change Knowledge Portal, 2018
Note: Projected Change 2040–2059 in Spatial Variation for 10 year return level of the maximum 5-day cumulative precipitation under RCP 8.5 ranges
from 11mm to maximum precipitation.
Disclaimer: The boundaries and names shown and the designations used on this map do not imply official endorsement or acceptance by the United Nations.
Dotted line represents approximately the Line of Control in Jammu and Kashmir agreed upon by India and Pakistan. The final status of Jammu
and Kashmir has not yet been agreed upon by the parties.
FIGURE 1-10 Projected change in number of days with temperature over 25˚C, RCP 8.5,
2040–2059
N
!
! ! ! !
!! ! ! ! !
!
!
! !
! !
!
!
!
Projected change 2040–2059
in spatial variation for number
of summer days with
maximum temperature more
than 25°C under RCP 8.5
0/No data
14.32–26.86
26.87–28.84
28.85–41.01
41.02–53.18
53.19–164.12
KILOMETRES
0 2 000 4 000
Source: Climate Change Knowledge Portal, 2018
Note: Projected Change 2040-2059 in Spatial Variation for Number of Summer Days with Maximum Temperature More than 25°C under RCP 8.5
ranges from 14 days to maximum number of days.
Disclaimer: The boundaries and names shown and the designations used on this map do not imply official endorsement or acceptance by the United Nations.
Dotted line represents approximately the Line of Control in Jammu and Kashmir agreed upon by India and Pakistan. The final status of Jammu
and Kashmir has not yet been agreed upon by the parties.
8Chapter 1: The shifting contours of the Asia-Pacific disaster riskscape
The risk of heatwaves is likely to increase, which FIGURE 1-11 Confirmed dengue cases,
will also have substantial impacts on various 1990–2018
sectors including agriculture, health and water
ASIA-PACIFIC REGION
management. Under RCP 8.5, the number of
summer days with a maximum temperature 1 000
more than 25˚C is projected to increase in many
areas, especially those in subtropical regions 800
NUMBER OF PEOPLE, THOUSANDS
(Figure 1-10).
600
In other countries in the Asia-Pacific region,
400
extremely low temperatures have also been
recorded. In 2008, severe winter conditions cost 200
over 1,300 lives in Afghanistan, and affected
77 million people in China. From 2016 to 2019, 0
Mongolia suffered from ‘dzud’, which are severe 1990 1994 1998 2002 2006 2010 2014 2018
winters that killed large numbers of livestock.17
SOUTH-EAST ASIA
Climate change 1 000
threatens health 800
NUMBER OF PEOPLE, THOUSANDS
600
Recent decades have seen an increase in the
risk of climate-related diseases leading to illness 400
and death.18 For vector-borne diseases, such as
malaria and dengue, rising temperatures can 200
reduce the incubation period for mosquitos
and facilitate the transmission of the disease.19 0
1990 1994 1998 2002 2006 2010 2014 2018
Between the 1990s and 2010s, the average
number of dengue cases per year increased from SOUTH AND SOUTH-WEST ASIA
200,000 to over 500,000. Between 1990 and 2018,
there were particularly rapid increases in South 1 000
and South-West Asia and in South-East Asia
800
(Figure 1-11).
NUMBER OF PEOPLE, THOUSANDS
600
In 2019, several countries in these subregions
again reported dengue outbreaks (Table 1-1). 20 400
200
0
1990 1994 1998 2002 2006 2010 2014 2018
Source: World Health Organization, Dengue data application. Available at
https://ntdhq.shinyapps.io/dengue5/ (accessed on 6 February 2021).
17 EM-DAT – The International Disaster Database. Available at https://www.emdat.be
18 World Meteorological Organization and others, “United in Science: High-level synthesis report of latest climate science information convened by the
Science Advisory Group of the UN Climate Action Summit 2019”, 2019b. Available at https://reliefweb.int/sites/reliefweb.int/files/resources/climsci.pdf
19 World Health Organization, “Climate change and human health - risks and responses”, technical report, 4 December 2003. Available at Link: https://www.
who.int/publications/i/item/climate-change-and-human-health—-risks-and-responses
20 Government of Sri Lanka, “Dengue cases double in 2019”, news.lk, 1 January 2020. Available at https://www.news.lk/news/political-current-affairs/
item/28976-dengue-cases-double-in-2019; Gemma Holliani Cahya, “Dengue death toll climbs to 132, eight regions declare emergency”, The Jakarta Post,
31 January 2019. Available at https://www.thejakartapost.com/news/2019/01/31/dengue-death-toll-climbs-to-132-eight-regions-declare-emergency.
html; Government of the Marshall Islands, “Dengue-3 outbreak in Republic of the Marshall Islands June 25, 2019 – March 21, 2021”, situation report, 23
March 2021. Available at https://reliefweb.int/report/marshall-islands/dengue-3-outbreak-republic-marshall-islands-june-25-2019-march-21-2021; World
Health Organization, “WHO scales up response to worldwide surge in Dengue”, 14 November 2019. Available at https://www.who.int/news-room/feature-
stories/detail/who-scales-up-response-to-worldwide-surge-in-dengue; Anil Gejji, “With over 14k cases, Karnataka tops dengue list in the country”, The
Times of India, 6 December 2019. Available at https://timesofindia.indiatimes.com/india/with-over-14k-cases-karnataka-tops-dengue-list-in-the-country/
articleshow/72405244.cms; Government of Philippines, “DOH declares national dengue epidemic”, press release, 6 August 2019. Available at https://doh.
gov.ph/press-release/DOH-DECLARES-NATIONAL-DENGUE-EPIDEMIC
9ASIA-PACIFIC DISASTER REPORT 2021
TABLE 1-1 Dengue outbreaks in 2019
Subregion Countries Impact summary
South-East Asia Philippines The Department of Health declared a national dengue
epidemic. There were 146,062 cases recorded from January
to July 2019, which was almost double the number for the
same period in 2018.
Indonesia Indonesia reported a total of 13,683 dengue fever cases
in January 2019, and eight regions declared a dengue
emergency. However, since 2016, the country has seen an
overall decline in dengue cases and related deaths.
Pacific Marshall Islands There were 772 dengue-like illness cases of which 220 had
been confirmed as of 25 June 2019.
South and South-West Asia Bangladesh In 2019, the worst dengue outbreak was recorded with more
than 92,000 cases. The prolonged monsoon rains provided
ideal breeding grounds for mosquitoes to thrive in warm,
humid conditions.
Pakistan The worst dengue outbreak was recorded with over 45,000
people infected as of early November 2019.
India In 2019, 91,457 cases of dengue were reported until October.
Nepal More than 10,000 cases of dengue fever were reported as of
late September 2019.
Sri Lanka The worst year was 2017, with more than 186,000 confirmed
cases recorded. In 2019, 99,120 cases were recorded, which
was nearly double the number in 2018.
For malaria, on the other hand, the total number of confirmed cases has gradually decreased since 2000.
Nevertheless, over 2 million cases are reported every year, mainly in South and South-West Asia, and
South-East Asia. In the Pacific, the numbers have been rising; from less than 200,000 per year in the early
2000s to over 500,000 in 2016 and 2017 (Figure 1-12).
FIGURE 1-12 Confirmed malaria cases, 2000–2017
ASIA-PACIFIC REGION TOTAL PACIFIC
3 500 600
3 000
500
2 500
400
2 000
300
NUMBER OF PEOPLE, THOUSANDS
1500
NUMBER OF PEOPLE, MILLIONS
200
1000
100
500
0 0
2000
2001
2002
2003
2004
2005
2006
2007
2008
2009
2010
2011
2012
2013
2014
2015
2016
2017
2000
2001
2002
2003
2004
2005
2006
2007
2008
2009
2010
2011
2012
2013
2014
2015
2016
2017
South and South-West Asia South-East Asia Pacific East and North-East Asia
Source: Data from World Health Organization, Global Health Observatory. Available at https://www.who.int/data/gho/data/themes/topics/topic-details/GHO/
cases (accessed on 6 February 2021).
10Chapter 1: The shifting contours of the Asia-Pacific disaster riskscape
COVID-19-compounded disasters
As of 6 June 2021, countries in the Asia-Pacific region had reported 49 million confirmed COVID-19 cases,
and more than 748,000 deaths. The pandemic has had the greatest impact in South and South-West Asia,
with 37.2 million confirmed cases, and in North and Central Asia with 6.6 million cases (Figure1-13).21
FIGURE 1-13 Monthly COVID-19 cases in Asia and the Pacific, 1 January 2020—6 June
2021
MONTHLY COVID-19 CASES, ASIA AND THE PACIFIC, 2020–2021 CONFIRMED CASES OF COVID-19, SUBREGIONAL PERCENTAGE
14
2.2%
12
10 8.3% 13.5% 0.2%
8
NUMBER OF PEOPLE, MILLIONS
6
4
2 75.8%
0
Jan
Feb
Mar
Apr
May
Jun
Jul
Aug
Sep
Oct
Nov
Dec
Jan
Feb
Mar
Apr
May
2020 2021
East and North-East Asia South and South-West Asia South-East Asia North and Central Asia Pacific
Source: Data from World Health Organization, WHO Coronavirus (COVID-19) Dashboard. Available at https://covid19.who.int (accessed on 7 June 2021).
While the COVID-19 pandemic raged on, the region continued to experience other natural hazards, many
of which were hydro-meteorological (Figure 1-14). Tropical cyclones hit many countries across the region.
Major flood events were reported in China, Japan, Papua New Guinea, Pakistan, the Islamic Republic of
Iran, Kazakhstan and Uzbekistan.
The lockdowns, travel restrictions and other containment measures that were imposed as a response to
COVID-19 interrupted many established measures for prevention, response, and recovery from natural
hazards. At the same time, natural hazards also hampered the response to COVID-19 and facilitated its
spread as people were forced to crowd together in emergency shelters.
In May 2020, the COVID-19 pandemic was rapidly spreading in India and Bangladesh when cyclone
Amphan struck (Figure 1-15). It was one of the strongest recorded cyclones that hit densely populated
coastal areas and led to extensive flooding. In West Bengal, it damaged 563 primary health centres, 169
block primary health centres and 5,142 community sub-centres.22
In August 2020, the city of Karachi, in Pakistan, was hit by record flooding and torrential rainfall which cost
440 lives and affected close to 1.6 million people. In the Philippines, typhoon Goni made landfall in the
Bicol region, in November, which resulted in crowding in vaccination centres and triggered a far greater
risk of transmission. The typhoon isolated several towns and damaged the main COVID-19 laboratory,
resulting in the suspension of COVID-19 testing.23
21 World Health Organization, WHO Coronavirus (COVID-19) Dashboard. Available at https://covid19.who.int
22 International Federation of Red Cross and Red Crescent Societies, (IFRC), “India: Cyclone Amphan Operation Update Report”, Situation Report, (India, 23
July 2020b). Available at https://reliefweb.int/report/india/india-cyclone-amphan-operation-update-report-dref-n-mdrin025 (accessed on 12 February
2021).
23 “‘Super typhoon’ Goni: Towns cut off as COVID-19 impacts response”, UN News, 3 November 2020. Available at https://news.un.org/en/
story/2020/11/1076742 (accessed on 13 February 2021).
11ASIA-PACIFIC DISASTER REPORT 2021
FIGURE 1-14 COVID-19 and major disasters in 2020 and 2021
N
10
8
14
9
1
7
6 4
11
3
15
13
CONFIRMED COVID-19 CASES
0/No data
12
1–5 000
5 001–50 000
5
50 001–500 000
500 001–1 000 000
1 000 001–10 000 000
>10 000 000 2
KILOMETRES
0 2 000 4 000
1 AFGHANISTAN 2 AUSTRALIA 3 BANGLADESH AND INDIA
Hazard: Drought Hazard: Convective storm Hazard: Cyclone Amphan
Period: Jan–Apr 2021 Period: 19–21 Jan 2020 Period: 16–21 May 2020
Province: Badghis State: New South Wales & Victoria Affected population: 20.6 million
Affected population: 9 million Damage in USD: 1.5 billion Damage in USD: 14.5 billion
4 CHINA 5 FIJI 6 IRAN (ISLAMIC REPUBLIC OF)
Hazard: Flood Hazard: Cyclones Harold, Ana Hazard: Flood
Period: 21 May–30 Jul 2020 Period: 8–9 Apr 2020, 30–31 Jan 2021 Period: 1–2 Apr 2020
Province: Yangtze River Basin Province: Kadavu, Viti Levu Province: Fars, Hormozgan, Qom
Affected population: 4.2 million Affected population: 180,000 & 82,751 Affected population: 2,845
Damage in USD: 17 billion Damage in USD: 1.2 billion
7 JAPAN 8 KAZAKHSTAN 9 REPUBLIC OF KOREA
Hazard: Flood Hazard: Flood Hazard: Cyclone Heishen
Period: 29 Jun–10 Jul 2020 Period: 1–4 May 2020 Period: 6–8 Sep 2020
Province: Kyushu Province: Turkestan Province: Ulsan
Damage in USD: 5.8 billion Affected population: 33,000 Damage in USD: 1.2 billion
10 MONGOLIA 11 PAKISTAN 12 PAPUA NEW GUINEA
Hazard: Dzud Hazard: Flood Hazard: Flood
Period: Dec 2020 Period: Aug–Sep 2020 Period: 4–7 Apr 2020
Province: Khovd, Gobi-Altai Province: Sindh, Khyber Pakhtunkhwa Province: Moripi, Toaripi
Affected herders: 150,000 Affected population: 2.6 million Affected population: 60,000
Damage in USD: 1.5 billion
13 PHILIPPINES 14 UZBEKISTAN 15 VIET NAM
Hazard: Cyclones Ulysses, Goni Hazard: Flood Hazard: Cyclone Linfa
Period: 11-12 Nov 2020 & 31 Oct-1 Nov 2020 Period: 1-11 May 2020 Period: 6 Oct–3 Nov 2020
Affected population: 4.9 million and 2 million Province: Syr Darya Province: Da Nang, Hà Tĩnh
Total deaths: 111 and 399 Affected population: 70,050 Damage in USD: 6.7 billion
Damage in USD: 42 million and 369 million
Sources: ESCAP, based on WHO Coronavirus Disease (COVID-19) Dashboard, as of 6 June2021; EM-DAT accessed on 4 May 2021; and Reliefweb,
Accessed in February 2021.
Disclaimer: The boundaries and names shown and the designations used on this map do not imply official endorsement or acceptance by the United Nations.
Dotted line represents approximately the Line of Control in Jammu and Kashmir agreed upon by India and Pakistan. The final status of Jammu
and Kashmir has not yet been agreed upon by the parties.
Note: Confirmed cases are as of 6 June 2021.
12Chapter 1: The shifting contours of the Asia-Pacific disaster riskscape
FIGURE 1-15 Convergence of cyclone Amphan with the COVID-19 pandemic
N
!
!
!
! ! ! ! ! !
! ! ! ! ! !
! ! ! !
!
!
!
!
!
!
! !
! ! !
!
!
!
Punjab
CONFIRMED COVID-19 CASES INDIA Uttar Pradesh
0–50 Rajasthan Bihar
51–200
201–400
Madhya Pradesh
401–800 Gujarat
801–1 600 Orissa
BANGLADESH
Maharashtra
1 601–3 000
Telangana
3 001–17 000
Karnataka Cyclone Amphan
17 001–50 000
50 001–150 000
KILOMETRES
0 500 1 000
Sources: ESCAP, based on ESRI and John Hopkins University Coronavirus COVID-19 Cases V2, 16 June 2020 and Cyclone Amphan on NASA's Aqua
satellite the Moderate Resolution Imaging Spectroradiometer (MODIS), 20 May 2020.
Disclaimer: The boundaries and names shown and the designations used on this map do not imply official endorsement or acceptance by the United Nations.
Dotted line represents approximately the Line of Control in Jammu and Kashmir agreed upon by India and Pakistan. The final status of Jammu
and Kashmir has not yet been agreed upon by the parties.
Source: United Nations, Economic and Social Commission of Asia and the Pacific (ESCAP), “Protecting the most vulnerable to cascading risks
from climate extremes and the COVID-19 in South Asia”, policy brief, 14 August 2020b. Available at https://www.unescap.org/resources/
protecting-most-vulnerable-cascading-risks-climate-extremes-and-covid-19-south-asia
TABLE 1-2 Number of people affected by the COVID-19 pandemic and natural hazards
in the Asia‑Pacific subregions
Number of people affected by COVID-19 Number of people
affected by natural
Subregion 2020 2021 (as of 6 June) Sub-total hazards (2020)
East and North-East Asia 388 894 693 665 1 082 559 15 328 666
South and South-West Asia 12 801 945 24 392 271 37 194 216 30 910 631
South-East Asia 1 442 436 2 636 426 4 078 862 15 738 911
North and Central Asia 4 043 839 2 568 085 6 611 924 113 709
Pacific 55 160 21 421 76 581 359 636
Total 18 732 274 30 311 868 49 044 142 62 451 553
A riskscape of cascading hazards
The convergence of biological and natural hazards has added to the stresses of poverty and inequality,
further damaging the life prospects of millions of people across the Asia-Pacific region. The pandemic
has demonstrated that while some countries have achieved success in dealing with individual disasters,
many others are still ill-prepared for complex overlapping crises. This will have implications for achieving
the goals of the 2030 Agenda for Sustainable Development.
13ASIA-PACIFIC DISASTER REPORT 2021
These limitations were already identified in the Sendai
Framework for Disaster Risk Reduction 2015–2030, BOX 1-1 Cascading hazards
which was adopted by UN Member States in 2015 at
the World Conference on Disaster Risk Reduction. The concept of cascading hazards
The framework recognized the central importance comprises everything from vulnerability,
of health threats, including biological hazards, which risks, threats, triggers, to processes,
encouraged the development of the field of ‘health responses, and outcomes. Cascading
emergency and disaster risk management.’24 Even hazards turn into cascading disasters
so, the intersection of biological and other natural when their effects increase in progression
hazards remains poorly explored and understood.25 over time and generate unexpected
secondary events. These events can
Any natural disaster or other emergency that stem from overlaps of disaster events,
displaces large numbers of people is likely to lead to from failures of physical structures and
a surge in epidemic diseases, such as hepatitis A and the social functions that depend on
E, measles, diarrhoeal diseases, meningitis, acute them, including critical facilities. The
respiratory infections, malaria, or dengue. In August inadequacy of mitigation strategies,
2020, during the COVID-19 pandemic, the monsoon such as evacuation procedures, land-use
floods in South Asia heightened the risk of dengue planning and emergency management
and malaria outbreaks and stretched health resources strategies further exacerbate the
to breaking point.26 The coincidence of natural and situation. Cascading disasters tend to
biological hazards is illustrated in Figure 1-16. 27, 28 highlight the major gaps in addressing
vulnerabilities in human societies.
The overlaps between multiple hazards are likely to
intensify as a result of climate change, particularly in Adapted from: Shlomo Mizrahi, “Cascading disasters,
information cascades and continuous time models
Asia and the Pacific, which is already the world’s most of domino effects”, International Journal of Disaster
disaster-prone region.29 Climate-related disasters of Risk Reduction, vol 49 (October 2020). Available at
https://doi.org/10.1016/j.ijdrr.2020.101672
increasing frequency, intensity and unpredictability
are already battering vulnerable sectors and
communities (Figure 1-17). Overlapping hazards, along
with the interconnectedness of economies at different
scales, are creating systemic risks that demand more
sustained and rigorous approaches.30
Biological hazards - Between 2000 and 2020, biological hazards accounted for almost 8 per cent of the
total number of disaster events recorded in the Asia-Pacific region and affected more than 3 million
people (Figure 1-17). Along with the epidemics and pandemics, there are also endemic health hazards
including dengue, typhoid, tuberculosis, and chikungunya. Assessing the region’s vulnerability to
biological hazards, the World Health Organization (WHO) notes that the largest threats to the region are
the Middle East respiratory syndrome, diarrhoeal diseases, Crimean-Congo haemorrhagic fever, Japanese
encephalitis, and the Zika virus disease.31
24 Natalie Wright and others, “Health emergency and disaster risk management: Five years into implementation of the Sendai Framework”, International
Journal of Disaster Risk Science, vol. 11 (2020), pp. 206–217. Available at https://link.springer.com/article/10.1007/s13753-020-00274-x
25 Rajib Shaw and others, “Integrating biological hazards (including pandemics) into DRR planning”, technical advisory document. Available at http://www.
ccouc.ox.ac.uk/_asset/file/technical-advisory-document-on-biological-hazard-rajib-final.pdf
26 International Federation of Red Cross and Red Crescent Societies (IFRC), “17.5 million affected by floods and threatened by disease in South Asia”, press
release, 6 August 2020a. Available at https://media.ifrc.org/ifrc/press-release/17-5-million-affected-floods-threatened-disease-south-asia/
27 Kaveh Zahedi, “Confronting the new climate reality in Asia and the Pacific”, blog, 23 September 2019. Available at https://www.unescap.org/blog/
confronting-new-climate-reality-asia-and-pacific
28 World Health Organization, Regional Office for South-East Asia, Roots for Resilience: A health Emergency Risk Profile of the South-East Asia Region (New
Delhi, 2017). Available at https://apps.who.int/iris/handle/10665/258766
29 The Disaster Riskscape across Asia-Pacific: Pathways for Inclusion and Empowerment (United Nations publication, 2019).
30 United Nations Office for Disaster Risk Reduction, Integrating Disaster Risk Reduction and Climate Change Adaption in the UN Sustainable Development
Cooperation Framework (Geneva, 2020).
31 Asia and the Pacific SDG Progress Report 2020 (United Nations publication, 2020a). Available at https://www.unescap.org/publications/asia-and-pacific-
sdg-progress-report-2020
14Chapter 1: The shifting contours of the Asia-Pacific disaster riskscape
FIGURE 1-16Number of people in Asia and the Pacific affected by biological and other
natural hazards, 2003–2020
500
PEOPLE AFFECTED BY NATURAL HAZARDS (CLIMATOLOGICAL,
400
GEOPHYSICAL, HYDRO-METEOROLOGICAL), MILLIONS
300
200
100
20
20
16
12
8
4
0
2003–2005 2006–2008 2009–2011 2012–2014 2015–2020
Hydro-meteorological Geophysical Climatological Biological
Source: EM-DAT – The International Disaster Database. Available at https://www.emdat.be (accessed on 20 April 2021).
FIGURE 1-17 Types of disasters in Asia and the Pacific, 2000–2020
2% 0.01%
54 events HEATWAVE
HEATWAVE 300 583
0.1%
4% 3 million
BIOLOGICAL
98 events DROUGHT
14%
8% CYCLONE 436 million
195 events BIOLOGICAL
27%
678 events CYCLONE
36%
DROUGHT 1.1 billion
59% 50%
1 485 events FLOOD FLOOD 1.6 billion
NUMBER OF EVENTS NUMBER OF PEOPLE AFFECTED
2000–2020 2000–2020
Source: EM-DAT – The International Disaster Database. Available at https://www.emdat.be (accessed on 20 April 2021).
Note: All figures have been rounded off.
15ASIA-PACIFIC DISASTER REPORT 2021
Intersection of biological hazards with natural hazards
Floods – By worsening living conditions and displacing people from their homes, floods can lead to
gastro-intestinal illnesses. They also interrupt the treatment of non-communicable diseases by disrupting
supply chains. In addition, there is a heightened risk of vector-borne diseases, such as dengue and
malaria.32 The human-animal-insect interaction weaves a complex web of disease transmission that is
further compounded during flooding, which provides a perfect breeding ground for mosquitos.33
Tropical cyclones – Through water contamination, cyclones can lead to communicable and infectious
diseases. Following cyclone Ami, in Fiji in 2003, for example, drinking water was found to be filled with
coliform bacteria, resulting in cases of diarrhoea and dysentery and other water-borne diseases, such as
cholera and typhoid fever.34 Subsequent waterlogging also creates breeding grounds for the vectors of
malaria, dengue and chikungunya, with an increased risk of skin infections.35
Droughts – Droughts can lead to increased pollution, pests and diseases, and even famine.36 Shrinking
water sources increase the risks of contamination, and when droughts force people to migrate there is
often an increase in child malnutrition,37 stunting, and even adult malnutrition.38 Droughts typically affect
the most vulnerable populations, creating cycles of intergenerational deprivation.39
Heatwaves – These are more recent and poorly understood threats. They disrupt economies, result in
losses in labour productivity, agriculture, transport and utilities, and present profound risks to health.
Heatwaves increase deaths for those suffering from underlying cardiovascular and respiratory conditions,
and are also associated with suicides. The very old, the poor, the socially isolated, and those who often
work outdoors in informal economies, are the most susceptible. Poorer people, living in inferior housing
conditions experience overheating, while the costs of water make bathing more expensive. The demand
for healthcare soars, increasing requests for consultations and increasing admissions to hospitals that
themselves are often poorly designed to cope with the heat. Another issue is the use of electricity for
fans and air-conditioning which leads to shortages of supply. Furthermore, the poor may not be able to
afford any form of mechanical cooling.40 Even countries accustomed to high temperatures have not been
spared. For example, during the 2015 heatwave in Karachi, Pakistan, almost 65,000 people were taken to
hospital with heat-related symptoms.41 Additionally, air-conditioning mostly uses energy derived from
fossil fuels and, thus, contributes to climate change, while waste heat from the pumps also intensifies the
urban heat island effect.42
This range of disasters exacerbates the underlying drivers of vulnerability, which include poverty,
inequality, unplanned and rapid urbanization. Poor natural resource management along with
compounding factors, such as increasing populations, population density, and declining and fragile
ecosystems all converge into a riskscape of expanding and cascading hazards. And, this is the riskscape
within which the COVID-19 pandemic appeared.
32 World Health Organization, Regional Office for South-East Asia, Roots for Resilience: A health Emergency Risk Profile of the South-East Asia Region (New
Delhi 2017). Available at https://apps.who.int/iris/handle/10665/258766
33 Cyril Caminade, K. Marie McIntyre and Anne E. Jones, “Impact of recent and future climate change on vector-borne diseases”, Annals of the New York
Academy of Sciences, vol 1436, No. 1 (January 2019), pp. 157–173. Available at https://www.ncbi.nlm.nih.gov/pmc/articles/PMC6378404/
34 Luke M. Mosley, Donald S. Sharp and Sarabjeet Singh, “Effects of a tropical cyclone on the drinking-water quality of a remote Pacific island”, Disasters, vol.
28, No. 4 (December 2004), pp. 405–17. Available at https://pubmed.ncbi.nlm.nih.gov/15569381/
35 Zhengyi Deng and others, “Impacts of tropical cyclones and accompanying precipitation on infectious diarrhoea in cyclone landing areas of Zhejiang
Province, China”, International Journal of Environmental Research and Public Health, vol. 12, No. 2 (February 2015), pp. 1054–1068. Available at https://
www.ncbi.nlm.nih.gov/pmc/articles/PMC4344654/
36 M. Alimullah Miyan, “Droughts in Asian Least Developed Countries: Vulnerability and sustainability”, Weather and Climate Extremes, vol. 7 (March 2015),
pp. 8–23.
37 Matthew W. Cooper and others, “Mapping the effects of drought on child stunting”, Proceedings of the National Academy of Sciences of the United States
of America, vol. 116, No. 35 (August 2019). Available at https://www.pnas.org/content/pnas/116/35/17219.full.pdf
38 Carla Stanke and others, “Health effects of drought: a systematic review of the evidence”, PLoS Currents, vol. 5, No. 5 (June 2013). Available at / https://
www.ncbi.nlm.nih.gov/pmc/articles/PMC3682759
39 Ready for the dry years: Building resilience to drought in South-East Asia, Second Edition (United Nations publication, 2020c).
40 “Heatwaves and health”, The Lancet, vol. 392, No. 10145 (August 2018), p. 359. Available at https://doi.org/10.1016/S0140-6736(18)30434-3
41 Syed Ghazanfar Saleem and others, “Risk factors for heat related deaths during the June 2015 heat wave in Karachi, Pakistan”, Journal of Ayub Medical
College Abbottabad, vol. 29, No. 2 (April/June 2017), pp. 320–324.
42 “Heatwaves and health”, The Lancet, vol. 392, No. 10145 (August 2018), p. 359. Available at https://doi.org/10.1016/S0140-6736(18)30434-3
16Chapter 1: The shifting contours of the Asia-Pacific disaster riskscape
BOX 1-2 Natural disasters, climate change and the emergence
of fungal pathogens
In addition to viral and bacterial diseases, the emergence of fungal pathogens poses a significant
threat to human health, environment, and food security. In India, amidst the COVID-19 pandemic,
over 8,400 cases of black fungus, a rare infection, have been recorded. The cases are increasing
due to the use of steroids in combating the COVID-19 virus. Fungal infections have no vaccines and
there is a limited arsenal of anti-fungal agents. Furthermore, during natural disasters, these fungal
infections can spread. For example, floods and cyclones disperse and aerosolize fungi causing wider
dissemination.
Recent findings highlight that climate change is exacerbating this threat. Under increasing
temperatures, fungi are not only evolving thermotolerance, but are also gradually adapting and
multiplying faster in increased temperatures. The following table shows the emerging fungal
pathogens whose growth may potentially be attributed to climate change and its impacts.
TABLE Influence of climate change on emerging fungal pathogens
Fungal pathogens Major impact and features Climate change causes/influence
Candida Auris (C.auris) Human health First ‘novel’ pathogen to have evolved in
response to climate change (conclusive
• Colonises and spreads in healthcare evidence awaited)
settings
• Remarkably resistant to antifungals and
disinfectants
• Low in virulence and has caused infection
in people with severe comorbidities
Cryptococcus deuterogattii Human and animal health Spread attributed to human activities and
(C.deuterogattii) their environmental impacts; for example,
• Traditionally found in tropical and sub-
through vehicle wheel wells, footwear,
tropical climates, recently emerged in
construction, forest activity (aerial
temperate regions, like western Canada and
dispersal) and water; climate change
caused hundreds of infections in people
suggested as a potential driver
and animals
• High capacity for thermal adaptation
Fusarium head blight (FHB) Food security Outbreaks occur particularly in years
with warm and humid weather; severity
• Concern for wheat and cereal crops
is likely to increase in future warmer
• Infection leads to reduced yield and climates
quality, yield loss up to 75%
Overall, climate change and natural hazards are causing the emergence of new fungal pathogens, as
well as the evolution of new traits, like virulence and anti-fungal resistance in existent fungi. Hence,
these risks must also be incorporated when tackling the cascading risks of converging climate,
health and natural hazards.
Source: Nnaemeka E. Nnadi and Dee A. Carter, “Climate change and the emergence of fungal pathogens”, PLOS Pathogens, vol. 17, No. 4 (April 2021).
Available at https://doi.org/10.1371/journal.ppat.1009503 and Dona Cherian, “India COVID-19: White fungus and black fungus – symptoms, causes,
treatment, Gulf News, 22 May 2021.
17ASIA-PACIFIC DISASTER REPORT 2021
Climate change exacerbates the impacts of converging natural
and biological hazards
In the years ahead, the Asia-Pacific disaster riskscape will continue to be reshaped by climate change.43
Alarmingly, the Asia and the Pacific SDG Progress Report 2021 notes that the region has substantially
regressed on Goal 13: Climate Action.44 Additionally, natural disasters linked to climate change
disproportionately affect poor people and poor countries.45 This is concerning as global warming is not
only a hazard in itself, but it also exacerbates interactions between biological and natural hazards and
other risk drivers, such as poverty (Figure 1-18). Global heating and the increase in variability of extreme
temperature fluctuations can affect the frequency and intensity of disasters, and make certain places and
population groups more vulnerable. Overall, there is extensive scientific evidence that climate change is
affecting weather extremes.46 , 47
FIGURE 1-18 Climate change exacerbates disaster risk
CONVERGING HAZARDS & CASCADING RISKS
RISK DRIVERS
Poverty Inequality Population Unsustainable
density development
NATURAL HAZARDS
Cyclone Drought Flood
CLIMATE CHANGE NOVEL BIOLOGICAL
HAZARDS/LARGE SHOCKS COVID-19 Emerging
viruses
RECURRING BIOLOGICAL
Zoonotic Vector/
HAZARDS disease water-borne
disease
Since the early 2000s, there have been more than 300 peer-reviewed studies on the impact of climate
change on weather extremes around the world. Of these, a number have concluded that climate change
would make around 70 per cent of the extreme weather events either more likely or more severe. Within
these studies, 32 per cent analysed extreme heat and 22 per cent analysed floods. From those that studied
extreme heat, 116 found that climate change had made such weather conditions either more likely or
more severe. Other events that are likely to be exacerbated include heavy rain and flooding, drought,
cold/snow, storms and wildfires (Figure 1-19).48 However, the coverage of these studies is uneven as they
concentrate on certain hazards and particular areas. For example, of the studies on countries within Asia
and the Pacific, 25 per cent were on China and 28 per cent on Australia.
43 World Health Organization, Regional Office for South-East Asia, Roots for Resilience: A health Emergency Risk Profile of the South-East Asia Region (New
Delhi, 2017). Available at https://apps.who.int/iris/handle/10665/258766
44 Asia and the Pacific SDG Progress Report 2021 (United Nations publication, 2021a). Available at https://www.unescap.org/sites/default/d8files/
knowledge-products/ESCAP_Asia_and_the_Pacific_SDG_Progress_Report_2021.pdf
45 Economic and Social Survey of Asia and the Pacific 2021: Towards post COVID-19 resilient economies (United Nations publication, 2021b).
46 Susan Joy Hassol and others, “(Un)Natural disasters: Communicating linkages between extreme events and climate change”, World Meteorological
Organization Bulletin, vol. 65, No. 2 (2016). Available at https://public.wmo.int/en/resources/bulletin/unnatural-disasters-communicating-linkages-
between-extreme-events-and-climate
47 Stephanie C. Herring and others, eds., “Explaining extreme events of 2019 from climate perspective”, Bulletin of the American Meteorological Society, vol.
102, No. 1 (January 2021). Available at https://www.ametsoc.org/ams/index.cfm/publications/bulletin-of-the-american-meteorological-society-bams/
explaining-extreme-events-from-a-climate-perspective/
48 CarbonBrief, “Mapped: How climate change affects extreme weather around the world”, 26 February 2021. Available at https://www.carbonbrief.org/
mapped-how-climate-change-affects-extreme-weather-around-the-world
18Chapter 1: The shifting contours of the Asia-Pacific disaster riskscape
FIGURE 1-19 Impact of climate change on extreme weather conditions
140
120
100
80
60
NUMBER OF STUDIES
40
20
0
Heat Rain/flood Drought Cold/snow Storm Oceans Wildfire Atmosphere Coral Ecosystem Sunshine Riverflow
bleaching function
NUMBER OF EXTREME
WEATHER EVENTS IN 43 23 11 4 5 8 3 1 3 1 1 0
ASIA-PACIFIC REGION
More severe or more likely to occur Less severe or less likely to occur
No discernible human influence Insufficient data/inconclusive
Source: ESCAP based on data from CarbonBrief, “Mapped: How climate change affects extreme weather around the world”, 26 February 2021. Available at
https://www.carbonbrief.org/mapped-how-climate-change-affects-extreme-weather-around-the-world.
The clearest links between climate change and disaster events are those related to heatwaves, such as the
Russian heatwave in 2010,49 and the more recent heatwaves in Australia.50 Attributing climate change to
disaster events is more difficult for other disasters, particularly for droughts which have multiple drivers.
Floods, droughts, and biological hazards all damage human health, including mental health, and deepen
inequalities. These impacts are being compounded by climate change which, combined with increasing
anthropogenic pressure on the natural environment, is contributing to the emergence and transmission
of infectious diseases.51 Furthermore, if these impacts are sudden, they can overwhelm health-care
systems.
• Malaria and dengue fever – The sixth assessment report of the IPCC notes that climatic variations will
create new ecological niches for vector-borne and zoonotic diseases.52 Global warming from 1.5°C to
2°C would not only increase the length of the transmission season, but also the geographic range of
the vectors.53
• Diarrhoeal disease – Seasonal flooding, induced by climate change, can cause drainage systems to
overflow and contaminate clean water sources, leading to outbreaks of disease among children under
five years of age and, to some extent, adults.
• Biological diseases – People being shifted to temporary shelters due to flood evacuation, for example,
run the risk of contracting measles, in addition to COVID-19.
• Malnutrition – Rural communities face food insecurity as a result of droughts, while frequent bouts of
disease disrupt the growth of children under five years of age putting them at risk for moderate and
severe malnutrition.
49 Quirin Schiermeier, “Droughts, heatwaves and floods: How to tell when climate change is to blame”, Nature, 30 July 2018. Available at https://www.nature.
com/articles/d41586-018-05849-9
50 Chelsea Harvey, “Scientists can now blame individual natural disasters on climate change”, Scientific American, 2 January 2018. Available at https://www.
scientificamerican.com/article/scientists-can-now-blame-individual-natural-disasters-on-climate-change/
51 Felicia Keesing and others, “Impacts of biodiversity on the emergence and transmission of infectious diseases”, Nature, vol. 468 (2012), pp. 647–652.
Available at https://www.nature.com/articles/nature09575
52 Intergovernmental Panel on Climate Change, “Sixth Assessment Report”. Available at https://www.ipcc.ch/assessment-report/ar6/ (accessed on 26
February 2021).
53 Alistair Woodward and others, “Climate change and health: on the latest IPCC report”, Lancet, vol. 383, No. 9924 (April 2014), pp. 1185–1189.
19You can also read