Monitoring and Assessment of Scallops off the South East Coast of Ireland
←
→
Page content transcription
If your browser does not render page correctly, please read the page content below
Monitoring and Assessment
                                  of Scallops off the South East
                                  Coast of Ireland
                                  Oliver Tully, Antonio Hervas,
                                  Alan Berry, Michael Hartnett,
                                  Gerry Sutton, Eimear O'Keeffe
                                  and John Hickey

Fisheries Development Division,
Bord Iascaigh Mhara,
P.O. Box 12,
Crofton Road,
Dun Laoghaire,
Co. Dublin,
Ireland.

Tel:     +353 1 2144 230
Fax:     +353 1 2300 564
Web:     www.bim.ie
Email:   info@bim.ie

© BIM 2006

                                  Fisheries Resource Series      No. 3 (2006)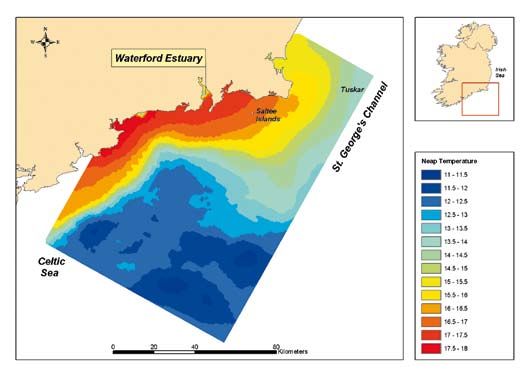
ISSN 1649-5357                                                                                                    ISSN 1649-5357

Fisheries Resource Series                                                                                         Fisheries Resource Series

Foreword                                                                                                          Catalogue of most recent issues

                                                                                                                  No.1(1) 2004   A Technical and Scientific Record of Experimental Fishing for Deepwater Species in the Northeast
Since its inception, Bord Iascaigh Mhara (BIM) has regularly reported on the work it undertakes as the
                                                                                                                                 Atlantic, by Irish fishing vessels, in 2001. Volume 1; Report. Conor P. Nolan (ed.), 172pp.
agency responsible for the sustainable development of the Irish seafood industry at sea and ashore.
                                                                                                                  No.1(2) 2004   A Technical and Scientific Record of Experimental Fishing for Deepwater Species in the Northeast
The Resource Records Series, which ran for many years, is a notable example of this and admirably                                Atlantic, by Irish fishing vessels, in 2001. Volume 2; Appendices. Conor P. Nolan (ed.), 309pp.
fulfilled the Board’s remit to print and circulate bulletins, periodicals, pamphlets, and other literature, as    No. 2 2004     The Biology and Management of Clawed Lobster (Homarus gammarus L.) in Europe. Oliver Tully
the Board deemed advisable, in the interests of the sea-fishing industry. Building on this tradition, whilst                     (ed.), 31pp.

also recognising the challenges and opportunities that face the sea-fishing industry today, the Fisheries
Resource Series, produced by the Fisheries Development Division of BIM, is intended as a professional,
broadly based, peer reviewed publication.

The content of the Fisheries Resource Series reflects a synergy of resources and expertise between BIM
and the Irish fishing industry, national academic institutions, international partners, other state and semi-
state agencies and provides a vehicle for the dissemination of the results of the Board’s innovative, technical
and applied research and development activities.

Technical and scientific contributions to the Fisheries Resource Series are invited, from internal and
external sources, which primarily promote the sustainable development of the Irish sea fisheries sector and,
in addition, support its diversification in the coastal regions so as to enhance the contribution of the sector
to employment, income and welfare both regionally and nationally.

Note: The views expressed herein reflect those of the authors and do not necessarily reflect those of Bord
Iascaigh Mhara. Ownership of content and associated intellectual property rights remain those of the
publisher (BIM).

Michael Keatinge
Fisheries Development Manager,
Bord Iascaigh Mhara,
P.O. Box, 12,
Crofton Road,
Dun Laoghaire,
Co. Dublin,
Ireland
Monitoring and Assessment of Scallops
             off the South East Coast of Ireland

Oliver Tully1, Antonio Hervas2,5, Alan Berry3, Michael Hartnett3, Gerry Sutton4, Eimear O'Keeffe5, John Hickey1

1. Inshore Fisheries Sector, BIM, Crofton Road, Dun Laoghaire, Co. Dublin. Tel 091 564318. Email tully@bim.ie.

2. Zoology Department, Trinity College Dublin, Dublin 2. Email hervas@bim.ie

3. Marcon Computations International Ltd., Galway. Tel 091 583543. Email alan@marcon.ie.

4. Coastal & Marine Resources Centre, UCC, Naval Base, Haulbowline, Cobh, Co. Cork. Tel 021 4703113.
   Email gerry.sutton@ucc.ie.

5. Martin Ryan Institute, National University of Ireland, Galway. Tel 091 750386. Email okeeffe@bim.ie.

For citation purposes, this publication should be referred to as follows:

Oliver Tully, Antonio Hervas, Alan Berry, Michael Hartnett, Gerry Sutton, Eimear O’Keefe and John Hickey, 2006.
Monitoring and Assessment of Scallops off the South East Coast of Ireland. Fisheries Resource Series, Bord Iascaigh
Mhara (Irish Sea Fisheries Board), Dun Laoghaire, Ireland, Vol. 5, 2006, 20pp

ISSN 1649-5357

ISBN 1-903412-15-3

All rights reserved. No part of this publication may be reproduced, stored in a retrieval system, or transmitted
in any form by any means, electronic or otherwise, without the prior permission of the copyright owner.
Applications, for such permission, with a statement of the purpose and extent of the reproduction, should
be addressed to:

The Fisheries Development Manager,
Fisheries Development Division,
Bord Iascaigh Mhara,
P.O. Box 12,
Crofton Road,
Dun Laoghaire,
Co. Dublin,
Ireland.
Tel:        +353 1 2144 100
Fax:        +353 1 2300 564

© BIM 2006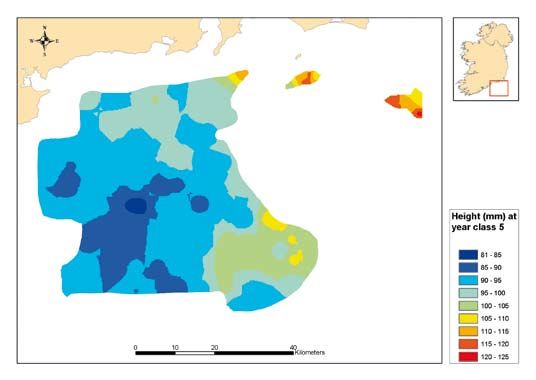
Monitoring and assessment of scallops off the south east coast of Ireland

Acknowledgements
This work was Funded by the Irish Government
and part-financed by the European Union under
the National Development Plan 2000-2006 through
the supporting measures for Sea Fisheries Sector
project number 01.SM.T1.07. We acknowledge the
co-operation of vessel owners who allowed access
to private catch rate data and who took part in
the annual surveys. BIM and the Marine Institute
supported the work on biotoxins.

                                                   EU FIFG
Monitoring and assessment of scallops off the south east coast of Ireland

Table of Contents

Summary                                                                                                1

Introduction                                                                                           2

The scallop fishery in Ireland                                                                         3

Processing and products                                                                                4

Legislation governing the exploitation of scallop                                                      5
     Technical measures and effort limitation                                                          5
     The Management Framework                                                                          5

Biology of scallop                                                                                     5
     Landings                                                                                          5

The physical environment                                                                               6
     Temperature and circulation                                                                       6
     Sediment structure                                                                                8
     Shear seabed stress                                                                               9

Stock Structure                                                                                       10
     Larval sources and sinks                                                                         10
     Connectivity between stocks                                                                      10

Landings per unit effort (LPUE)                                                                       11

Correlation between biological and physical variables                                                 12
     Distribution and relative abundance of scallop and sediment structure                            12
     Growth, temperature and shear stress                                                             13
     Growth and spatial management of yield                                                           15
     Biotoxins, growth and temperature                                                                15

Implications for fisheries management
     Stock structure and sources of larvae                                                            16
     Scallop abundance and sediment structure                                                         16
     Measurement of catch rates                                                                       17
     Growth rates, yield and biotoxins                                                                17
     Summary                                                                                          17

References                                                                                            18

                                                                                                       ii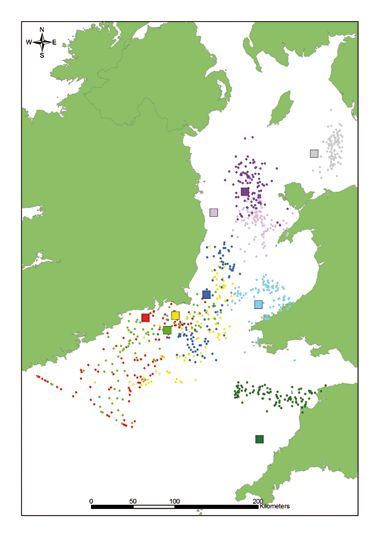
Monitoring and assessment of scallops off the south east coast of Ireland

Summary
Irish vessels fish for scallops in both inshore and offshore
waters off the southeast coast of Ireland, in the Irish Sea
and English Channel. Fishing effort potential peaked at
528 dredges in 2002. Landings peaked at 1891 tonnes
in 2004. The fleet supports a number of processing
plants in south Wexford. Fishing activity of the fleet is
limited, by European legislation, to 525012 kilowatt
days per annum. The Scallop Advisory Group provides a
co-operative forum within which management plans for
the fishery are developed.

Hydrodynamic and particle tracking models indicate
that temperature and currents off the south east coast
control the dispersal of scallop larvae, scallop growth
and accumulation of toxins by adult scallops. Seabed
maps, developed using multibeam acoustic methods,
and annual scallop survey data, indicate that on both
broad and fine spatial scales scallops off the south east
coast of Ireland are more abundant on gravel and mixed
sediments of gravel-cobble but are uncommon on sand.

Catch rates, derived from private vessel diaries and official
logbooks, and standardised for vessel and weather
effects, declined in some areas by 20-50% between
1995-2004. Catch rates, however, were largely stable in
deeper waters between 1999 and 2004.

Fishing activity data needs to be collected at fine spatial
scale, ideally using electronic logbook systems, to allow
catch rate data to be interpreted correctly. Spatial
management of effort is important in order to conserve
spawning areas that act as sources of recruitment and
to optimise yield per recruit, given that growth rates
vary spatially. The seabed maps can be used to reduce
dredge effort and increase catch rates and efficiency
of the fleet but must be paralleled by additional or
alternative management measures in order to give
adequate protection to stocks.
Monitoring and assessment of scallops off the south east coast of Ireland

Introduction                                                   of scallop in the area. Thirdly, seabed mapping surveys
                                                               were undertaken to provide detailed information on the
The scallop (Pecten maximus) is an important,                  distribution and quality of scallop habitat in the area.
commercially exploited, species of bi-valve in northern        Ancillary projects included an analysis of spatial variability
Europe from Norway south to Spain. It attains a large          in the level of the toxin domoic acid (causative agent of
body size, is a high value species and is also the subject     amnesic shellfish poisoning) in scallops off the south east
of extensive and intensive aquaculture in northern             coast. Details of these monitoring and research projects
Europe. In Ireland, the fishery for king scallops occurs       will be published separately.
mainly off the south east coast, in the south Irish Sea
and in the western approaches to England and Wales.
Fleets from the UK and Ireland exploit stocks outside of
national 12nm territorial limits in these areas.

The stocks of scallop off the southeast coast of Ireland
have not previously been assessed. In France and the
UK different assessment methods and management
measures apply. Some fisheries in France are quota
controlled and are assessed by age based analytical
methods or by annual survey corrected for dredge
efficiencies (Fifas 1991). In Scotland age based virtual
population analysis is used together with survey data
(Howell et al. 2003). Aspects of the biology of scallop
pose real difficulties for stock assessment. There is
usually significant spatial (geographic) variability in
biological characteristics, commercial catch rates,
abundance and recruitment within a given stock. The
boundaries between stocks and the interconnection,
through larval dispersal, between ‘populations’ of adult
scallops are also generally unknown. As a result there
may be no apparent relationship between spawning
stock and recruitment and recruitment variability is
usually considered to be very high. Interpretation of
commercial catch and effort data, survey data and
forecasting the impacts of management measures, such
as minimum landings sizes, effort or catch limitation,
under these circumstances, is difficult. Spatially explicit
modelling and understanding the processes that give rise
to the observed spatial structure and variability in scallop
distribution and biology is important if stock assessment,
relevant to management of this species, is to progress
(Smith and Rago 2004).

This paper presents an overview of a 5-year project,
undertaken from 2001-2005, on novel, spatially explicit
and multi-disciplinary approaches to the assessment of
scallop off the south east coast of Ireland. The project
supported work in 3 related areas under the broad
objective of developing stock assessment protocols and
methods in order to promote sustainable management
of these fisheries. A biological sampling program for
scallop provided data on distribution, abundance, trends
in the fishery and size, age and reproductive data for
scallops. A hydrodynamic model of the southeast coastal
area was developed to predict the scale and pattern
of dispersal of scallop larvae and the stock structure
Monitoring and assessment of scallops off the south east coast of Ireland

The scallop fishery in Ireland                               south east coast and south Irish Sea to the English
                                                             Channel and west of France south to 48°N (Fig. 2). In
Scallop fishing is a deep-rooted tradition, which in         1997 the total number of dredges in the fishery was
Ireland extends back to at least the 16th century            103. This expanded to 498 dredges between 1997-
(Mason, 1983). Scallops are commercially fished in           2000 and peaked at 528 dredges in 2002. By 2003 the
numerous locations in Ireland and are landed into            majority of Irish fishing effort on scallops had transferred
more than 40 ports around the coast. Stocks along the        from the Irish coast to the English Channel and the Irish
west and south coasts are small and discrete. Off the        Sea due to an apparent decline in stocks off the south
southeast coast and in the Irish Sea, however, scallops      east coast. From 2002, however, there was a gradual
are widely distributed and abundant in both inshore          decline in total fishing effort due to various economic
and offshore waters. The extent of these beds is largely     constraints. The physical condition of the vessels,
known although the fishing fleet is still expanding the      increasing fuel prices and declining market prices for
commercial boundaries of a number of areas.                  scallops in 2002-2004 all contributed to a reduction in
The south and east coast fishery is fundamentally            fishing activity. In addition, a days at sea regime was
different to the small inshore scallop fisheries off the     imposed on the Irish fleet by the European Commission
west coast. The offshore stocks are fished by large          (Council regulation 1415/2004) in 2005 which, when
vessels, 20-36m in length, which may each tow as             transposed to Irish legislation, limited the activity of the
many as 34 spring loaded dredges. The fishing gear           vessels. The resultant economic difficulties culminated
used by the Irish fleet is a toothed spring loaded dredge.   in the decommissioning of a number of vessels from the
The dredge is approximately 0.8m wide. The bag is            fleet in 2005 which had at least 75 days activity in each
constructed of 75mm internal diameter metal rings.           of two twelve month periods up to October 2005.
The length and shape of the teeth, which penetrate the
seabed, vary in size and design. The dredges are held in
series on two beams, which are fished on each side of
the vessel (Fig. 1).

The fishery off the southeast coast began in inshore
waters, south of the Wexford coast, in the 1970s and
gradually expanded offshore and into the south Irish
Sea. Further expansion occurred in the 1990s and by
2002 the Irish fleet had increased its range, from the

            Figure 1.    Commercial spring loaded scallop dredges suspended on a beam being
                         deployed from a commercial fishing vessel.
Monitoring and assessment of scallops off the south east coast of Ireland

                  Figure 2.    Distribution of fishing by the Irish registered scallop fleet 1970-2005. Data
                               prior to 2000 is from information supplied by fishermen. Areas fished from
                               2000-2005 (in yellow) are derived from vessel monitoring system data (VMS)
                               supplied by the Irish Naval Service.

      Processing and products                                       the problem of marketing of muscle and roe but severely
                                                                    limits the sale of live scallop in the shell. To ensure that
      All scallops landed into Ireland are processed before sale.   consignments of product are within the regulatory limits
      Whole scallops are landed to processing plants, mainly        for ASP all landings, into Ireland, are monitored by
      in Kilmore Quay and Wexford town in Co. Wexford.              accredited laboratories in compliance with EC regulation
      Processing, or shucking, involves the extraction of the       2002/226.
      adductor muscle (white meat) with the attached gonads
      or roe from the shell. This product is sold fresh or frozen
      on the European market.

      Processing is a significant source of employment and
      potentially adds value to the raw product. In 2004 four
      processing plants operated in Wexford. These plants rely
      almost completely on supplies of scallop and the prawn,
      Nephrops norvegicus.

      One of the main constraints in the marketing of scallop
      is the legal requirement that levels of the toxin domoic
      acid (ASP), the causative agent of amnesic shellfish
      poisoning, in whole shellfish is below 20ug.g-1 of tissue
      as set down in Council Regulation (1997/61). Regulation
      2002/226 allows for sale of the product if the parts to
      be marketed contain less than 4.6ug.g-1 even if whole
      body concentrations exceeds 20ug.g-1. The toxin is
      produced by the diatom, Pseudonitzchia, which is
      ingested by scallop during feeding. There is, however,
      high temporal and spatial variability in the level of ASP
      in scallops. Approximately 90% of ASP occurs in the
      hepatopancreas and intestine of the scallop. This reduces
Monitoring and assessment of scallops off the south east coast of Ireland

Legislation governing the                                    2007-2011. Ideally this plan would apply to the entire
exploitation of scallop                                      area, over which the stocks are distributed, rather than
                                                             the area inside the 12nm limit only and to all fleets
                                                             fishing the stock. Effective management planning for
Technical measures and effort limitation
                                                             such stocks, which straddle national territorial limits,
Scallop fisheries in the Irish and Celtic Seas are managed
                                                             requires international concensus. The North Western
by a minimum legal landing size of 110mm shell width
                                                             Waters Regional Advisory Council, established in 2005,
in ICES areas VIIa and VIId and 100mm in other areas
                                                             provides, for the first time, a regional international forum
(Council Regulation 1998/850).
                                                             within which scallop fisheries management issues can be
In Ireland scallop fishing is licenced under the             discussed.
polyvalent and bi-valve segments of the national
fleet. The number of bi-valve licences is limited
                                                             Biology of scallop
and peaked in 2002 when twenty such vessels                  The life cycle of scallop is divided into two distinct
operated off the south east coast. Approximately             phases; a pelagic larval phase and a juvenile and adult
four polyvalent licenced vessels fished scallops off         benthic phase. Cross-fertilisation of gametes is external
the south east coast at that time and there were, in         and fertilisation success is related to the proximity of
total, approximately 528 dredges in the fishery. From        male and female spawners and, therefore, to population
2004 effort in ICES area VII, for vessels over 15 m          density of scallops on the seabed. The larval phase
in length, which included all of the fleet operating         lasts from 18-42 days depending on temperature
off the south east coast, was limited to a maximum           (Le Pennec 2003). Pedi-veliger larvae seek suitable
of 525012 kilowatt days at sea (Council Regulation           substrate on which to settle and from this stage scallops
2004/1415). Furthermore, to fully comply with this           are mainly sedentary, performing only small-scale (meters)
regulation, the effort by all scallop vessels over 10m       movements to avoid predators or to locate suitable
was limited to 109395 kilowatt days in the biologically      substrates. Growth may be related to temperature and
sensitive area (BSA) defined in Council Regulation           food supply and is relatively fast. In Irish waters scallops
1954/2003. The eastern limit of this area, at 7ºW,           attain a size of approximately 25mm shell height in the
reaches a point on the Irish coast at the Waterford          first year after settlement and 40mm at age 2. Significant
estuary and dissects the main scallop ground south of        spawning does not occur until the third or fourth year but
Waterford (Fig. 2). Regulation 2004/1415, therefore,         this pattern is spatially variable. Annual growth rings are
imposes different effort regimes on the eastern and          deposited, which allows age to be estimated, although
western sections of this stock, which is locally referred    in some areas the annual pattern of ring formation is
to as the B&H and Inshore grounds. Pursuant to this          unclear. Recruitment to the fishery occurs mainly at 4
regulation, national legislation (Statutory Instruments      years. Scallops may live for 10-15 years.
245/2005 and 294/2005) allowed for the allocation
of a restricted number of days at sea to be allocated        Landings
to individual vessels based on the power of the vessel       Landings of scallop, by Irish vessels, are reported in EU
and fishing track record in 2003-2004. These latter          logbooks, which are compiled by the Department of
two pieces of legislation were revoked by SI 464/2005,       Communications, Marine and Natural Resources, Dublin
which allowed the number of Irish registered fishing         (DCMNR). In this paper, for the period 2000-2004,
vessels over 10m in length, fishing for scallops, to         these data were crossed checked, for missing values,
be restricted. Furthermore, conditions on quantity of        with vessel monitoring system (VMS) data which is a
gear, total landings or days at sea could apply under        record of the complete fishing activity of each vessel in
this legislation.                                            each year. These data are managed by the Irish Naval
                                                             Service. The VMS data were ‘cleaned’ to remove non-
The Management Framework                                     fishing related activity, such as steaming to and from
In 2005 institutional arrangements for management of         port and other work, such as supervision of the laying
Shellfish in Ireland were agreed (Anon 2005). Within         of marine cables, which these vessels were periodically
this Framework a Scallop Management Advisory Group,          commissioned to undertake during the period. Dates for
comprising state and industry representatives, was           these alternative activities were obtained by interviewing
established in order to draw up management plans             skippers. Steaming was identified and removed by
for the fishery. In 2006 this group worked towards the       calculating vessel speed from the rate of change in vessel
production of a 5-year management plan for scallop           GPS position over time and removing all values greater
fisheries off the south east coast to cover the period       than 5 knots. VMS data, which did not have a related
Monitoring and assessment of scallops off the south east coast of Ireland

                              2000
                              1800
                              1600
                              1400
              Tonnes Landed

                              1200
                              1000
                               800
                               600
                               400
                               200
                                 0

25                                   Figure 3.   Landings of scallop into Ireland 1990-2004.

     figure for catch, were identified and the missing values               grid comprising a total plan area of 440 x 588km. The
     calculated. The missing values for the year, area and                  numerical model operated on an orthogonal Cartesian x,y
     vessel in question were predicted using General Linear                 grid in the horizontal and a 10 layer sigma co-ordinate grid
     Modelling (GLM) of catch rate data.                                    in the vertical. The model was calibrated using tidal guage
                                                                            data, meteorological data and seawater temperature data,
     Annual landings of scallop by Irish vessels averaged
                                                                            sourced from various organisations, as described by Berry
     668 tonnes per annum between 1990 and 1998
                                                                            and Hartnett (2005) for a number of locations throughout
     (Fig. 3). Landings increased to 1559 tonnes in 1999.
                                                                            the model domain.
     This increase resulted from an expansion of the fleet,
     especially in 1999, when a number of new bi-valve                      The model reproduces the observed physical oceanographic
     licences were issued. Fishing effort expanded to the                   features and circulation patterns that develop seasonally in
     western English Channel and the Irish Sea with the                     the Irish and Celtic Seas. The temperature fields, position
     introduction of these new vessels. Landings peaked at                  of thermal fronts and the circulation patterns, predicted by
     1891 tonnes in 2004. At a meat (muscle and roe) cut                    the model, correspond to the main oceanographic features
     out weight of 23% of live weight and a value of€15 per                 in the area described by Brown et al. (2003) and Young et
     kg of meats the value of the landings at first point of sale           al. (2004). Areas of stratified water develop in late spring
     was just over €6.5 million in 2004.                                    and are usually strongly established in July and August. The
                                                                            stability and extent of these areas vary annually depending
     The physical environment                                               on meteorological conditions. Anti-cyclonic weather, with
                                                                            low wind speeds and high solar radiation, increases the
     Temperature and circulation                                            vertical temperature gradient and the stability of the water
     Seabed temperatures and current speeds may have an                     column. Even under those conditions, however, other areas
     important regulatory function on the recruitment and                   remain mixed because of stronger currents and associated
     growth of scallops (Shumway 1991). The current and                     vertical turbulence. There is a temperature discontinuity
     temperature fields in an area can, therefore, regulate the             or thermal front in areas where mixed and stratified
     productivity of scallop stocks. A hydro-advection model of             waters meet (Fig. 4). An important resultant feature
     the Irish and Celtic Sea areas was developed in order to               of this system is the trapping of a dome of cold water,
     identify how stocks are connected through larval dispersal             below the thermocline, where seabed temperatures
     and to correlate predicted temperature and current stress              remain below 12ºC in summer. This bottom water,
     fields, at the seabed, with the biological characteristics             beneath the thermocline, is 4-5ºC colder compared to
     of scallop including growth and levels of Domoic Acid.                 bottom water in areas that remain mixed (Fig. 4, Brown
     Various simulations of larval dispersal, which also involved           et al 2003, Young et al 2004). The model predicted
     allocation of different behavioural characteristics to scallop         horizontal differences in bottom water temperature of
     larvae, were run by coupling a particle tracking module to             4-5ºC (11-15ºC) on spring tides but these differences
     the hydrodynamic model. These simulations are described                were up to 7ºC (11-17ºC) on neap tides because
     in Berry and Hartnett (2005). The hydrodynamic model                   of the short-term effect of solar heating on shallow
     was developed by partitioning the study area into a 2x2km              water inshore. Differences between surface and bottom
Monitoring and assessment of scallops off the south east coast of Ireland
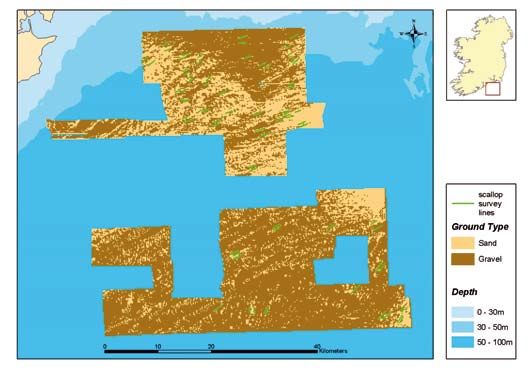
temperatures in the area vary, therefore, between 0 summer. The area of mixed water along the coast
(mixed water) and 7ºC (stratified water) depending on increases on spring tides. The main current flows parallel
the opposing effects of vertical mixing of the water to the fronts on the mixed side. In summer, when the
column and solar heat input. thermal structures are established, the main current flows
north from the Bristol Channel towards St. George's
The exact location of the fronts and the relative areas
Channel, projects to a varying extent into the southern
of mixed and stratified waters vary seasonally, annually
Irish Sea and then turns south west from the Tuskar area
and on the spring-neap tidal cycle. The front oscillates
along the Irish south coast and into the Celtic Sea. The main
in horizontal position on the spring-neap cycle during
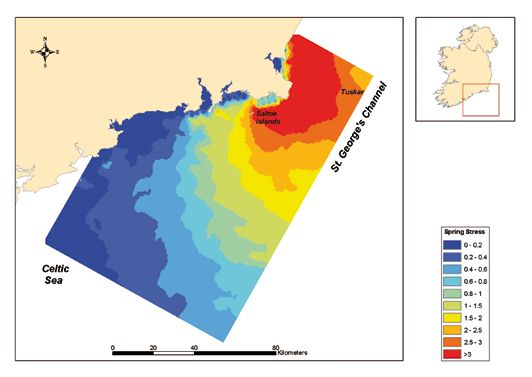
4a.
4b.
Figure 4. Bottom seawater temperature fields on spring and neap tidal cycles off the
south east coast of Ireland predicted by a hydrodynamic model. Levels of
ASP in scallops in 2003 are shown in the spring tide map.
Monitoring and assessment of scallops off the south east coast of Ireland

current flows are jet like or funnelled in a stream between       to sediment type and small scale topographic relief at the
the offshore front and the south coast of Ireland particularly    seabed on Browns Bank (Nova Scotia, Canada) as indicated
if the front is well established. This continues in a clockwise   by the acoustic backscatter signal derived from multibeam
flow around the south and southwest coasts. Earlier in the        data.
season this flow is weaker as the stream flows in a broader
                                                                  On the Celtic Voyager surveys a Simrad EM 1002
band along the south coast because the offshore front is
                                                                  echosounder was used to generate overlapping swathes
weakly developed at this time.
                                                                  of sonar coverage within the scallop beds off the southeast
Scallops occur throughout the area and are exposed                coast. These data were subsequently post processed
to different temperature regimes depending on their               using CARIS HIPS (Hydrographic Information Processing
location. Scallops offshore in the southwest of the area          System) and corrected for beam angle to generate acoustic
live at temperatures of 12ºC in summer compared to 16-            backscatter maps of the seabed. Further details can be
18ºC in inshore areas. This has implication for growth,           found in Sutton and O’Keeffe (2005). The acoustic images,
accumulation of biotoxins and for management of the               together with ground validation data, in the form of
fishery as described on page 7.                                   sediment samples and digital images of the seabed, show
                                                                  that the seabed structure varies on a variety of spatial scales.
Sediment structure                                                Broadscale regional distribution of sands and gravels can be
The type of sediment and turbulence at the water sediment         recognised. Additional smaller scale features include rock
interface are the main factors that affect the settlement         outcrops and, particularly, sand dunes 200-300m in length
of scallop pedi-veligers. Other physical conditions such as       and 50-100m wide. These are composed of medium coarse
siltation and biotic factors, such as presence of adults, may     sands and are aligned in a northwest to southeast direction
be important (Shumway 1991).                                      in accordance with prevailing currents. Large areas of gravel
                                                                  occur throughout the area (Fig. 5). This gravel area, defined
Seabed mapping surveys, using MULTIBEAM acoustic
                                                                  as acoustic backscatter values greater than –45 decibels, is
methods, were undertaken on the RV Celtic Voyager in
                                                                  in fact a mixed facies of gravel, cobble and rock but is not
2002-2004, to characterise and describe the distribution of
                                                                  readily distinguished spatially because of patchiness at very
the main sediment facies in the area that may be suitable
                                                                  small scales. Areas with lower backscatter values are largely
for scallop settlement and habitation. Kostylev et al. (2003)
                                                                  sands. In all areas, patches of sand are interspersed with
showed that the pattern of distribution and abundance of
                                                                  areas of gravel, the relative proportion of each substrate
Placopecten magellanicus (the giant scallop) was related

             Figure 5.     Acoustic backscatter map of the seabed off the south east coast showing 2
                           main acoustic classes defined here as sand and gravel. Scallop survey positions
                           in 2002-2004 are shown by the green lines.
Monitoring and assessment of scallops off the south east coast of Ireland
varying throughout, resulting in a mosaic pattern. This suitability of the bed for scallops. For instance Dare et al.
pattern has implications for the distribution of scallops, (1994) found that scallops were confined to areas where
catch rates in the fishery and for the interpretation of catch the shear stress on the seabed was less than 10 dynes.cm-2
and effort data. in the English Channel.
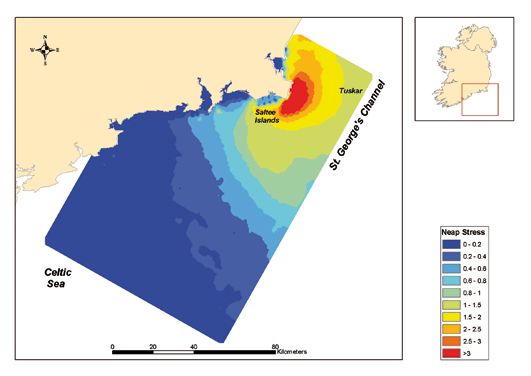
Shear stress values were generated from the hydrodynamic
Shear seabed stress
model. Stress values, which are highly correlated with
Bottom currents flowing over the seabed generate forces
bottom currents, are highest in the western Georges
on the sediment that can suspend particles, increase
Channel and particularly near the southeast coast. They
sorting of the sediment and alter the sediment structures.
decline in a northeast to southwest direction off the south
Obviously this could have a significant impact on the
6a.
6b.
Figure 6. Shear stress fields at the seabed on Spring and Neap tides off the
south east coast of Ireland. Units in Newtons.m-2
Monitoring and assessment of scallops off the south east coast of Ireland

coast. As expected shear stress values increase on the           populations. These populations exist, therefore, as a
spring, compared to the neap, tidal cycles and these higher      metapopulation. Certain populations may be more critical
stress levels extend southwest into the Celtic Sea (Fig.6).      to the survival of the metapopulation than others if
                                                                 they supply larvae to other beds. Such populations are
Stock Structure                                                  termed source populations. Others may be sustained
                                                                 entirely by these source populations and contribute no net
Larval sources and sinks                                         contribution to population maintenance themselves if their
Scallops settle onto specific types of substrate such as sands   spawning products are dispersed to areas where survival
and gravels and their distribution is limited and determined     is not possible. These populations are sink populations
by the distribution of these sediments (Shumway 1991).           (Lipcius et al. 2001)
The structure of the stocks, or the connection between
scallop beds, is determined by the dynamics of larval            Connectivity between stocks
dispersal from spawning areas as the juvenile and adult          Scallop larvae are distributed throughout the water column
phases are largely sedentary. Ocean circulation patterns,        in areas of mixed water if the vertical turbulent velocities
coupled with the behaviour of larvae, result in a given          exceed any directional swimming capacity of the larvae. The
scale and direction of transport or dispersal and determines     behaviour of larvae, in response to thermoclines or vertical
how stocks are interconnected. Many ‘populations’ are            turbulence, is not well known. Directed and spiralling
not completely isolated or completely interconnected. A          upward swimming occurs in early larval life and larvae are
network of varying levels of connectivities can, therefore,      thought to occur mainly above the thermocline where one
exist which link, to different degrees, the adult spawning       exists. Directed downward swimming and passive sinking

                            Figure 7.     Distribution of passively drifting scallop larvae
                                          on May 30th following 30 days of dispersal
                                          from 9 release locations (square symbols) in the
                                          Celtic and Irish Seas in primarily southerly wind
                                          conditions (using wind data from May 1995).

10
Monitoring and assessment of scallops off the south east coast of Ireland
facilitates the settling of late stage larvae. The duration of early or late spawning will also be different. The main
the larval cycle depends on temperature and varies from uncertainty, in predicting how larvae are transported,
18-42 days (Le Pennec 2003). is the vertical migratory behaviour and position of the
larvae in the water column. Larvae distributed close to
The scale and direction of dispersal of ‘inactive’ larvae,
the surface will follow a wind driven path modified to
or larvae which were given no behavioural characteristics,
varying degrees by physical oceanographic features in the
was predicted by coupling the particle tracking model
area. Larvae remaining deeper in the water column follow
with the 10 layer hydrodynamic model described above.
current driven and wind independent flows.
The connectivity between known beds of scallop were
investigated by releasing 100 ‘larvae’ from 9 specific Landings per unit effort (LPUE)
locations (Fig. 7) into the model on May 1st 2003 after
running the model for the previous 5 months to develop Landings per unit effort (LPUE) data were derived from
the correct salinity and temperature fields throughout private diaries of vessel owners and from EU logbooks for
the model domain. Prevailing winds during the simulated the period 1994-2004. LPUE from private diary data were
dispersal were south westerly. Scallop larvae released in May expressed as kgs per dredge per hour. LPUE derived from
in the Irish Sea and Celtic Sea are dispersed widely. However, EU logbook data were expressed as scallops per dredge per
scallop populations in the eastern Irish Sea and south of the day in a statistical rectangle, as the number of hours fished
Bristol Channel appear to be isolated from other stocks. each day was unknown. However, VMS data was used to
Transport of larvae across St. Georges Channel does occur calculate fishing time as described above and the logbook
but can be in both directions depending on the location data was, therefore, re-expressed as scallops per dredge
of release. Larvae released in the Tuskar area, in southerly per hour. This also allowed the data to be aggregated to
winds, can be transported north but can also be entrained different spatial scales. As the VMS reported vessel position
in the main cross channel and southwesterly current flows only every 2 hours the error in estimated fishing time per
and be re-distributed off the south Wexford coasts. day could have been as high as 4 hours.
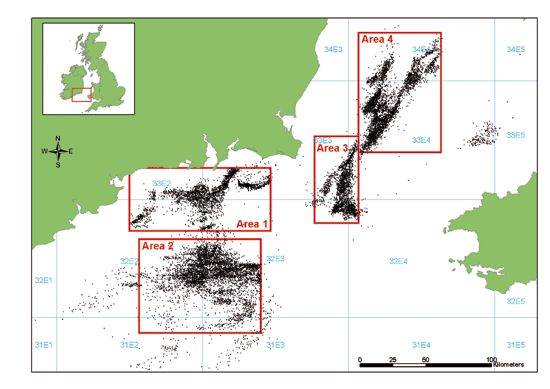
Other simulations of larval transport off the southeast The VMS data for all vessels for the period 2000-2004,
coast under different scenarios of larval behaviour, wind indicating the spatial distribution of fishing effort, is
direction and spawning time are described in Berry shown in Fig. 8. The main fishing areas were off the
and Hartnett (2005). Current flows in the area vary south coast (Inshore and B&H grounds – Area 1 and 2
seasonally, depending on the position of the thermal respectively) and in the south Irish Sea (Barrels and Tuskar
fronts, suggesting that the transport of larvae from grounds – Area 3 and 4 respectively) (Fig. 8).
Figure 8. Distribution of fishing by the Irish scallop fleet off the south east coast 2000-
2004. Data were derived from vessel monitoring system (VMS) information
sourced from the Irish Naval Service, Hawlbowline, Co. Cork.
11Monitoring and assessment of scallops off the south east coast of Ireland
1.9 2.1
Area 1 GLM estimate (diaries)
Area 2 18
1.7 1.9 Scale data average (diaries)
17
1.7 GLM estimate (logbooks)
Bottom water temperature
1.5 16
1.5
1.3 15
LPUE Index
LPUE Index
1.3 14
1.1
1.1 13
0.9 12
0.9
11
0.7
0.7
GLM estimate (diaries) 10
0.5 Scaled data average (diaries) 0 0.5
0.5
GLM estimate (logbooks)
Scale data average (logbooks)
0.3 0.3
1993 1994 1995 1996 1997 1998 1999 2000 2001 2002 2003 2004 2005 1993 1994 1995 1996 1997 1998 1999 2000 2001 2002 2003 2004 2005
5.0
2001
4.5
2002
2
4.0
Area 3 & 4 3.5 Summary 2003
1.8 3.5 2004
Sqrt (density m2)
1.6 2005
3.0
3
1.4 2.5
Kg *dredge* hour
1.2 2.0
LPUE Index
2.5
1 1.5
0.8 1.0
2
area 1
0.6 0.5
area 2
0.4 GLM estimate (logbooks+VMS) area 3 and 4 0.0
1.5
Scaled data average (logbooks+VMS) -70 -65 -6
0.2 private diaries_area 1
GLM estimate(logbooks)
Scaled data average (logbooks) private diaries_area 2
0 1
1996 1997 1998 1999 2000 2001 2002 2003 2004 2005 1993 1994 1995 1996 1997 1998 1999 2000 2001 2002 2003 2004 2005
Figure 9. Landings per unit effort indices for scallop for 4 areas (Fig. 8) off the south east coast 1994-
2004. Estimates are observed (data) and standardised (GLM) scaled annual averages. The
summary panel data is not scaled.
LPUE data from both logbooks and private diaries were 2001 survey showed that scallop catch rates varied over
standardised for potential bias due to vessel and weather broad geographic scales with higher catch rates occurring
effects using a General Linear Model (GLM) and scaled on large gravel patches in the centre of the survey
to long-term averages. Details of the model are given in domain south of the Waterford estuary. This broadscale
Hervas et al. (2006). Data were analysed separately for pattern could, however, be due to larval supply or higher
each of the four main centres of fishing activity off the settlement of larvae in this area rather than any functional
south east coast (Fig. 8). The GLM of the private diaries relationship between scallop abundance and sediment
showed a slow decline in LPUE in Area 1 from 1995- type. Surveys in 2002-2004 were, therefore, specifically
2004 and a somewhat steeper decline in Area 2. By designed to investigate the relationship between catch
2003 both observed and standardised LPUE were about rates and acoustic backscatter at spatial scales where
20-50% lower than in the mid 1990s. The logbook data variation in larval supply was unlikely to operate. Pairs
from 2000-2004 showed an increase in LPUE in Area of stations placed close together, and usually less than
1, especially after 2001. In Area 2 LPUE, from logbook 200m apart, were identified from the acoustic backscatter
data, was relatively stable. LPUE increased in Area 3 and maps so that the backscatter profile of each station in
4 from 1997-2000 and fluctuated, thereafter, depending each pair contrasted (Fig. 5). Catch rates at each station,
on the source of data (Fig. 9). in all station pairs, were then compared. These surveys
confirmed that a strong relationship existed between
Correlation between biological and acoustic backscatter and scallop catch rates. In 2005 the
physical variables acoustic backscatter map was, therefore, used to establish
a random stratified survey. Two strata, representing sand
Distribution and relative abundance of scallop and gravel sediments, were established within which
and sediment structure stations were randomly allocated to a grid of cells each
Annual scallop surveys were undertaken between 2001- cell measuring 4 km2. As the abundance of scallop in
2005. The first survey, in 2001; in Areas 1 and 2, covered a the 2002-2004 surveys was at least 4-5 times higher on
regular grid of stations, known to be fished commercially, in gravel 80% of stations in the 2005 survey were allocated
order to identify the distribution of scallops in the area. The to gravel (Hervas et al. 2006).
12Monitoring and assessment of scallops off the south east coast of Ireland
10.0
Gravel (Area 1)
9.0
Sand (Area 1)
8.0 Gravel (Area 2)
Sand (Area 2)
7.0
Density scallops (nos. m-2)
6.0
5.0
-90
-95 4.0
-100 3.0
0-110
0-120 2.0
2.5 1.0
0.0
2001 2002 2003 2004 2005
Figure 10. Catch rates of scallop (numbers m-2 uncorrected for dredge efficiency)
on gravel and sand (derived from acoustic backscatter values) substrates
in Area 1 and 2 during annual surveys 2001-2005.
During surveys the size distribution of scallops was data and commercial catch rate data if backscatter
measured and a sub-sample of shells were aged at each values are available by dredge tow. Simple regression
station in order to identify spatial variation in size and diagnostics or analysis of co-variance (backscatter) of
age composition and growth rates. the relationships could provide useful stock indicators.
The elevation of the regression of catch rate on
Scallop catch rates on gravel, in both Area 1 and 2, were
backscatter is an index of stock abundance over all
substantially higher on gravel than on sand in all years
ground types and should change if scallop density
except 2001 where the abundance on sand was slightly
is reduced by fishing or environmental effects on
higher. The2000 2001 survey tracks were, however, not
1800 recruitment. Analysis of residuals from this regression
specifically allocated to sand or gravel substrates. Their
1600 may point to particular backscatter or ground types
acoustic profiles were estimated after the survey and
1400 where the density is changing due to local depletion by
when the acoustic map became available (Fig. 10).
1200 fishing or other environmentally mediated changes in
Square root1000transformed catch rates, calculated for the stock distribution.
the area along800the dredge line, increased linearly with
The relationship between catch rates and backscatter is
average backscatter
600 values, and on average explained
unlikely to be linear outside the range of values shown
54.7% of variability
400 in scallop catch rate (Fig. 11). The
here. There is a limited range of sediment types on
linear relationship
200 between catch rate and backscatter
which scallops can survive and their density will decline
values suggests0 that scallops discriminate, not only
at the extremes of this range. The functional relationship
between sand and gravel but also between different
between the acoustic backscatter and scallop density
grades of these sediments.
may, therefore, be defined as a quadratic or other non
-25 Different catch rates on sand and gravel might arise linear function which may become apparent if a broader
because of differential survival of settling larvae, substrate range of sediments becomes available for analysis.
selection by settling larvae or lateral movement of juvenile
and adult scallop to preferred sediments. As dredge Growth, temperature and shear stress
efficiency is lower on high backscatter grounds (Hervas, Geographic variation in growth rate of scallops has been
unpublished data) the substrate related differences in reported in many fisheries. This variability is likely to be
actual density are probably greater than observed. environmentally determined in most cases (Orensanz et
The relationship between acoustic backscatter and scallop al. 1991). Off the southeast coast of Ireland the growth
density provides a means of standardising both survey of scallops is highest south of the Saltee Is and south
1310
0 0.5 1 1.5 2 2.5 1.0
0.0
Monitoring and assessment of scallops Hydrodynamic bottom
off the south east coaststress
of Ireland
200
2005
5.0
2001
4.5
2002
4.0
2003
3.5 2004
Sqrt (density m )
2005
Sqrt (density m-2) 2
3.0
2000
1800
2.5
1600
1400
2.0
1200
1000
1.5 800
600
1.0 400
200
0.5 0
0.0
-70 -65 -60 -55 -50 -45 -40 -35 -30 -25
Acoustic Backscatter
Acoustic backscatter
Figure 11. Relationships between acoustic backscatter (decibels) and scallop density
(square root transformed) estimates in Area 1 and 2 combined from annual
05
surveys in 2001-2005.
Figure 12. Absolute size of scallop at age 5 off the south east coast in 2001.
14Monitoring and assessment of scallops off the south east coast of Ireland
ries)
18
e (diaries)
10.0
17
books)
temperature 9.0
16
(ºC)
8.0
temperature
15
7.0
14 6.0
water
13 5.0
Bottom
Bottom
80-90
12 90-95 4.0
95-100 3.0
11 100-110
110-120 2.0
10
0 0.5 1 1.5 2 2.5 1.0
Hydrodynamic bottom stress (newtons m-2)
Hydrodynamic bottom stress 0.0
Figure 13. Relationship between size at age 5, bottom temperature and shear
2004 2005 stress on the seabed.
5.0
east of this area in offshore waters. Growth is slower offshore direction and east to west. The Fmax reference
in the west of the area. 2001These differences are quite point, however, does not take into account impacts of
4.5
significant resulting in up
2002to 30mm difference in size at fishing mortality on stock abundance or recruitment and
age 5 (Fig.4.012). should be used in combination with other reference points
2003
or regulatory measures in the development of fishery
Highest growth rates occur in areas of high shear bed
3.5 2004 management strategies for the area.
stress (stronger currents) and highest water temperatures.
Sqrt (density m2)
High temperatures alone 2005
do not lead to high growth if
3.0 Biotoxins, growth and temperature
seabed currents are low. This is evident from the relatively 2000
Levels of Domoic acid (ASP) were measured in scallops
low growth 2.5rates in the northwest of the survey area 1800
collected during the 2003 survey (see Fig. 5) by Bogan 1600
(Fig. 12), which have high temperatures especially on neap
et al. (2005). As the toxin is present due to ingestion of 1400
tides (Figs. 2.0
4 and 13) but low shear bed stress (Fig. 6 and
the diatom Pseudonitzchia the levels of the toxin may be 1200
13). Higher growth rates offshore in the south east of the
related to environmental conditions, which promote the 1000
survey area1.5appear to be related to strong seabed currents 800
development of this species of diatom and which increase
and relatively high temperature caused by the jet like flow 600
the feeding rate of scallops.
originating 1.0
from St. Georges Channel and which maintains 400
a mixed water column (and higher seabed temperatures) Levels of ASP, in all tissues combined, exceeded the legal 200
0.5
in this area compared to bottom water beneath the limit of 20 mg.kg-1 in the majority of stations. However, 0
thermocline in the west of the area. levels were below the legal limit in the majority of stations
0.0
where the hydrodynamic model predicted that the water
-70 -65 -60 -55 -50 -45 -40 -35 -30 -25
Growth and spatial management of yield column was stratified and, therefore, where bottom
Acoustic backscatter
Growth and natural mortality data, in relation to size at temperatures were less than 12ºC in August (Fig. 4). Three
first capture or minimum landing size, can be used to stations on the western side of this area exceeded the limit
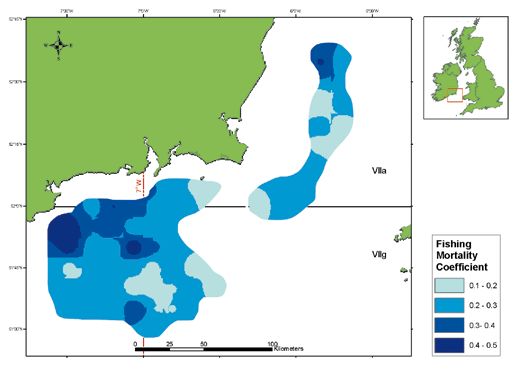
4 2005 determine fishery management reference points, or the but here ASP was less than 30 mg.kg-1 compared with
fishing mortality rate (Fmax) that optimises the yield per much higher levels inshore. On the eastern side of this cold
recruit. Values of Fmax, for fishing areas 1 and 2, were water offshore area levels ranged from 30-40 mg.kg-1.
calculated for each 5x5 square mile area using spatially Temperatures in this area increase on neap tides due to
referenced growth rate data from annual scallop surveys movement of the front. Although the observed pattern
(Hervas et al. 2006). Estimates of Fmax are higher where does not explain the mechanisms which give rise to high
growth is relatively low in relation to the assumed annual levels of ASP they show that, for this area, low levels of
rate of natural mortality (M) of 0.2 (Fig. 14). Spatial the toxin are associated with low seabed temperatures
management of fishing effort, that optimises yield per and to some degree low current speeds both of which are
recruit, should therefore delimit fishing activity along negatively correlated with the growth rate and feeding
the main gradient in Fmax, which is mainly in the inshore rate of scallops.
15Monitoring and assessment of scallops off the south east coast of Ireland
Figure 14. Values of Fmax, or fishing mortality that optimises scallop yield per
recruit, calculated using growth data collected between 2001-2004 in
each 5 x 5 mile area off the south east coast of Ireland.
Implications for fisheries management Scallop abundance and sediment structure
Acoustic backscatter, which is an indicator of sediment
The physical environment, as shown above, controls composition, accounted for approximately 55% of
important aspects of the biology of scallop. These variability in scallop abundance off the south east
processes operate at various geographic scales and coast. The acoustic backscatter map can be used to
have implications for the way in which scallops may be improve, very significantly, the catch rates of commercial
assessed and managed. vessels by guiding the vessel along particular tracks
characterised by the highest backscatter values and
Stock structure and sources of larvae avoiding areas (sand) which contain few if any scallop.
Physical oceanographic processes determine broadscale Although the fleet does this on a broad scale basis it
dispersal of larvae and inter-connection between scallop cannot search efficiently for gravel patches in areas of
beds. This information should be used in developing mixed ground. Within areas where gravel predominates
management strategies and to ensure persistence of all the ground is mixed with varying proportions of sand.
component ‘stocks’ in the metapopulation. Scallop beds Commercial fishing effort in these areas, therefore,
that are important sources of larvae can be conserved involves dredging over varying amounts of sand for
more stringently than areas which act as sinks for larval little benefit. The acoustic backscatter map can reduce
populations in area based management. This would dredging time, reduce potential impacts of the fishing
mean lower fishing effort and maintenance of higher gear on the sea bed and lower fishing costs per unit of
scallop densities in source populations. In this study scallops landed. Reduction of dredging time as far as
the Tuskar area was identified as a source area for the possible should also be a precautionary management
south east coast and the general direction of dispersal objective because of the possible impacts of dredging on
was southwest from the south east coast. In this area, recruiting scallop, incidental mortality of scallops which
therefore, recruitment may be sourced mainly from come in contact with the dredge, but are not captured,
scallop beds in the east and north east, while the west and potential damage to the habitat into which scallops
and south west of the area may be less important. recruit. These are important potential benefits in an
Regulation of fishing effort in the west and south west economic environment of increasing costs and declining
may therefore be less important considering also that catch rates, which had already contributed to the decline
growth rate is also lower in this region (see below). of the Irish commercial fleet in 2004. The introduction
16Monitoring and assessment of scallops off the south east coast of Ireland
of technology that increases the catching capacity of stocks recover from fishing. Assuming that natural
fishing vessels, however, obviously needs to be balanced mortality rates are not spatially variable, higher fishing
by the introduction of measures that adequately protect effort should be placed in areas where growth is slow.
scallop stocks. Off the south east coast, these areas are to the west
and southwest of the scallop beds. Such areas are
Measurement of catch rates also less important as sources of larvae in the region
The small scale variability in scallop abundance shown suggesting that high fishing effort would not necessarily
here indicates the importance of collecting spatially be detrimental to recruitment. These observed patterns
referenced catch and effort data if these data are contradict the current regulation (Council regulation
to be used to show trends in stock abundance. The 1415/2004) which imposes more rigorous effort control
catch rate data, although standardised for potential west of 7ºW where growth is slow. Minimum sizes,
weather and vessel effects on catch, yielded somewhat rotational area management and other management
ambiguous results and varied according to the level measures all need to take into account both the spatial
of aggregation and the source of data. This is almost variability in growth and the relative importance of
certainly due to spatial variability in scallop density and different areas as a source of larvae to the wider area.
serial depletion of fishing areas over small spatial scales.
The apparently predictable relationship between levels of
Acoustic backscatter (and sediment structure) at least
biotoxin and bottom seawater temperatures in particular
partially determines scallop abundance over broad and
open the possibility of marketing live scallop from this
fine spatial scales and can be used to provide annual
area. Although testing would still be mandatory the
standardised indices irrespective of location of fishing if
probability of failing the test could be sufficiently low to
the data are standardised for the backscatter effect. This
encourage investment in onshore live holding facilities
method could also be applied to commercial catch rate
and marketing of whole live or fresh scallop.
data if the track that the vessel followed was precisely
known. VMS data provides this information although
Summary
the frequency with which the ships position is logged
This paper has given an overview of a multidisciplinary
would need to be reduced to minutes rather than the
project designed to improve the methods for assessment
two hour frequency currently used. Catch data would
and management of scallop fisheries in Ireland.
then need to be associated with the VMS track as in this
Significant progress towards sustainable management
report. This is time consuming and a more direct way of
of these fisheries now seems possible because of
achieving the same result is to use electronic logbook
recent developments in research, policy and fleet
systems that automatically logs the ships position at
management. Legislation in 2005 allowed for the
user defined frequencies and electronic logging and
controlled entry of vessels to the fleet. Decommissioning
transmission of the associated catch. Such a system is
and restructuring of the fleet in 2005 reduced effort
now available for use on Irish scallop vessels (project
potential to more sustainable levels. Seabed maps, which
number 01SMT102, Marine Informatics International
will be extended in 2006, are available to significantly
Ltd. and BIM). Provision of data at individual tow level
improve the economic efficiency of scallop vessels and
would allow interpretation of data at fine spatial scales
in parallel reduce potential impacts of dredging on the
and increase the options for stock assessment. Depletion
environment and on scallop recruitment. A database
analysis of spatially referenced catch rate data is one
of biological information on scallop, which allows for
such promising method for scallops (Hervas et al. 2006).
new approaches to resource assessment is available. A
In addition the distribution of catch rates or densities
model of stock structure and the relative importance of
can be analysed spatially and the concentration profile
different beds as sources of recruitment off the south
of scallop density can be monitored. This is important as
east coast has been developed. Finally, a co-operative
high density areas can be fished down with a resultant
Management Framework was established in 2005,
decrease (depensation) in spawning success.
within which the Scallop Advisory Committee, using
the developments outlined in this paper, can develop
Growth rates, yield and biotoxins
informed management plans for the fishery.
Growth rates of scallop are related to environmental
temperature and current strength at the seabed. These
variables control the metabolic and feeding rates and
supply of food to scallop. Spatially variable growth rates
affect the optimum fishing effort that will maximise
yield per recruit and the rate at which commercial
17Monitoring and assessment of scallops off the south east coast of Ireland
References Lipcius, R.N., Stockhausen, W.T. and Eggleston, D.B.
2001. Marine reserves for Caribbean spiny lobster:
Anon 1995. The Management of Ireland’s inshore empirical evaluation and theoretical metapopulation
fisheries: The Framework for Shellfisheries; structures, recruitment dynamics. Marine and Freshwater Research,
functions and process. Department of Communications, 52, 1589-98.
marine and Natural Resources and BIM, Dublin, 15 pp.
Mason, J. 1983. Scallop and queen fisheries in the British
Berry, A. and Hartnett, M. 2005. An investigation into Isles. Farnham, Surrey, England. Fishing News Books.
scallop larvae transport and settlement off the southeast
coast of Ireland. Final report of project 01SMT107, BIM, Orensanz, J.M., Parma, A.M. and Iribarne, O.O. 1991.
Dublin. Population dynamics and management of natural stocks.
In: Shumway, S. (ed.) Scallops: Biology, Ecology and
Bogan, Y.M., Bender, K., Hervas, A., Kennedy, D.J., Aquaculture. Elsevier (Amsterdam and New York).
Slater, J.W., Hess, P. (2006). Spatial variability of domoic
acid concentrations in king scallops Pecten maximus off Shumway, S. 1991. Scallops: Biology, Ecology and
the southeast coast of Ireland. Harmful Algae (in press) Aquaculture. Elsevier (Amsterdam and New York).
doi:10.1016/j.hal.2006.05.004 Smith, S.J. and Rago, P. 2004. Biological reference points
Brown, J., Carrillo, L., Fernand, L., Horsburgh, K.J., Hill, for sea scallops (Placopecten magellanicus): the benefits
A.E., Young, E.F., and Medler, K.J. 2003. Observations of and costs of being nearly sessile. Canadian Journal of
the physical structure and seasonal jet-like circulation of Fisheries and Aquatic Sciences 61, 1338-1354.
the Celtic Sea and St. George's Channel of the Irish Sea. Sutton, G. and O’Keeffe, E. 2006. Seabed mapping:
Continental Shelf Research, 23, 533-561. Multibeam bathymetry, backscatter and video imaging
Dare, P.J., Darby, C.D., Durance, J.A. and Palmer, D.W. of the seabed in the south east coast scallop grounds.
1994. The distribution of scallops, Pecten maximus, Final report of project number 01SMT107 Annex II. BIM
in the English Channel and Celtic Sea in relation to Dublin, 20pp.
hydrographic and substrate features affecting larval Young, E.F., Brown, J., Aldridge, J.N., Horsburgh, K.J.,
dispersal and settlement. pp. 20-27, In: Bourne, N.F., and Fernand, L. 2004. Development and application of
Bunting, B.L. & Townsend, L.D. (eds.). Proceedings of a three-dimensional baroclinic model to the study of the
the 9th International Pectinid Workshop, Nanaimo, B.C., seasonal circulation in the Celtic Sea. Continental Shelf
Canada, April 1993, Vol. 1. Canadian Technical, Report Research, 24, 13-36.
of Fisheries and Aquatic Sciences, 1994
Fifas, S. 1991. Un modele empirique de capturabilite
pour le stock de coquilles Saint-Jackues (Pecten maximus
L.) en Baie de Saint-Brieuc (Manche, France). CIEM,
Shellfish Committee, CM 1991/K:37, 20 pp.
Hervas, A., Tully, O., O’Keeffe, E. and Hickey, J. 2006.
The king scallop (Pecten maximus) fishery: Analysis of
the resource in 2004-2005. BIM, Dun Laoghaire, Co.
Dublin, 77pp.
Howell, T.R.W., Davis, S.E.B., Donald, J., Bailey, N. and
Tuck, I. 2003. Report of Marine Laboratory Scallop Stock
Assessment. Fisheries Research Services Internal Report
No 07/03, Marine Laboratory, Aberdeen, Scotland,
140pp.
Kostylev, V.E., Courtney, R.C., Robert, G. and Todd, B.J.
2003. Stock evaluation of giant scallop (Placopecten
magellanicus) using high-resolution acoustics for seabed
mapping. Fisheries Research, 60, 479-492.
Le Pennec, M. 2003. The pelagic life of the pectinid
Pecten maximus – a review. ICES Journal of Marine
Science, 60, 211-223.
18You can also read