AUCKLAND EQUESTRIAN FACILITY PLAN - Prepared by Morvern Group Limited - Aktive Auckland
←
→
Page content transcription
If your browser does not render page correctly, please read the page content below
AUCKLAND             Prepared by

EQUESTRIAN FACILITY           Morvern Group
                              Limited

              PLAN
               October 2014

                                       28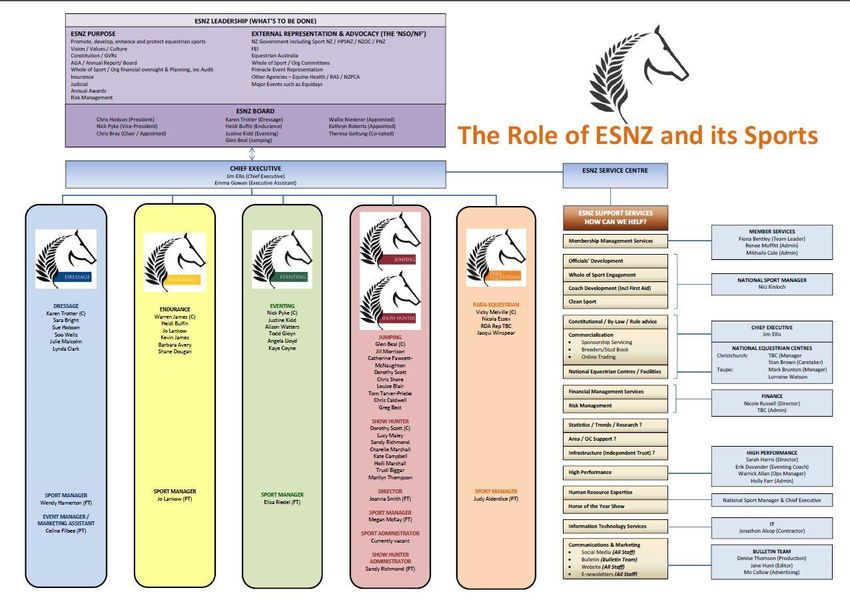
Contents
Executive Summary................................................................................................................................. 4
1.     Introduction .................................................................................................................................... 8
     1.1      Introduction ............................................................................................................................ 8
     1.2      Process .................................................................................................................................... 8
2.     Overview of Equestrian Sports ..................................................................................................... 10
     2.1      Equestrian Sports New Zealand disciplines .......................................................................... 10
     2.2      Pony Clubs ............................................................................................................................. 10
     2.3      Polo ....................................................................................................................................... 10
     2.4      Polocosse .............................................................................................................................. 10
3.     Issues and Challenges for Current and Future Provision .............................................................. 11
     3.1      Security of use and availability of land and facilities ............................................................ 11
     3.2      Quality of land and facilities ................................................................................................. 11
     3.3      Size of facilities ...................................................................................................................... 12
     3.4      Capacity to hold events......................................................................................................... 12
     3.5      Access to training and exercise facilities............................................................................... 12
     3.6      Relationship with Auckland Council...................................................................................... 13
     3.7      Barriers to growing participation .......................................................................................... 13
4.     Current Facility Provision .............................................................................................................. 14
     4.1      Equestrian sports .................................................................................................................. 14
     4.2      Pony clubs ............................................................................................................................. 16
     4.3      Role of Auckland Council in provision................................................................................... 17
5.     Current Regional Participation...................................................................................................... 20
     5.2      Horse riding participation overview ..................................................................................... 20
     5.3      ESNZ membership ................................................................................................................. 20
     5.4      Polo participation .................................................................................................................. 20
     5.5      Polocosse membership ......................................................................................................... 21
     5.6      Pony club membership ......................................................................................................... 21
     5.7      Summary of organised sport horse participation ................................................................ 22
6.     Current Regional Event Level Activity ........................................................................................... 23
     6.1      ESNZ discipline activity levels................................................................................................ 23
     6.2      Polo and Polocrosse event activity ....................................................................................... 24
     6.3      Pony club activity levels ........................................................................................................ 24
7.     Projected Demand ........................................................................................................................ 25

                                                                                                                                           2|Page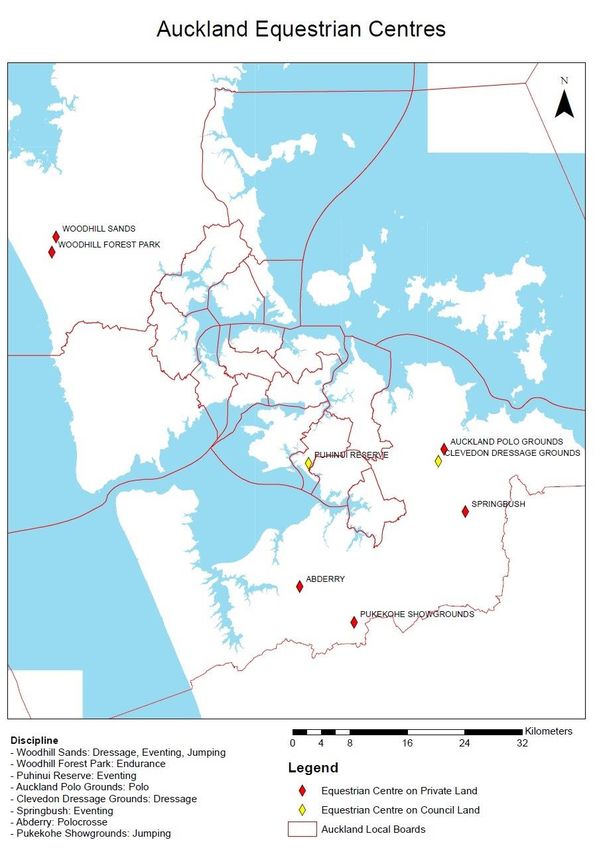
7.1       Auckland’s population .......................................................................................................... 25
        7.1.1         Population projections .................................................................................................. 25
        7.1.2         Auckland’s age profile ................................................................................................... 26
        7.1.3         Auckland’s growing ethnic diversity ............................................................................. 27
     7.2       Auckland Plan and growth .................................................................................................... 28
     7.3       Future participation .............................................................................................................. 28
        7.3.1         Population driven growth ............................................................................................. 28
        7.3.2         Sport driven growth ...................................................................................................... 29
     7.4 Auckland Plan, Sport and Recreation Strategic Action Plan and Parks & Open Spaces
         Strategic Action Plan ................................................................................................................ 29
8.      Future Equestrian Facility Network .............................................................................................. 31
     8.1       Objectives of the equestrian facility network....................................................................... 31
     8.2       Approach to provision of facilities for ESNZ discipline sports .............................................. 31
     8.3       Polo ....................................................................................................................................... 34
     8.4       Polocrosse ............................................................................................................................. 34
     8.5       Approach to future provision of pony clubs ......................................................................... 34
     8.6       Factors to consider when assessing utilisation of a pony club ............................................. 39
9.      Evaluation Criteria for Investment ................................................................................................ 40
10.         Regional Strategic Priorities ...................................................................................................... 41
     10.1      Table 14 ESNZ discipline facilities ......................................................................................... 41
     10.2      Table 15 Polo and Polocrosse ............................................................................................... 42
     10.3      Table 16 Pony clubs .............................................................................................................. 42
     10.4 Table 17 Equestrian sector-wide priorities ............................................................................... 42
Equestrian Facility Plan Attachments ................................................................................................... 43
        Attachment 1- Equestrian Sport New Zealand structure ............................................................. 44
        Attachment 2 - Equestrian sport facility provision and use.......................................................... 46
        Attachment 3 - Pony clubs in Auckland attributes ....................................................................... 49
        Attachment 4 - ESNZ event calendar ............................................................................................ 53
        Attachment 5 - Pony club event activity levels 2013/2014 .......................................................... 55
        Attachment 6 - Future demand supporting information .............................................................. 57
        Attachment 7 - Auckland’s Development Strategy....................................................................... 58
        Attachment 8 - Rural Urban Limits ............................................................................................... 59
        Attachment 9 - Hierarchy of provision functional requirements ................................................. 61

                                                                                                                                            3|Page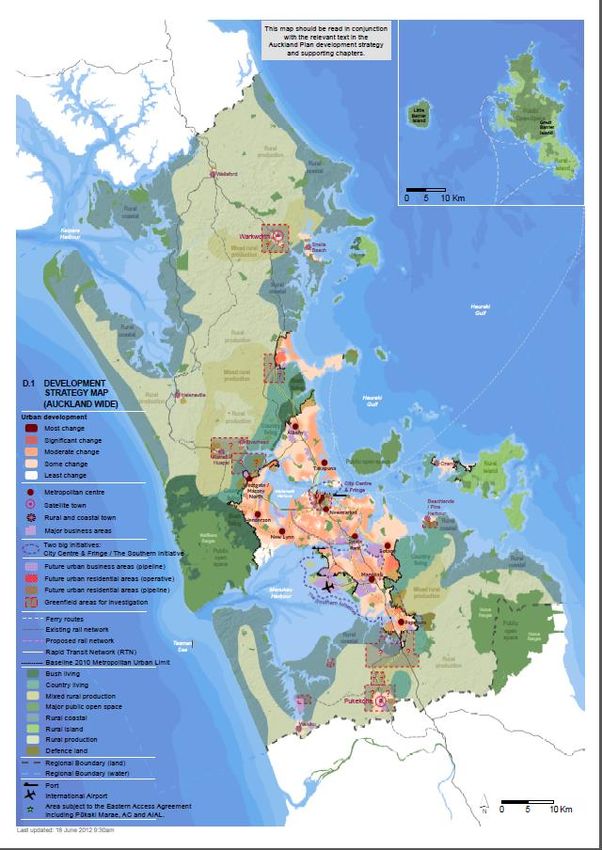
Executive Summary
Equestrian Sports NZ (ESNZ), NZ Pony Club Association, Auckland Polo and Counties Manukau Polo
Crosse engaged Morvern Group Ltd to undertake a detailed assessment of the future facility
requirements for their codes in Auckland (the facility plan was funded by Sport NZ). It identifies
what facilities will be needed for sport horse competition and training within the above disciplines
and seeks to guide investment in facility development for the next ten years.
A summary of the current issues and challenges is presented which include concern about tenure on
public land and the quality of facilities.
Participation trends indicate that riding membership in these sports codes has remained relatively
steady over the last three to four years, creating little demand for new facilities. Participation in
events and training and the ability to run more events is constrained by the limited access to and
poor quality of some facilities and competition surfaces, making addressing these a priority.
The future equestrian facility network is presented, identifying sub regional and regional facilities for
each discipline within ESNZ as well as regional provision for Polo and Polocrosse. The approach for
future provision of pony clubs is also presented. This includes securing, maintaining and investing in
the existing pony club network, investing in existing or new facilities to provide an advanced level of
competition where there is gap in provision and reviewing pony clubs for possible merger or co-
location where certain conditions exist e.g. land tenure is not secure.
To follow is a summary of the priorities and actions recommended.
Equestrian sport venues
Dressage, Endurance, Eventing, Show Jumping
The approach by the above equestrian codes to future provision is to take a discipline by discipline
approach to venues catering to ESNZ disciplines:
Secure tenure, maintain and invest in improving sub-regional provision of facilities for Dressage,
Show Jumping and Eventing
Invest in provision of quality Show Jumping facilities in the south, as there is currently a gap
Maintain the existing level of provision for Endurance
Longer term, develop a multi-disciplinary regional facility either at Puhinui Reserve, if feasible, or
at a yet to be identified alternate location, most likely in the south of Auckland.
4|Page
Priority Actions
Secure tenure of sub- 1 Secure Woodhill Sands Equestrian Centre long term for equestrian
regional and regional use through a partnership approach to its acquisition and/or
facilities management.
2 Secure access to Puhinui Reserve for future sub–regional and
regional Eventing activity.
Invest in provision of 3 Explore options to provide all-weather Show Jumping arenas in the
quality surfaces and south. Options include:
infrastructure for Clevedon Showgrounds, converting existing surfaces at the
competition and training dressage centre to cater to Show Jumping or creating new
surfaces in partnership with the pony club or Holilio
Equestrian Centre
Puhinui Reserve, as part of developing basic facilities and
infrastructure to support Eventing activity
4 Develop basic infrastructure to support efficient use and quality
surfaces to support regional Eventing activity at Puhinui Reserve eg:
access, yarding, drainage, ablutions, storage, level grass arena area
5 Upgrade remaining oval at Pukekohe Showgrounds for multi-use
including equestrian activity to support Show Jumping activity in
the short term
6 Install lights on arenas to increase use for training and schooling.
Priorities being Woodhill Sands Equestrian Centre (WSEC) and one
facility in the south eg: Papatoetoe Pony Club
Improve the 7 Review the management structure of Clevedon Sports Park User
management of existing Group with a focus on optimising and increasing use for equestrian
equestrian facilities to activity.
optimise use and provide Changes to management structure of the user group to
more opportunities enable a greater level of shared use
Integrated planning of sportsfields and equestrian park
Additional facilities to support use such as covered arena,
stables and parking
Long Term Priorities 8 Explore the feasibility of a regional (rather than an international)
multi-disciplinary equestrian centre development at Puhinui
Reserve or at a yet to be identified site
9 Progress basing Endurance at WSEC with a link to Woodhill Forest
and access to neighbouring farmland, enabling Auckland Woodhill
Endurance Club to run championship events. This has an added
benefit of allowing recreational riders to base at WSEC, with its
enhanced facilities and connection to the forest.
5|Page
Polo and Polocrosse
The approach to future provision for Polo and Polocrosse is to maintain the status quo and focus on
ongoing maintenance and improvements to existing facilities
Priority Actions
Maintain and improve 1 Invest in permanent ablutions at Abderry Equestrian Centre for
existing facilities Polocrosse
2 On-going investment to improve Auckland Polo Club grounds
Pony clubs
The approach to future provision is to:
a. Secure, maintain and invest in the existing network of local facilities to maximise use or
where investment would demonstrably enhance use and participation
b. Invest in a few facilities to provide an advanced level of competition and access to
schooling/training where:
a. there will be a demonstrated increase in event activity levels, participation and
access to training/schooling
b. there is no nearby provision at an advanced level in their area. A benchmark for this
is about 10 km in urban/semi urban areas and 15 -20 kms in rural areas.
c. partnerships can be formed with other equestrian or related organisations eg: A&P
societies
c. Review pony clubs for possible merger or co-location where some or all of the factors are
present:
a. land tenure is not secure or affected by development or change in ownership
b. memberships are declining and there are nearby pony clubs that could cater for
their members
c. facilities are less than the minimum requirement
d. facilities are in poor condition and require significant investment, where the
cost/benefit cannot be justified
e. a club is operating well below its capacity (defined by multiple factors)
f. a club cannot cater to any future growth
d. Provide new facilities only where:
i. there is a gap in provision and evidence of demand that cannot be filled by existing pony
clubs ie:
where significant growth is occurring/planned and there is no pony club provided
nearby that can be easily accessed
development and expansion of an existing club cannot fulfil the need
ii. several clubs could be rationalised or co-located onto a new better location that can fill
their needs long term
6|Page
Priority                         Actions
Secure, maintain and         1   Work with Auckland Council to secure lease arrangements for pony
invest in existing               clubs where there are none or they are due for renewal
network to maximise              Ensure new leases identify land area available (i.e. site plan) for
use                              pony club use and grazing access

                             2   Invest in the maintenance and development of local pony clubs to
                                 support greater use

                             3   Develop a “standard design” for local pony clubs’ integration (base
                                 facilities and cross country course access) with sports parks to
                                 maximise use and support co-existence e.g. Kihikihi model

                             4   Work with St Heliers and Meadowbank Pony Club to resolve a
                                 potential gap in provision created by the loss of St Heliers’ grounds
                                 after 2015.

                             5   Investigate potential merger of Whenuapai and Greenhithe with
                                 supporting investment in facilities

Invest in a few facilities   6   Work with Franklin Local Board and other equestrian sports to
to provide an advanced           review the model of management and investment into Clevedon
level of competition and         Sports Park to improve utilisation and develop the grounds further
access to                        for equestrian use
schooling/training
                             7   Investigate the provision of an advanced level pony club facility in
                                 the south e.g.: Pukekohe

                             8   Investigate the provision of an advanced level pony club in the west

Provide new facilities       9   Review the potential gap in provision in the south west e.g. Hingaia
only where there is a            area and work with existing pony clubs on private land to identify a
gap in provision and             solution for provision in this area
evidence of demand

Equestrian sector-wide priorities

Priority                         Actions
Build the capacity of        1   Ensure there are enough trained volunteers to support events
existing organisations
                             2   Develop systems to capture and manage membership and
                                 participation data more effectively

Respond to Auckland’s        3   Look at how to offer appealing opportunities to engage with a more
changing population              diverse population such as the growing Asian population

                                                                                            7|Page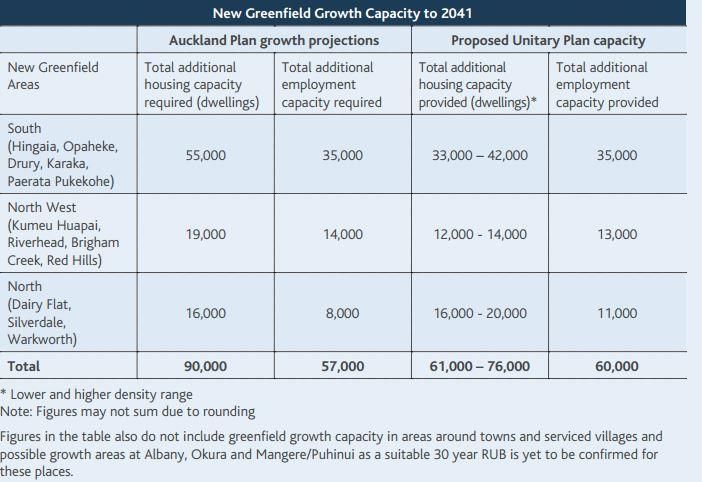
1. Introduction
1.1 Introduction
There is wide acceptance within the sports sector of the increasing importance for a more strategic
and planned approach to the provision of facilities. This has been acknowledged at a national level
with Sport New Zealand investing in a number of national facilities strategies.
The development of these strategies coupled with the formation of Auckland Council has provided
the impetus to collaboratively develop regional plans to give direction for future investment in
sports infrastructure within Auckland. This will guide investment through a coordinated approach
and present national and regional sports organisations priorities, as identified in the facility plan to
help prevent ad-hoc development.
Equestrian Sport New Zealand, New Zealand Pony Club Association, Auckland Polo Club and
Counties- Manukau Polocrosse, facilitated by Auckland Council, commissioned Morvern Group
Limited to undertake a study to identify the future facility needs for these equestrian sports in
Auckland.
This document aims to provide a blueprint for the future provision of equestrian competition and
training venues for the above organisations and includes a demand based regional view of facility
requirements. Due to the focus on sport facilities, the plan does not include provision of adult riding
clubs, private facilities that deliver some competitive events, Riding for the Disabled (RDA) or
recreational riding/bridlepath-type issues. These facilities will be considered in other aspects of
planning for equestrian provision and may also form an integral part in partnerships for the
development of pony clubs and equestrian centres. The plan does not represent the wider
equestrian sector and it should be noted may not represent the specific priorities of individual
facilities or clubs.
1.2 Process
A steering team was established to oversee the development of the plan with representatives from
Equestrian Sports New Zealand (ESNZ), New Zealand Pony Club Association(NZPCA), Auckland Polo
Club, Counties- Manukau Polocrosse and Auckland Council.
The process of developing the plan has included:
Initial steering group meeting to agree scope and approach
Updating and revising analysis of participation and venue specific information collected as
part of the Auckland Purpose Built Equestrian Facilities – High Level Needs Analysis report
commissioned by Auckland Council in 2012.
Analysis of Auckland’s future population changes and growth projections
Analysis of pony club participation, event activity and facility specific data collected in
association with Auckland Council and by NZPCA
Analysis of ESNZ discipline specific event activity data supplied by ESNZ
Review of Polo and Polocrosse activity levels
8|Page
Site visits to Clevedon Polo Grounds, Ryburn Park, Holilio Equestrian Centre, Clevedon
Dressage Grounds and Pukekohe Showgrounds
Interviews and a workshop with selected facility owners and representatives of
organisations delivering ESNZ discipline specific events in Auckland
Workshops led by NZPCA with pony club representatives from Franklin, Auckland and
Waitemata -Rodney areas.
Two steering group meetings in May and July 2014 to review analysis and agree framework
for the plan based on all information to hand and analysis of options.
9|Page
2. Overview of Equestrian Sports

2.1     Equestrian Sports New Zealand disciplines
Equestrian Sports New Zealand (ESNZ) is the national governing body for the equestrian sport
disciplines of Endurance, Dressage, Eventing, Show Jumping and Para Equestrian. Attachment 1
presents an illustration of the ESNZ structure. ESNZ represents the international equestrian sports
governing body Federation Equestre Internationale (FEI) in the New Zealand market and many but
not all of the events operate under FEI rules.

For ESNZ disciplines, ESNZ is responsible for the national event calendar and sets the rules, manages
the membership and high performance programme across all disciplines. All membership fees are
paid to ESNZ.

2.2     Pony Clubs
The New Zealand Pony Clubs Association (NZPCA) is a not for profit, voluntary organisation, for
mainly young people interested in ponies/horses and riding. It has 238 Clubs, 81 Branches and over
9,400 members nationally of which 5090 are riding members. In Auckland there are 36 branches and
Waiuku Pony Club that borders the region and draws membership from Auckland.

Participation in equestrian activity and competition for school age riders occurs through pony clubs
at the grass roots level of the sport. Pony clubs provide a pathway to participation for new
horse/pony riders by providing a range of pony club activities and rallies, events open to the wider
equestrian sector and grazing primarily for pony club members. Clubs have a mixture of junior and
adult riders, the proportion of which varies per club. Pony clubs provide opportunities for adult
equestrians, including non-members and members of adult riding clubs to take part in equestrian
events and competitions that are not at the level of difficulty and competiveness provided by ESNZ.

The primary purpose of pony clubs is to provide instruction on riding and horse/pony management
for school age riders. Coaching supports a structured certificate system that allows young people to
gain qualifications and encourages them to ride and enjoy participating in pony club rallies, events
and competitions.

2.3     Polo
Polo is administered by the parent association, Polo New Zealand with 19 clubs and 300
handicapped players across New Zealand. The Auckland Polo Club, based in Clevedon, is the only
club in Auckland and is affiliated to Polo New Zealand.

2.4     Polocosse
Polocrosse is administered by the parent association, NZ Polocrosse. It is one of the few sports
where there is mixed competition with men and women. There are twelve recognised clubs across
the North Island (and some Polocrosse played in Canterbury) with 391 recognised members in 2012.
Counties Manukau Polocrosse Club, based at Abderry Equine Centre near Patumahoe, is the only
club in Auckland, and is affiliated to NZ Polocrosse.

                                                                                         10 | P a g e
3. Issues and Challenges for Current and Future Provision
The following issues and challenges were identified in 2012 by the Auckland equestrian sector1
affecting facility use, current and future facility provision and the growth of equestrian sports. These
issues and challenges were reconfirmed as the Equestrian sectors’ primary concerns through
interviews and workshops with key equestrian sector groups and the steering group as part of
developing this plan.
The two main challenges facing all equestrian sports is gaining secure access to good quality grounds
and the concern that there will be increasing pressure to convert existing land used for equestrian
activity to higher yielding activity as Auckland intensifies and the population grows.
3.1 Security of use and availability of land and facilities
Long term security of tenure and access to land for equestrian facilities and use is of major concern
to the sector as follows:
Many facilities are located on privately owned land or are in private ownership. There is growing
pressure to convert these to higher yield activities such as housing or smaller lot sizes in certain
areas.
Many pony clubs are on public land, either with lease renewals pending or no lease at all. The
level of use is being challenged and they are faced with looking at ways they can show how they
use the land to best use and can increase and intensify use of the land. There is concern that the
land might be converted to sportfield use as an alternate.
Loss of land for grazing ponies is affecting people’s ability to participate in the sport.
Compliance and liability issues are affecting land availability and use. Some landowners do not
want high risk equestrian activity on their property anymore and some facilities limit or exclude
casual use due to concerns about insurance liability for rider accidents.
Access to facilities and places of horse livery necessitates travelling across Auckland which is
becoming harder with growing traffic volumes and during peak periods.
These issues create uncertainty for investment, development of club and discipline activity and
potentially threaten future local accessibility to equestrian sports.
3.2 Quality of land and facilities
Ground conditions at many pony clubs and some equestrian centres are poor due to inadequate
drainage and or poor soil conditions. This restricts the window of use of both pony clubs and
equestrian centres ie: grounds are either too wet or become rock hard in dry summer months. Most
grounds are unable to be used outside of October – end April, with some challenged in the
October/November period with wet conditions. Many facilities lack all-weather parking and
surrounds and good quality amenities for riders and spectators. Riders tend to be horse-focused and
often suffer lesser amenities for themselves and spectators if they can be sure their horses can be
safe.
1
Morvern Group Ltd, 2012. Auckland Equestrian Purpose Built Equestrian Centres- High level Needs Analysis,
Auckland Council.
11 | P a g eThere is a general lack of quality reliable surfaces (the footing) for Show Jumping. Many surfaces are
sub-standard at times of the year which restricts usage and the willingness of riders to risk their
horse’s safety.
The cost to maintain facilities is challenging for all venues but in particular pony clubs where costs to
keep facilities such as cross country courses in good shape for competitions is high.
3.3 Size of facilities
There is no venue in Auckland currently capable of hosting multi-disciplinary events (except Puhinui
Reserve in temporary activity mode for Eventing) or a major show such as Horse of the Year, limiting
the range of events that can be held in Auckland.
Woodhill Sands Equestrian Centre (WSEC) is the only facility that can cater to a number of larger
events with associated infrastructure in permanent place. Its capacity sits at 600 horses with an
upper limit of 700 for Show Jumping events, although the demand for events at this size is low. Only
the Taupo Christmas Classic (aside from the Horse of the Year show in Hastings) hosts this many
horses at a Show Jumping event in New Zealand.
3.4 Capacity to hold events
There are three main factors currently constraining event growth:
For ESNZ disciplines, there are few available event days on the ESNZ calendar and this is made
worse in Auckland with WSEC being the only sizeable regional facility, its calendar near full
during the summer months, and the limitations of use at other facilities. This should change in
the near future with changes to how ESNZ manages the calendar, opening up greater
opportunity to run more localised events through the busy summer months.
Capacity of equestrian groups to service additional events and usage at existing facilities is
constrained by the amount and capability of volunteers (organising, supervising and judging).
Many of the same people who form the volunteer base for a particular venue or event type are
often servicing pony club events as well as ESNZ sanctioned events. Ninety to 100 volunteers are
required to run for example, Dressage and Eventing ESNZ events.
There is a lack of private event companies developing and delivering equestrian events.
3.5 Access to training and exercise facilities
There are a limited number of facilities for winter training and exercising horses as a result of poor
quality surfaces at existing facilities or facility specific policies limiting access for casual training use.
Exercising horses is often a daily activity that requires easy access and good quality facilities. Many
invest in their own properties to cater to this but alternatives are required for those who do not
have this access.
Outside of facilities, provision of bridle trails, access to paper roads, road side berms and other free
public access horse areas are an essential component of not only recreational horse riding but
exercising for sport horses.
12 | P a g e3.6 Relationship with Auckland Council
Engagement with Auckland Council over land tenure, park developments, maintenance and
development of facilities is considered a challenge that impacts on the long term development, cost
and operation of equestrian facilities. Understanding the usage levels of pony clubs and the unique
needs for pony club and equestrian centre provision is not well understood overall. Parks
developments often compromise pony club operations, whereby if there was a better level of
understanding of how differing uses could co-exist, better outcomes could be achieved for all.
Engagement was reported as good where long standing relationships had been formed with council
staff.
3.7 Barriers to growing participation
The total cost of participation in all equestrian sports is high comparative to many other sports and is
seen as a barrier to growing participation now and in the future. The high cost to compete in
individual ESNZ class events is also considered a barrier to growing participation levels. Event –
related cost is driven largely by the need to pay for officials, set up and maintenance costs as
increasingly it is more difficult to get the necessary volunteer labour to do this.
Riders must be a member of ESNZ to compete in ESNZ class events. This inhibits more people getting
involved in ESNZ events who may just want to experience the sport before committing given high
entry level costs of equipment and horses and the cost to start in an event. New membership
structures are being proposed by ESNZ in August 2014 to address this issue.
There is a general consensus in the sector that greater marketing, coordinated promotion and selling
of equestrian sports “value proposition” is required to attract more participants and build support
for equestrian sports.
13 | P a g e4. Current Facility Provision
4.1 Equestrian sports
Equestrian sport competition is held across eight venues in Auckland – see Table 1 and Map 1.
Attachment 2 outlines in greater detail facility attributes, use and limitations.
Table 1 Equestrian Sports Facility Provision and Current Use
Discipline Facility Facility competition Event level & capacity
provision for competitors
Dressage Clevedon Dressage Grounds 2 all- weather arenas, 8 10-12 events
competition rings Up to 200 per
National competitions up competition
to advanced Grand Prix
Woodhill Sands Equestrian 8 all -weather arenas – set 16-18 events
Centre up for 6 competition rings Up to 150 per
National competitions up competition with
to advanced Grand Prix capacity for more
Endurance Woodhill Forest Equestrian Up to 80km course offered 7 events
Park and wider forest 100+ competitors
Eventing Woodhill Sands Equestrian Up to CNC2* 4 km course 4 events
Centre with use of plus arenas Up to 300-350 per
neighbouring property competition (limited
by daylight hours)
Springbush Equestrian Centre Up to CIC2* events 3km 1-2 events
course plus arenas Up to 300-320 per
competition (limited
by daylight hours)
Puhinui Reserve CCI3* long course 6.5km 2 events
eventing course Up to 300-350 per
2 grass jumping arenas competition (limited
6 grass dressage rings by daylight hours)
(Temporary set up)
Show Woodhill Sands Equestrian 8 all -weather arenas set 10 events
Jumping2 Centre up for 4 all-weather Up to 600 to 700
competition arenas and
1 premier grass arena
Up to 3* star competition
Pukekohe Showgrounds 4 grass arenas 1-2 events
Up to 2* star competition Up to 400
Polo Clevedon Polo Grounds 5 grounds over two 5-6 tournaments
Ryburn Park properties- 2 grounds on @ 30 teams at NZ Polo
site and 3 grounds at Open
Ryburn Park (privately
owned)
Polocrosse Abderry 3 fields 3 events
200 at tournament
2
Show Jumping includes Show Hunting
14 | P a g eMap 1. Equestrian Centres and Event Locations in Auckland.
Auckland Equestrian Centres and Event Locations
Equestrian centre/event location on private land
Equestrian centre/event location on public land
15 | P a g e4.2 Pony clubs
In Auckland, pony clubs are divided into three pony club areas; Waitemata/Rodney, Auckland and
Franklin.
Within these three pony club areas there are 36 branches operating within the boundaries of the
Auckland Council area. The clubs are predominantly located in the north and south – 13 clubs in
Rodney and 10 in the Franklin Local Board areas. Waiuku Pony Club is located outside the border of
Auckland but draws members from the Auckland region and is included within the scope of this plan,
making a total of 37 pony clubs.
Table 2 shows Auckland’s provision and membership relative to New Zealand and Canterbury Area
Pony Club which includes Christchurch as New Zealand’s second largest city/region. In terms of
provision per head of population, Auckland is below the national average and less than Canterbury.
The average membership per club is higher in Auckland per riding member than nationally and in
Canterbury.
Table 2 Provision and Membership Levels Per Head of Population
Area Clubs Riding Total Population Ave riding Percentage
Members population per club membership of
population
3
NZ 238 5090 4,242,048 17,899 21 0.12%
4
Auckland 36 1168 1,415,550 39,320 32 0.08%
5
Canterbury 22 610 447,585 20,345 28 0.14%
The following map (Map 2)shows the location of each club and those on privately/club owned land,
of which there are 14 or 38 percent of the total. Four clubs own their land: Papatoetoe, Pointways,
Whitford and Waiuku. This offers a level of future security of tenure and investment not afforded to
the other clubs. Of those on council leased land, several have leases under negotiation but only six
of the 24 identified pony clubs has a secure lease tenure beyond five years.
The location of each pony club, its local board area, land ownership and lease status, size,
membership and club facilities covering all-weather arenas and cross country courses are
summarised in Attachment 3.
Map 3 shows a notional 5km radius around existing clubs, representing an assumption on how far
people are willing to travel based on the catchment for local community centres. This indicates
some potential gaps in provision, but generally good coverage across many parts of Auckland.
Interviews with those involved in equestrian sport indicate that pony club members and those
participating in pony club competitions are willing to travel much greater distances than this.
Facilities provided vary dependent on the size of the club and land area available. Typically facilities
at pony clubs consist of 1-2 all-weather arenas, a grassed arena, tie up areas, sometimes yards/pens,
NZPC65 (intro) to NZPC95 (training) level cross country course and up to NZPC105 (open) level cross
3
Usually resident population census night 2013 – Statistics New Zealand
4
2014 pony club data
5
Christchurch, Selwyn, Waimakariri and Hurinui District populations
16 | P a g ecountry if on sufficient land ie:12+ hectares. A few have floodlit arenas that expand the availability of
usage. A majority of pony clubs, particularly those in more urbanised areas or on the urban fringe,
offer grazing to junior club members. They rely on this to attract and retain members. This supports
participation of those who own a pony but do not own their own land nor have easy access to leased
land for grazing.
4.3 Role of Auckland Council in provision
Auckland Council considered its role is in the provision of equestrian facilities in December 2012
when considering a report on the Auckland Equestrian Purpose Built Equestrian Centres- High level
Needs Analysis report. The Parks, Recreation and Heritage Forum resolved that:
“a) The high level needs analysis has determined Auckland Council's primary role in the
provision of equestrian facilities is to make Auckland Council owned land available on a
subsidised lease to Pony Club and Riding for New Zealand Disabled organisations at a local
level, where suitable.
b) The high level needs analysis has determined that Auckland Council plays a facilitating and
enabling role in assisting the equestrian sector in Auckland to realise their equestrian facility
priorities, where appropriate.”
Local level equestrian activities on council land occurs at the discretion of a local board that have
allocation of decision-making for local recreation facilities. A club that wishes to secure tenure
and/or develop facilities is therefore required to liaise with the local Parks Advisor and Parks
Portfolio Holder within the club’s local board area.
17 | P a g eMap 2. Location of pony clubs in Auckland
18 | P a g eMap 3. Map 3. Pony clubs in Auckland 5km travel radius
19 | P a g e5. Current Regional Participation
5.2 Horse riding participation overview
There is little research to quantify the actual number of regular and casual riders in Auckland.
Estimates rely mainly on SPARC, now Sport NZ, participation surveys. These include regular horse
riding and casual participation. Survey results do however consistently reinforce that participation in
equestrian sport/horse riding is dominated by females and is much more popular for girls than boys.
Survey results indicate the following levels of participation in Auckland:
2003 SPARC survey estimated 23,000 regular horse riders, those who ride at least once in every
2-4 weeks.
SPARC 2007/08 Active New Zealand Survey estimated 32,800 regular adult horse riders in
Auckland.
Gemba Group, 2013 Sports and Entertainment Report commissioned by Sport NZ, shows that
o 2 percent of Aucklanders, or 28,311 people6 participate in equestrian activities
o 25 percent of participants were male and 75 percent were female
o 44 per cent of all riders, equating to 12,457 people in Auckland, participated once a
month or more frequently.
Sport and Recreation in the Lives of Young New Zealanders survey found that 3 percent or
4,3627 girls, aged 5– 18 years in Auckland, participated in horse riding /equestrian activity. The
number of boys did not register. This increased to 4.3 percent of girls and 0.1 percent or 1518
boys in Years 7-13 at school. Two point four percent of all girls want to try or do more horse
riding /equestrian activity.
New Zealand Secondary Schools Sports Council 2013 census on participation shows that there
were 298 students engaged in secondary school equestrian activity in Auckland. Of those298,
293 were female and 5 were boys.
5.3 ESNZ membership
ESNZ registers all riders who participate in the traditional sports of Dressage, Eventing, Endurance,
Show Jumping and Show Hunter. Membership across the country is approximately 6000 with just
over one quarter of members 18 years or under. In 2013 there were 892 registered riders in the
Auckland Region, seven of which are Para-Equestrians. Membership numbers do not fluctuate
greatly year on year, although the Auckland membership has dropped from 965 in 2012. Those 892
riders have 1,413 associated registered horses.
5.4 Polo participation
There are 200 members of the Auckland Polo Club with 61 playing members. Only registered players
can play Polo, due to insurance cover required. Polo is predominantly a sport played by males but
more females are now starting to participate. Participation levels are relatively static.
6
Based on Auckland’s 2013 census population of 1,415,550: Source Statistics New Zealand
7
Based on Auckland’s 2013 census population of 145,419 girls aged 5-19years: Source Statistics New Zealand
8
Based on Auckland’s 2013 census population of 151,488 boys aged 5-19years: Source Statistics New Zealand
20 | P a g e5.5 Polocrosse membership
Counties Manukau Polocrosse has 56 members who range in age from 8 years old to 68 years old as
follows.
Sub juniors – under 12 years (lead rein): 4
Juniors – 12 years to under 16 years: 5
Intermediate – 16 years to under 21 years: 7
Open – 21 years plus: 40
56
5.6 Pony club membership
Pony club membership is collated annually through the New Zealand Pony Club Association. It
includes both riding and non-riding members. Membership for the 2014 year is set out below in
Table 3 per district.
Table 3 Pony Club Membership 2014
Pony Club District U 18 18-25 Total Adult Other Total all Adult
Area riding non members riding**
riding
Waitemata- Kumeu 135 20 155 111 6 272 103
Rodney
North Shore 63 5 68 33 2 103 9
Waitemata 203 38 241 73 10 324 128
Warkworth 54 5 59 54 2 115 0
Wellsford 14 0 14 9 0 23 0
West 120 40 160 105 18 283 38
Auckland
Whenuapai 7 0 7 10 0 17 0
Auckland Manukau city 60 9 69 61 0 130 0
Papatoetoe 41 19 60 41 20 121 60
Auckland 84 25 109 127 0 236 0
Pointways 34 1 35 47 0 82 0
Waiheke 17 2 19 16 0 35 0
Franklin- Franklin 158 14 172 134 15 321 0
Thames - District*
Valley
Total 990 178 1168 821 73 2062 338
*Membership data includes Waiuku Pony Club that sits outside the Auckland Council boundaries but draws riders
from Auckland.
** Adult riding members who are not on the NZPCA database
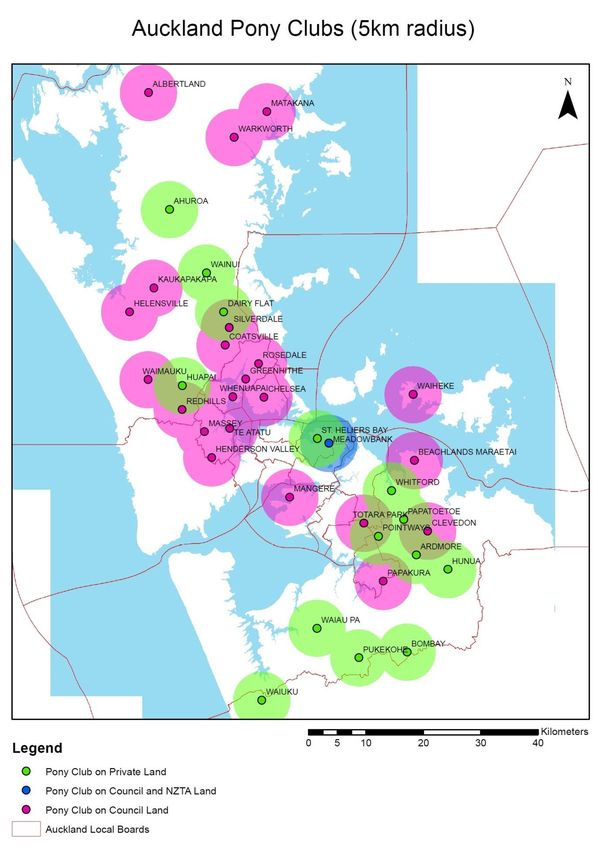
Membership levels fluctuate year on year as can be seen from the 2011 to 2014 riding (U 18 and 18-
25 year olds) membership levels in Table 4 and for all categories in the bar graph below .
Table 4 Pony Club Membership 2011-2014
2011 2012 2013 2014
Riding 1170 1049 1285 1168
Membership
21 | P a g eThe largest amount of growth occurred in adult memberships when a constitutional change in
2012/13 required an adult member for every riding member under 18 years to be identified and join
NZPCA.
Like many other sports, a drop-off in membership occurs in the 18-25 year old range. In addition to
member and registered ESNZ rider participation in pony club events, non-club membership
participation in competitions and other scheduled events is still estimated to be approximately 30
per cent of entries. The pony club data shows there are an additional 338 adult riders who are
associated with clubs but not captured in NZPCA membership data. This increases the numbers
riding by 22 per cent.
Pony Club Membership by Category
3000
2500
2000
1500
1000
500
0
Under 18 years 18-25 years Adult non Other Total
riding
2011 2012 2013 2014
Attachment 3 show membership at club level and membership by pony club district.
5.7 Summary of organised sport horse participation
Based on the number of registered riders, pony club riding members and members of other
equestrian clubs outlined in section 5.2- 5.5 above, overall the numbers indicate about 2,300
individuals actively participating in organised events/activities. This may be upwards of 3,000 when
non- registered, non- club members are accounted for.
22 | P a g e6. Current Regional Event Level Activity
In addition to membership data, event activity data gives a good indication of current and future
demand for facility provision.
6.1 ESNZ discipline activity levels
Whilst ESNZ manages the events calendar and regulatory framework nationally, regional discipline
committees deliver events and competitions in their area at a variety of venues. Equestrian centres
such as WSEC and Springbush Equestrian Centre also organise and run ESNZ events through a
separate arrangement with ESNZ.
There were 71 ESNZ events held in Auckland in the 2013/14 season. WSEC hosted 59 percent of
these, Clevedon Dressage Grounds 17 percent and Woodhill Forest 10 percent. Attachment 4,
shows the breakdown of these event levels, including the other event venue usage and distribution
of ESNZ events across the northern half of the north island (excludes Taupo).
The graph below shows that in 2012/13 there were a total of 15,300 class starts by Auckland and
non-Auckland based riders in ESNZ official class competitions, of these, 70% were at WSEC. Like pony
club events, these activity levels do not take account of unregistered classes where there can be 40-
50 competitors at for example a Dressage event or up to 200 at a Show Jumping event held in the
winter.
The majority of starts are in Show Jumping which hold the most events (mainly at WSEC) and has the
highest participant numbers. There are typically 400-500 entries but up to 600-650 occasionally at
WSEC. Typical entries at Dressage events is about 150 and Eventing starts are about 300-350 per
day, restricted by daylight hours to get all participants through the course. Eventing starts at 1,394
for 2012/13 season, are less than for the previous two years at 1,878 and 1,698 respectively.
ESNZ Competition Class Starts Auckland 2012/13
18000
16000
14000
12000
10000
Total
8000
WSEC
6000
4000
2000
0
Eventing Jumping Dressage Endurance Total
Similar to other sports, the majority of competitors are competing at the lower levels of each
discipline. In Eventing for example, the majority of entries, about 120, are at the CNC105 (pre-
23 | P a g eNovice ) and CNC95 (training)levels, with 80 competing at the CNC80 (pre training level ). There are
only about 50 riders competing at 2* star and 20 at 3*star 9higher levels of the discipline.
6.2 Polo and Polocrosse event activity
Polo training and games happen throughout the week during the season, with 5-6 tournaments
hosted at the grounds. The largest spectator equestrian sport event in Auckland is the New Zealand
Polo Open hosted at Clevedon Polo grounds and Ryburn Park. This event attracted 7000 spectators
and 28 teams in 2014.
Participation in Polocrosse training occurs twice per week. Eight tournaments are held north of
Taupo, three of which are at Abderry Equestrian Centre with 180 participants and between 200 and
800 spectators depending on the level of competition.
6.3 Pony club activity levels
Pony club usage is predominantly seasonal with clubs very active during the summer months from
September to May. Some larger clubs and those with all-weather facilities have extended seasons
and/or offer competitions and training during the winter months e.g. Papatoetoe, Pointways and
Totara Park pony clubs.
Clubs offer weekly rallies at which coaching is provided plus, show jumping, dressage and one day
event (eventing) competitions, and ribbon day competitions where riding skills and horse turnout
skills are tested. In addition to the traditional cross country competition, clubs offer Derby Days
(combination of cross country and show jumping) and Show Cross, where the show jumps are
outside the arena so the rider goes cross country. About one third of event activity falls within this
category. Some pony clubs host district, area and zone competitions and area school competitions.
Event activity varies across the region from club to club. Attachment 5 includes an overview of event
activity by pony club for 2013/14. This information was collated by NZPCA. The greatest overall level
of activity is in the Waitemata-Rodney pony club area which is the largest area.
Some of the pony club events can attract up to 170 -200 entries at clubs such as Clevedon,
Papatoetoe, Mangere and Hunua. The majority of clubs hold ribbon days and jumping events that
attract between 30-90 people per event.
In total the information collected indicates there are more than:
662 rallies held by Pony Clubs during the season plus, 30 ribbon days, 24 Dressage, 37 Show
Jumping/Show Hunter, 22 Eventing competitions and 65 other events
7000 plus competitor starts at Pony Club events/activities including 2572 Eventing starts,
2444 Show Jumping/ Show Hunter starts, 1137 Dressage starts and 1068 Ribbon Days starts
9
All Eventing competitions are rated on a star system, with 1 star being the lowest and 4 star being the
highest. 2 star is Intermediate and 3 star Advanced level.
24 | P a g e7. Projected Demand
7.1 Auckland’s population
7.1.1 Population projections
As at the 2013 census, Auckland was the fastest growing region in New Zealand, increasing 8.5 per
cent from 1,304,958 people in 2006 to 1,415,550 people in 2013, see Attachment 6. New Zealand’s
overall population grew 5.3 percent in the same time period to 4,242,048, with an average annual
population growth between 2006 and 2013 of 0.7 percent, which was less than half of that between
2001 and 2006 (1.5 percent).
The local board areas that had the highest increases in population between 2006 and 2013 were
Franklin Henderson- Massey
Hibiscus and Bays Waitemata
Upper Harbour Howick
Table 5 shows the projected population growth of Auckland taking into account amongst other
factors, development capacity, land supply and Statistics New Zealand’s medium growth projections.
Statistics New Zealand’s medium growth projections10 have Auckland’s population growing to
1,968,100 by 2031. This will represent 38 percent of New Zealand’s population compared to 33
percent as at the 2013 census. The projected fastest growing local board areas percentage wise,
between 2011 and 2031, are Upper Harbour, Franklin, Papakura and Rodney and Henderson
Massey. These five areas are the location of 30 out of the 36 pony clubs and seven of the eight
equestrian facilities.
Howick, the most populous local board area, does not have any pony clubs or equestrian centres
located within its area. The populations of Howick, Pakuranga and Flatbush can currently access
Whitford, Totara Park, Mangere and Meadowbank pony clubs as the closest clubs.
10
Statistics NZ Sub- National Population Projections 2006(base) – 2031 October 2012 Update –Medium growth
25 | P a g eTable 5 Projected Population at 30 June, 2006 (Base) to 2031
Local Board 2006 2011 2016 2021 2026 2031 change Percent
2011- change
2031
Albert-Eden 96,190 101,060 106,530 111,630 118,200 123,600 22,540 22
Devonport- 55,660 58,550 62,380 64,640 65,680 66,310 7,760 13
Takapuna
*Franklin 60,640 66,240 71,890 81,920 93,590 123,450 57,210 86
Great Barrier 940 910 930 990 1,060 1,160 250 27
*Henderson- 103,510 113,680 121,700 134,790 149,920 161,380 47,700 42
Massey
Hibiscus and Bays 85,210 91,320 99,710 112,150 121,600 124,840 33,520 37
Howick 119,090 132,650 142,680 157,660 173,140 175,740 43,090 32
Kaipatiki 83,820 88,470 94,040 98,160 100,450 101,850 13,380 15
Mangere- 72,440 78,740 83,570 89,020 91,970 93,660 14,920 19
Otahuhu
Manurewa 81,480 90,190 95,620 96,890 96,140 95,080 4,890 5
Maungakiekie- 70,620 75,480 80,590 89,280 99,120 106,410 30,930 41
Tamaki
Orakei 78,190 83,240 89,690 99,940 111,520 117,610 34,370 41
Otara- 76,720 83,680 88,830 94,060 97,490 100,620 16,940 20
Papatoetoe
*Papakura 42,830 46,300 50,590 56,290 62,910 70,050 23,750 51
Puketapapa 53,750 57,550 61,040 66,550 72,950 77,850 20,300 35
*Rodney 50,910 56,170 61,550 65,780 71,970 82,830 26,660 47
*Upper Harbour 44,970 51,230 56,740 63,650 72,050 91,470 40,240 79
Waiheke 8,160 8,730 9,560 9,680 9,610 9,710 980 11
Waitakere 47,600 50,680 54,450 54,430 53,710 54,990 4,310 9
Ranges
Waitemata 66,770 71,950 75,270 77,590 83,040 87,640 15,690 22
Whau 73,210 78,910 84,500 91,410 97,430 101,840 22,930 29
Total 1,372,700 1,485,700 1,591,800 1,716,500 1,843,500 1,968,100 482,400 32
Source Auckland Council - Auckland Residential Futures Model V1, 2014.
*projected 5 fastest growing local board areas
7.1.2 Auckland’s age profile
Auckland’s median age is projected to rise from 34.2 in 2011 to 37.5 in 2031. Table 6 shows the
percentage increase and percentage of population by age group to 203111. This broad shift in age
structure could offer some opportunities for equestrian sports. Three quarters of ESNZ members
are adults. There is an opportunity to engage with the increasing number of people aged 15-39
years who could be encouraged to stay in, return to or take up equestrian sport. This is especially so
for the 15 – 25 year age bracket, where there is marked drop off in participation currently.
The 2012 Auckland Equestrian Purpose Built Equestrian Centres-High level Needs Analysis Report
also identified that anecdotally the sector had noticed an increase in the number of women
11
Statistics NZ Sub- National Population Projections 2006(base) – 2031 October 2012 Update –Medium growth and 2013
census base.
26 | P a g ereturning to the sport in the 30-50 year old age bracket once their children are in school or have left
home. This offers another opportunity for the sport for targeted re-enrolment.
Table 6 Percentage Changes by Age Group of Auckland’s Population 2013-31
0–14 15-39 40-64 65 Years
Years Years Years and Over
2013 Census 296,355 505,155 450,882 163,158
2031 Projections 361,800 698,600 574,800 332,900
Population increase 65,445 193,445 123,918 169,742
Percentage increase 22 38 27 104
Percentage of population 18 35 29 17
2031
7.1.3 Auckland’s growing ethnic diversity
Auckland’s ethnic diversity has also changed between 2006 and 2013, as shown in the graph below.
Those of Asian ethnicity have grown from 18.9 to 23.1 percent of the population and this is expected
to continue to grow as a proportion of Auckland’s population. The proportion of those of Asian
ethnicity is also higher in some areas than others, for example 38 percent of the Howick Local Board
area is of Asian ethnicity compared to 6 percent of the Franklin Local Board area.
Auckland - Percentage Ethnicity 2006 and 2013 census
70
60
59.3
50
40
30
2006
20 23.1 2013
10 14.6
10.7 1.9 1.2
0
European Māori Pacific Asian MELAA Total
Peoples people,
Other
Ethnicity
There is no data available as to the ethnic makeup of those participating in equestrian sports but it is
seen as a sport predominantly participated in by Europeans. I tcan be concluded that equestrian
sports will need to offer appealing opportunities to engage with a more diverse population in
Auckland, or not be relevant to a growing sector of the population.
27 | P a g e7.2 Auckland Plan and growth
The Auckland Plan sets out a development strategy for Auckland over the next 30 years which
identifies the need for up 400,000 new dwellings by 2041. Attachment 7 outlines the development
strategy across Auckland. Sixty to 70 per cent of future residential growth is expected to occur
within the existing Metropolitan Urban Limit with 30-40 per cent (120,000- 160,000 dwellings)
outside that limit in greenfield developments, satellite towns and rural and coastal towns. It is
estimated that the satellite towns of Warkworth and Pukekohe will each grow to between 20,000
and 50,000 people.
The Rural Urban Limit (RUB) replaces the Metropolitan Urban Limit. This land will be zoned future
urban and will require structure plans before urban zones are applied to the land and developments
can proceed. Not all land within the RUB will be developed for housing; parks, reserves, schools,
town centres and a range of other activities will be provided for in these areas. Attachment 8 shows
where these areas are and the updated capacities in each area.
The future growth of Auckland has two potential impacts on the provision of equestrian facilities.
The future urban zonings in the south, north and north west correlate to where equestrian activity is
highest in the region and where the most facilities are located. This could mean greater demand for
equestrian facilities and growth in participation but could equally mean pressure to convert to
higher yielding activity such as housing or smaller lot sizes. Rural land used to graze and train horses
on private property and land available for equestrian facilities such as pony clubs could reduce.
Intensification generally will bring pressure to bear onto existing pony clubs on leased land to ensure
they maximise use and invest in facilities to support increased usage.
The new greenfield areas identified for urban growth in the south correlate with where there is a
potential gap in current pony club provision and/or future gap if private land currently used for pony
club activity is lost. Planning for future provision may need to consider where land may be made
available for a future new pony club in this area.
7.3 Future participation
7.3.1 Population driven growth
Table 7 shows predicted membership and participation in equestrian activity if membership as a
percentage of population grows in line with population growth. For pony clubs, this means average
riding membership could rise from 32 to 44 members per club based on current level of provision.
Demand is likely to be uneven however, as there are stronger growth rates predicted in some areas
than others.
The increase indicated for ESNZ disciplines is not likely to impact facility provision but the overall
growth in levels of predicted registered and non- registered riders driven off pony club membership
and event activity could lead to a demand for an increased number of competition events and
improvements to existing facilities to cater to them.
There is no indication that Polo and Polocrosse membership growth will lead to an increased
demand for facility provision.
28 | P a g eYou can also read