ICE INJECTED INTO THE TROPOPAUSE BY DEEP CONVECTION - PART 2: OVER THE MARITIME CONTINENT - MPG.PURE
←
→
Page content transcription
If your browser does not render page correctly, please read the page content below
Atmos. Chem. Phys., 21, 2191–2210, 2021
https://doi.org/10.5194/acp-21-2191-2021
© Author(s) 2021. This work is distributed under
the Creative Commons Attribution 4.0 License.

Ice injected into the tropopause by deep convection –
Part 2: Over the Maritime Continent
Iris-Amata Dion1 , Cyrille Dallet1 , Philippe Ricaud1 , Fabien Carminati2 , Thibaut Dauhut3 , and Peter Haynes4
1 CRNM,  Meteo-France – CNRS, Toulouse, 31057, France
2 MetOffice, Exeter, Devon, EX1 3PB, UK
3 Max Planck Institute for Meteorology, Hamburg, Germany
4 DAMTP, University of Cambridge, Cambridge, CB3 0WA, UK

Correspondence: Iris-Amata Dion (iris.dion@umr-cnrm.fr)

Received: 5 September 2019 – Discussion started: 11 October 2019
Revised: 26 November 2020 – Accepted: 27 November 2020 – Published: 15 February 2021

Abstract. The amount of ice injected into the tropical           1IWCPrec and 1IWCFlash , interpreted as the uncertainty of
tropopause layer has a strong radiative impact on climate. A     our model in estimating the amount of ice injected, is smaller
companion paper (Part 1) used the amplitude of the diurnal       over land (where 1IWCPrec and 1IWCFlash agree to within
cycle of ice water content (IWC) as an estimate of ice injec-    22 %) than over ocean (where differences are up to 71 %) in
tion by deep convection, showed that the Maritime Continent      the UT and TL. The impact of the MLS vertical resolution
(MariCont) region provides the largest injection to the upper    on the estimation of 1IWC is greater in the TL (difference
troposphere (UT; 146 hPa) and to the tropopause level (TL;       between 1IWCERA5 and 1IWCERA5 of 32 % to 139 %, de-
100 hPa). This study focuses on the MariCont region and ex-      pending on the study zone) than in the UT (difference of
tends that approach to assess the processes, the areas and the   9 % to 33 %). Considering all the methods, in the UT, esti-
diurnal amount and duration of ice injected over islands and     mates of 1IWC span 4.2 to 10.0 mg m−3 over land and 0.4
over seas during the austral convective season. The model        to 4.4 mg m−3 over sea, and in the TL estimates of 1IWC
presented in the companion paper is again used to estimate       span 0.5 to 3.9 mg m−3 over land and 0.1 to 0.7 mg m−3 over
the amount of ice injected (1IWC) by combining ice water         sea. Finally, based on IWC from MLS and ERA5, Prec and
content (IWC) measured twice a day by the Microwave Limb         Flash, this study highlights that (1) at both levels, 1IWC es-
Sounder (MLS; Version 4.2) from 2004 to 2017 and precipi-        timated over land can be more than twice that estimated over
tation (Prec) measurements from the Tropical Rainfall Mea-       sea and (2) small islands with high topography present the
surement Mission (TRMM; Version 007) binned at high tem-         largest 1IWC (e.g., island of Java).
poral resolution (1 h). The horizontal distribution of 1IWC
estimated from Prec (1IWCPrec ) is presented at 2◦ × 2◦ hor-
izontal resolution over the MariCont. 1IWC is also evalu-
ated by using the number of lightning events (Flash) from        1   Introduction
the TRMM-LIS instrument (Lightning Imaging Sensor, from
2004 to 2015 at 1 h and 0.25◦ × 0.25◦ resolution). 1IWCPrec      The tropical tropopause layer (TTL) is widely recognized as
and 1IWC estimated from Flash (1IWCFlash ) are compared          a region of great importance for the climate system. The wa-
to 1IWC estimated from the ERA5 reanalyses (1IWCERA5 )           ter vapour (WV) and ice cirrus clouds in this region have a
with the vertical resolution                                     strong radiative effect (e.g. Stephens et al., 1991). Further-
                          degraded to that of MLS ob-
servations 1IWCERA5 . Our study shows that the diurnal           more, the partitioning between WV and ice in the TTL is a
cycles of Prec and Flash are consistent with each other in       consequence of dehydration processes taking place there and
phase over land but different over offshore and coastal areas    controlling the global distribution of stratospheric WV, with
of the MariCont. The observational 1IWC range between            implications for climate (e.g. Forster and Shine, 1997) and
                                                                 for stratospheric ozone chemistry (Stenke and Grewe, 2005).

Published by Copernicus Publications on behalf of the European Geosciences Union.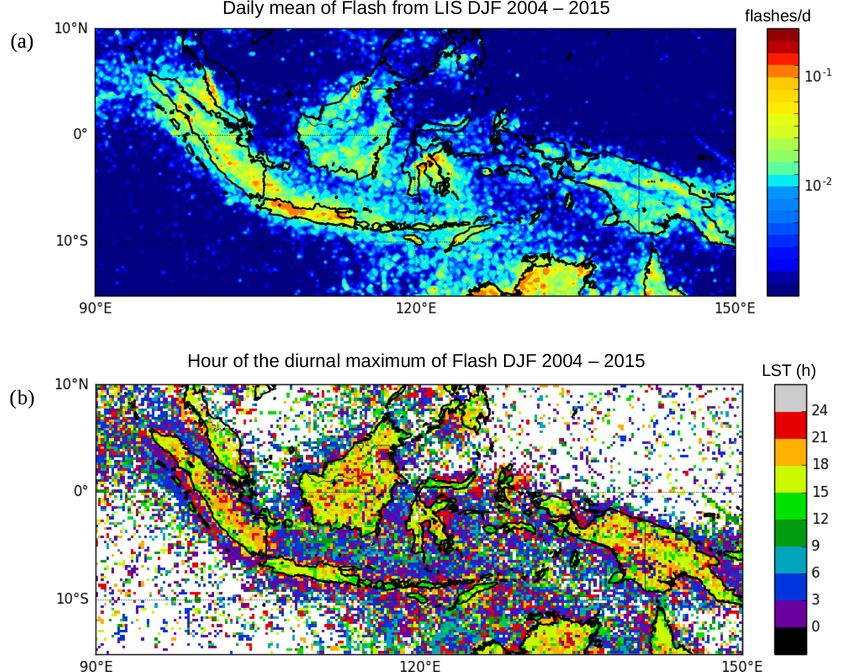
2192                                                     I.-A. Dion et al.: Ice injected into the tropopause by deep convection

WV and ice crystals are transported through the tropopause          (2001) have done a comprehensive study of the diurnal cycle
layer by two main processes: a three-dimensional large-scale        of precipitation and convection over the MariCont, the diur-
slow process (300 m month−1 ) and a small-scale fast convec-        nal cycle of ice injected by deep convection up to the TL over
tive process (diurnal timescale) (e.g. Fueglistaler et al., 2009;   this region is still not well understood. Millán et al. (2013)
Randel and Jensen, 2013). Many studies have already shown           have tentatively evaluated the upper tropospheric diurnal cy-
the impact of convective processes on the hydration of the          cle of ice from Superconducting Submillimeter-Wave Limb-
atmospheric layers from the upper troposphere (UT) to the           Emission Sounder (SMILES) measurements over the period
lower stratosphere (LS) (e.g. Liu and Zipser, 2005; Jensen et       2009 to 2010 but without differentiating land and sea over the
al., 2007; Dauhut et al., 2018; Dion et al., 2019). However,        MariCont, which caused their analysis to show little diurnal
although within the tropical UT and LS the vertical distribu-       variation over that region. Dion et al. (2019) have (1) high-
tion of water vapour is constrained by temperature, the trans-      lighted that the MariCont must be considered as two separate
port of total water (WV and ice) by convection is still poorly      areas: the MariCont land (MariCont_L) and the MariCont
quantified. The vertical distribution of water vapour in those      ocean (MariCont_O), with two distinct diurnal cycles of the
layers is constrained by thermal conditions of the CPT (cold        Prec, and (2) estimated the amount of ice injected into the UT
point tropopause) (Randel et al., 2006). Dion et al. (2019)         and the TL. Over these two domains, it has also been shown
have shown that air masses transported up to 146 hPa in the         that convective processes are stronger over MariCont_L than
UT and up to 100 hPa in the tropopause layer (TL) have ice to       over MariCont_O. Consequently, the amount of ice injected
total water ratios of more than 50 % and 70 %, respectively,        into the UT and the TL is greater over MariCont_L than over
and that ice in the UT is strongly spatially correlated with the    MariCont_O.
diurnal increases of deep convection, while WV is not. Dion            Building upon the results of Dion et al. (2019), the present
et al. (2019) hence focused on the ice phase of total water         study aims to improve their methodology by (i) studying
to estimate the diurnal amount of ice injected into the UT          smaller study zones and by distinguishing between islands
and the TL over convective tropical areas, showing that it is       and sea within the MariCont, (ii) comparing the sensitiv-
larger over land than over ocean, with maxima over land of          ity of our model to different proxies for deep convection
the Maritime Continent (MariCont), the region including In-         and (iii) comparing the amount of ice injected into the UT
donesian islands. The present study focuses on the MariCont         and the TL inferred by our model to that of ERA5 reanaly-
region in order to gain further understanding of small-scale        ses. Based on space-borne observations and meteorological
processes impacting the diurnal injection of ice up to the TL.      reanalyses, 1IWC is assessed at a horizontal resolution of
   The method used by Dion et al. (2019) to estimate convec-        2◦ × 2◦ over five islands (Sumatra, Borneo, Java, Sulawesi
tive injection of ice to the UT and TL was via estimation of        and New Guinea) and five seas (West Sumatra Sea, Java Sea,
the amplitude of the diurnal cycle of ice using twice daily (at     China Sea, North Australia Sea and Bismarck Sea) of the
01:30 and 13:30 local time) ice water content (IWC) observa-        MariCont during the convective season (December, January
tions from the Microwave Limb Sounder (MLS) instrument              and February, hereafter DJF) from 2004 to 2017. Consis-
and the full diurnal cycle of precipitation (Prec) measured         tent with Dion et al. (2019), 1IWC will be first estimated
by the Tropical Rainfall Measurement Mission (TRMM) in-             from Prec derived from TRMM-3B42. An alternative esti-
strument (at 1 h resolution). The method first focuses on the       mate of 1IWC based on the number of flashes (Flash) de-
increasing phase of the diurnal cycle of Prec (peak to peak         tected by the TRMM Lightning Imaging Sensor (TRMM-
from the diurnal Prec minimum to the diurnal Prec maxi-             LIS), another proxy for deep convection as shown by Liu
mum) and shows that the increasing phase of Prec is consis-         and Zipser (2008), is also provided. Finally, we will use IWC
tent in time and in amplitude with the increasing phase of          calculated by the ERA5 reanalyses from 2005 to 2016 to es-
the diurnal cycle of deep convection, over tropical convec-         timate 1IWC in the UT and the TL over each study zone and
tive zones and during the convective season. The amount of          compare it to 1IWC estimated from Prec and Flash.
ice (1IWC) injected into the UT and the TL is estimated by             The observational datasets used in our study are presented
relating IWC measured by MLS during the growing phase of            in Sect. 2. Methodology is reviewed in Sect. 3. The amount
the deep convection to the increasing phase of the diurnal cy-      of ice (1IWC) injected up to the TL estimated from Prec
cle of Prec. Dion et al. (2019) conclude that deep convection       is evaluated in Sect. 4. Diurnal cycles of Prec and Flash are
over the MariCont region is the main process impacting the          compared to each other over different areas of the MariCont
increasing phase of the diurnal cycle of ice in those layers.       in Sect. 5. Results of the estimated 1IWC injected up to the
   The MariCont region is one of the main convective cen-           UT and the TL over five islands and five seas of the Mari-
tres in the tropics, with the wettest troposphere and the cold-     Cont are presented and compared with the ERA5 reanalyses
est and driest tropopause (Ramage, 1968; Sherwood, 2000;            in Sect. 6. Results are discussed in Sect. 7, and conclusions
Hatsushika and Yamazaki, 2001). Yang and Slingo (2001)              are drawn in Sect. 8. This paper contains many abbreviations
have shown that, over the Indonesian area, the phase of the         and acronyms. To facilitate reading, a complete specification
convective activity diurnal cycle drifts from land to coast-        is given in the list of acronyms in Appendix A.
lines and to offshore areas. Even though Yang and Slingo

Atmos. Chem. Phys., 21, 2191–2210, 2021                                              https://doi.org/10.5194/acp-21-2191-2021
I.-A. Dion et al.: Ice injected into the tropopause by deep convection                                                    2193

2     Datasets                                                   within 24 h, the associated systematic error decreases. This
                                                                 supposes that the systematic errors are similar within each
This section presents the observational and reanalyses           temporal bin within 24 h.
datasets used for this study.
                                                                 2.2   TRMM-3B42 Precipitation
2.1    MLS ice water content
                                                                 The Tropical Rainfall Measurement Mission (TRMM) was
The Microwave Limb Sounder (MLS) was launched on                 launched in 1997 and provided measurements of precipita-
NASA’s Earth Observing System Aura platform in 2004              tion until 2015. The TRMM satellite carried five instruments,
(Waters et al., 2006). MLS follows a sun-synchronous near-       three of which (PR, TMI, VIRS) formed a complementary
polar orbit, obtaining daily near-global coverage. Ascend-       sensor suite for rainfall. TRMM had an almost circular orbit
ing (northbound) portions of the orbit cross the Equator         at 350 km altitude, performing a complete revolution in 1.5 h.
at 13:30 local time (LT); descending portions of the or-            The TRMM-3B42 product (version V7) is a multi-satellite
bit cross the Equator at 01:30 LT. Among other products,         precipitation analysis that extends the precipitation prod-
MLS provides measurements of ice water content (IWCMLS ,         uct through 2019 by merging microwave and infrared
mg m−3 ). Although optimal estimation is used to retrieve al-    space-borne observations, including TRMM measurements
most all other MLS products, a cloud-induced radiance tech-      from 1997 to 2015 (Huffman et al., 2007, 2010; Huff-
nique is used to derive IWCMLS (Wu et al., 2008, 2009).          man and Bolvin, 2018). Precipitation from TRMM-3B42
Here we use version 4.2 IWC data, filtered following the         (Prec) is provided at a 0.25◦ (∼ 29.2 km) horizontal resolu-
recommendations of the MLS team described by Livesey             tion, extending from 50◦ S to 50◦ N (https://pmm.nasa.gov/
et al. (2018). We select IWCMLS during all austral convec-       data-access/downloads/trmm, last access: 1 April 2019). De-
tive seasons (DJF) between 2004 and 2017. MLS data pro-          tails of the binning methodology of TRMM-3B42 are pro-
cessing provides IWCMLS at six levels in the upper tropo-        vided by Huffman and Bolvin (2018). The precipitation es-
sphere and lower stratosphere (UTLS; 82, 100, 121, 146,          timates do not distinguish between stratiform and convective
177 and 215 hPa). We have chosen to study only two of the        precipitation, and the implications of this will be discussed
available levels: 146 hPa as representative of the lower part    later. Work is currently underway to develop more appropri-
of the TTL (named UT for upper troposphere) and 100 hPa          ate estimators for random error and to introduce estimates
as representative of tropopause, which lies in the middle        of bias error (Huffman and Bolvin, 2018). In our study, Prec
of the TTL (named TL for tropopause level). Note that the        from TRMM-3B42 was selected over the austral convective
level at 82 hPa, representing the lower stratosphere, would      seasons (DJF) from 2004 to 2017 and at each location was
have also been very interesting to study but does not pro-       binned into 1 h intervals according to local time (LT). This
vide enough significant measurements of IWC to achieve an        was possible because of the combination between the pre-
acceptable signal-to-noise ratio. The resolution of IWCMLS       cessing orbit of the TRMM satellite and the precipitation
(horizontal along the path, horizontal perpendicular to the      analysis from the other satellites included in the TRMM-
path, vertical) measured at 146 and 100 hPa is 300×7×4 km        3B42 long-duration dataset (13 years). Finally, for each 1 h
and 200×7×5 km, respectively. In our study, we consider          interval of LT, the data were averaged to a horizontal grid of
13 years of MLS data, which allows the IWCMLS mea-               2◦ × 2◦ to be compared to IWCMLS .
surements to be averaged in bins of 2◦ (∼ 220 km) zonal
and meridional extent, over all study zones. The valid IWC       2.3   TRMM-LIS number of lightning flashes
range is 0.02–50.0 mg m−3 at 100 hPa and 0.1–50.0 mg m−3
at 146 hPa (Livesey et al., 2018). Typical single-profile pre-   The Lightning Imaging Sensor (LIS) aboard the TRMM
cisions (i.e. random noise) are 0.10 mg m−3 at 100 hPa and       satellite measures several parameters related to lightning, in-
0.20–0.35 mg m−3 at 146 hPa, and the accuracy (i.e. system-      cluding the number of flashes within a given time period. De-
atic error) is 100 % for values less than 10 mg m−3 at both      tails are given in Christian et al. (2000) and, more recently,
levels. The fact that our study is based on 13-year averages     on the NASA website (https://ghrc.nsstc.nasa.gov/lightning/
of all observations within each 2◦ × 2◦ bin implies that the     overview_lis_instrument.html, last access: 15 November
uncertainty on the averages due to measurement precision is      2020), including how the raw measurements are processed
drastically reduced. On the other hand, the systematic error     to estimate the number of flashes (Flash), subject to a detec-
on the averages will be unchanged. Our analysis, based on        tion efficiency of the instrument of 69 % at noon to 88 % at
the methodology developed in Dion et al. (2019), uses the        night (lower during the day because of background illumi-
difference between the maximum and the minimum of IWC            nation). The instrument detects lightning with a storm-scale
obtained within 24 h as an estimate of the amplitude of the      resolution of 5–10 km (5 km at nadir), and the observation
diurnal cycle of IWC and hence of the amount of ice injected     range of the sensor is between 38◦ N and 38◦ S. The LIS on
into the TL and/or the UT. By considering the difference         TRMM views a total area exceeding 580 km × 580 km at the
between the maximum and the minimum of IWC obtained              cloud top. The LIS instruments obtained measurements be-

https://doi.org/10.5194/acp-21-2191-2021                                          Atmos. Chem. Phys., 21, 2191–2210, 2021
2194                                                    I.-A. Dion et al.: Ice injected into the tropopause by deep convection

tween 1 January 1998 and 8 April 2015. To be consistent               The present study uses the IWCERA5 at 100 and 150 hPa
with the other parts of our study, we used the measurements        averaged over DJF from 2005 to 2016 with 1 h temporal res-
only for DJF from 2004–2015. As LIS is on the TRMM plat-           olution. IWCERA5 is compared to the amount of ice injected
form, the measurements can be binned in 1 h intervals of LT        into the UT and the TL as estimated by the model developed
to obtain a full 24 h diurnal cycle. The measurements could        in Dion et al. (2019). IWCERA5 data have been degraded
be further binned at either 0.25◦ × 0.25◦ or at 2◦ × 2◦ hor-       along the vertical at 100 and 150 hPa 1IWCERA5 , con-


izontal resolution to allow for comparison with Prec from          sistent with the vertical resolution of IWCMLS (5 and 4 km
TRMM-3B42.                                                         at 100 and 146 hPa, respectively) using a box function (see
                                                                   Sect. 7.2). IWCERA5 and 1IWCERA5 will both be consid-
2.4    ERA5 ice water content                                      ered in this study. IWCERA5 , initially provided in kilograms
                                                                   per kilogram (kg kg−1 ), has been converted into milligrams
The European Centre for Medium-range Weather Forecasts             per cubic metre (mg m−3 ) using the temperature provided by
(ECMWF) Reanalysis 5, known as ERA5, replaces the ERA-             ERA5 in order to be compared with IWCMLS .
Interim reanalyses as the fifth generation of the ECMWF re-
analysis, providing global climate and weather for the past
decades (from 1979) (Hersbach et al., 2018). ERA5 provides         3   Methodology
hourly estimates for a large number of atmospheric, ocean
and land surface quantities and covers the Earth on a 30 km        This section summarizes the method developed by Dion et
grid with 137 levels from the surface up to a height of 80 km.     al. (2019) to estimate 1IWC, the amount of ice injected
Reanalyses such as ERA5 combine a large number of obser-           into the UT and the TL. Dion et al. (2019) have presented
vations (space-borne, airborne and ground-based) with short-       a model relating Prec (as a proxy for deep convection) from
range forecasts. Our study uses the specific cloud ice water       TRMM to IWCMLS over tropical convective areas during the
content (mass of condensate/mass of moist air) (IWCERA5 )          austral convective season (DJF). The IWCMLS value mea-
as being representative of non-precipitating ice. Precipitat-      sured by MLS during the growing phase of the convection
ing ice, classified as snow water, is also provided by ERA5        (at x = 01:30 LT or 13:30 LT) is compared to the Prec value
but not used in this study because it is of little relevance to    at the same time (x) in order to define the correlation coeffi-
convectively injected ice in the TTL. No direct observations       cient (C) between Prec and IWCMLS , as follows:
of atmospheric ice content are provided to the ERA5 data
assimilation system, and IWCERA5 is primarily determined                IWCMLS
                                                                            x
                                                                   C=          .                                              (1)
within the forecast model by changes in the analysed temper-             Precx
ature (and at low levels, humidity), which is mostly driven
                                                                     The diurnal cycle of estimated IWC (IWCest (t)) can be
by the assimilation of temperature-sensitive radiances from
                                                                   calculated by using C applied to the diurnal cycle of Prec
satellite instruments. These determine IWCERA5 through the
                                                                   (Prec(t)), where t is the time, as follows:
model microphysics, which allows ice supersaturation with
respect to ice (100 %–150 % in relative humidity) but not          IWCest (t) = Prec(t) × C.                                  (2)
with respect to liquid water. Although microwave radiances
at 183 GHz which are sensitive to atmospheric scattering in-         The amount of IWC injected into the UT or the TL
duced by ice particles are assimilated, clouds and precipita-      (1IWCPrec ) is defined by the difference between the maxi-
tion are not used as control variables in the 4D-Var assimila-     mum of IWCest (IWCest                           est
                                                                                        max ) and its minimum (IWCmin ).
tion system and cannot be adjusted independently in the anal-
ysis (Geer et al., 2017). Furthermore, whilst the modelled mi-     1IWCPrec = C × (Precmax − Precmin )
crowave radiances are mainly sensitive to the larger ice par-
                                                                              = IWCest      est
                                                                                   max − IWCmin ,                             (3)
ticles such as those in the cores of deep convection (Geer et
al., 2017), the sensitivity to cirrus clouds in ERA5 is strongly   where Precmax and Precmin are the diurnal maximum and
dependent on microphysical assumptions of the shape and            minimum of Prec, respectively. Figure 1 illustrates the rela-
size of the cirrus particles. Observations that affect the tro-    tionship between the diurnal cycle of Prec and the two MLS
pospheric stability or humidity, or the synoptic situation, can    measurements at 01:30 and 13:30 LT. The growing phase of
affect the upper level ice cloud indirectly; e.g. changing the     the convection is defined as the period of increase in precip-
intensity of the convection will change the amount of out-         itation from Precmin to Precmax . The amplitude of the diur-
flow cirrus generated (Geer et al., 2017). A recent study of       nal cycle is defined by the difference between Precmax and
cloud ice observed by satellites and generated by reanalysis       Precmin . In Fig. 1, because the growing phase of the illus-
datasets (Duncan and Eriksson, 2018) has found that ERA5 is        trated convection is happening during the afternoon, only the
able to capture both seasonal and diurnal variability in cloud     MLS measurement at 13:30 LT is used in the calculation of
ice water but exhibits noisier and higher amplitude diurnal        1IWC. IWC at 01:30 LT is not used in that case.
variability than borne out of multi-satellite estimates.

Atmos. Chem. Phys., 21, 2191–2210, 2021                                             https://doi.org/10.5194/acp-21-2191-2021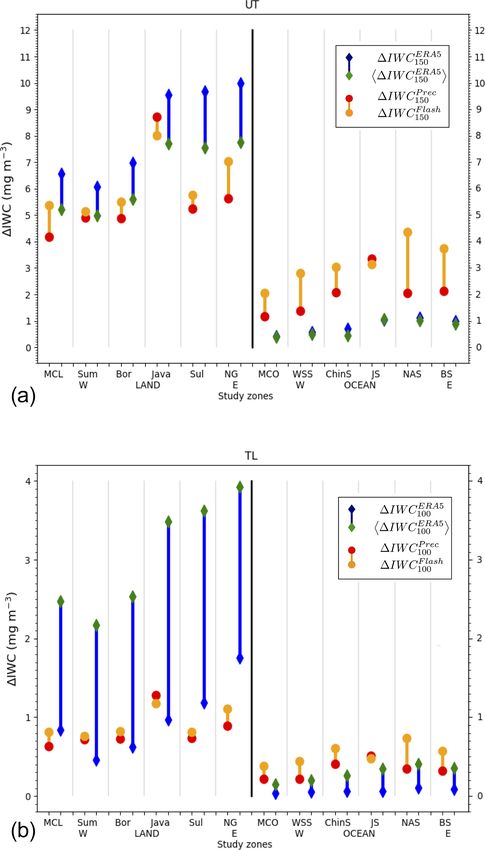
I.-A. Dion et al.: Ice injected into the tropopause by deep convection                                                            2195

Figure 1. Illustration of the model developed in Dion et al. (2019) to
estimate the amount of ice (1IWC) injected into the UT or the TL.
Diurnal cycle of a proxy for deep convection (Prec) (a) and diurnal
cycle of ice water content (IWC) estimated from diurnal cycle of the
proxy for deep convection (b). The red line is the increasing phase
of the diurnal cycle and the dashed black line the decreasing phase
of the diurnal cycle. The green diamonds are the two IWCMLS mea-
surements from MLS. The grey thick cross represents the measure-
ment of Prec during the growing phase of the convection (Precx ),
used in the model. The maximum and minimum of the diurnal cy-
cles are represented by black squares. The amplitude of the diurnal
cycle is defined by the differences between the maximum and the
minimum of the cycle.

4     Horizontal distribution of 1IWC estimated from
      Prec over the MariCont

4.1    Prec from TRMM-3B42 related to IWC from MLS

In order to identify the main regions of injection of ice in
the TL over the MariCont, Fig. 2 presents different param-
eters associated with this region: (a) the name of the main
islands and seas over the MariCont, (b) the elevation from
the Solar Radiation Data (SoDa; http://www.soda-pro.com/
web-services/altitude/srtm-in-a-tile, last access: 12 June
2019), (c) the daily mean of Prec at 0.25◦ × 0.25◦ horizon-
tal resolution, (d) the hour of the diurnal maxima of Prec               Figure 2. Main islands and seas of the MariCont (S is for Suma-
                                                                         tra) (a). Elevation from Solar Radiation Data (SoDa) (b). Daily
at 0.25◦ × 0.25◦ horizontal resolution and (e) the daily mean
                                                                         mean of Prec obtained from TRMM analysis over the Maritime
(IWC = (IWC01:30 +IWC13:30 )×0.5) of IWCMLS at 146 hPa                   Continent, averaged over the period of DJF 2004–2017 (c). Hour
at 2◦ × 2◦ horizontal resolution. Several points need to be              (local solar time (LST)) of the diurnal maxima of Prec over the
highlighted. Daily means of Prec over land and coastal re-               MariCont (d). Daily mean (01:30 LT + 13:30 LT)/2 of IWCMLS at
gions are higher than over oceans (Fig. 2c). Regions where               146 hPa from MLS over the MariCont averaged over the period of
the daily mean of Prec is maximum usually surround the                   DJF 2004–2017 (e). Observations are presented with a horizontal
highest elevation over land (e.g. over New Guinea) and near              resolution of 0.25◦ × 0.25◦ (b, c, d) and 2◦ × 2◦ (e).
coastal regions (north-west of Borneo in the China Sea and

https://doi.org/10.5194/acp-21-2191-2021                                                  Atmos. Chem. Phys., 21, 2191–2210, 2021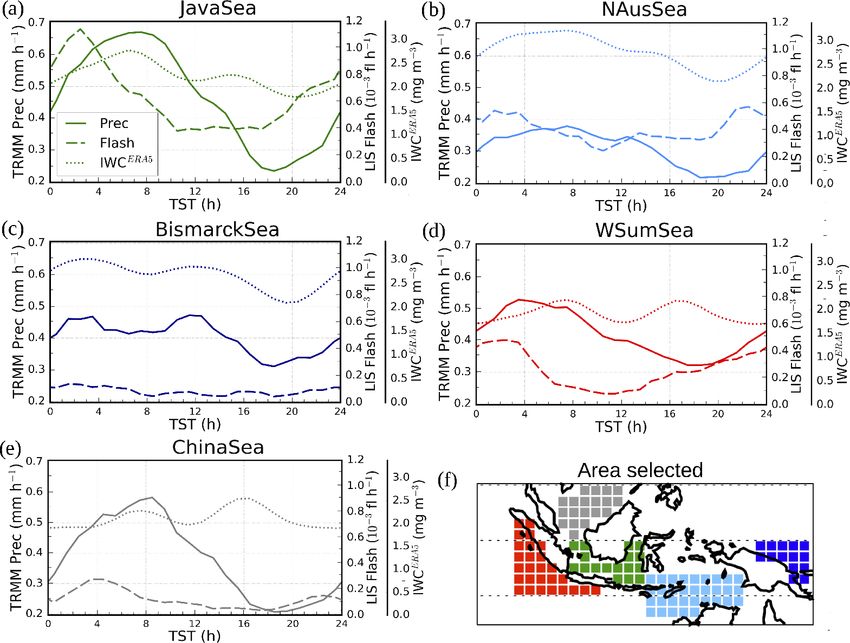
2196                                                   I.-A. Dion et al.: Ice injected into the tropopause by deep convection

southern Sumatra in the Java Sea) (Fig. 2b and c). Prec           surements of Prec or IWCMLS at 13:30 LT or 01:30 LT over
maxima are observed during the evening (18:00–00:00 LT)           the period 2004–2017 have been selected for the average.
over land, during the night until morning (00:00–06:00 LT)           The Prec anomaly at 01:30 and 13:30 LT varies be-
over the coasts, and during the morning until noon and to         tween −0.15 and +0.15 mm h−1 . The IWCMLS anomaly at
a lesser extent during the evening (09:00–12:00 and 15:00–        13:30 and 01:30 LT varies between −3 and +3 mg m−3 .
00:00 LT) over sea/ocean. These differences may be related        At 13:30 LT, the growing phase of the convection is found
to the diurnal variation of the land/sea breeze over the course   mainly over land. At 13:30 LT, over land, the strongest Prec
of 24 h. The sea breeze during the day favours land con-          and IWCMLS anomalies (+0.15 mm h−1 and +2.50 mg m−3 ,
vection at the end of the day when land surface tempera-          respectively) are found over Java and for IWCMLS over
ture is higher than oceanic surface temperature. During the       northern Australia. At 01:30 LT, the growing phase of the
night, the land surface temperature drops below the coastline     convection is found mainly over sea (while the pixels of the
sea surface temperature, and the land breeze systematically       land are mostly grey), with maxima of Prec and IWCMLS
favours the development of convection over coasts. These          anomalies over coastlines and seas close to coasts such as
observations are consistent with results presented by Qian        the Java Sea and the Bismarck Sea. Three types of regions
(2008), who explained that high precipitation is mainly con-      can be distinguished from Fig. 3: (i) regions where Prec and
centrated over land in the MariCont because of the strong         IWCMLS anomalies have the same sign (e.g. over Java, Bor-
sea-breeze convergence but also because of the combina-           neo, Sumatra, the Java Sea and the coast of Borneo or the
tion with the mountain–valley winds and cumulus merging           China Sea); (ii) regions where the Prec anomaly is positive
processes. Amplitudes of the diurnal cycles of Prec over          and the IWCMLS anomaly is negative (e.g. over the West
the MariCont will be detailed as a function of islands and        Sumatra Sea); and (iii) regions where the Prec anomaly is
sea in Sect. 5. The location of the largest concentration of      negative and the IWCMLS anomaly is positive (e.g. over the
IWCMLS (3.5–5.0 mg m−3 ; Fig. 2e) is consistent with that of      North Australia Sea at 01:30 LT). Convective processes asso-
Prec (∼ 12–16 mm d−1 ) over the West Sumatra Sea and over         ciated with these three types of regions over islands and seas
the south of the island of Sumatra. However, over North Aus-      of the MariCont are discussed in Sect. 6.
tralia Sea (including the Timor Sea and the Arafura Sea), we
observed large differences between low values of Prec (4–         4.3   Horizontal distribution of ice injected into the UT
8 mm d−1 ) and large values of IWCMLS (4–7 mg m−3 ).                    and TL estimated from Prec

4.2    Convective processes compared to IWC                       From the model developed in Dion et al. (2019) based on
       measurements                                               Prec from TRMM–3B42 and IWC from MLS and synthe-
                                                                  sized in Sect. 3, we can calculate the amount of IWC in-
Although the TRMM horizontal resolution is 0.25◦ × 0.25◦ ,        jected (1IWC) at 146 hPa (UT, Fig. 4a) and at 100 hPa (TL,
we require information at the same resolution as IWCMLS .         Fig. 4b) by deep convection over the MariCont. In the UT,
The diurnal cycle of Prec obtained from TRMM analysis             the amount of IWC injected over land (> 10–20 mg m−3 )
can be used for each 2◦ × 2◦ pixel to deduce the duration         is on average larger than over seas (< 15 mg m−3 ). South-
of the increasing phase of Prec and hence the duration of         ern Sumatra, Sulawesi, northern New Guinea and north-
the growing phase of the convection. Figure 3a and b present      ern Australia present the largest amounts of 1IWC over
the anomaly (deviation from the mean) of Prec in TRMM-            land (15–20 mg m−3 ). The Java Sea, China Sea and Bis-
3B42 over the MariCont for the pixels where convection is         marck Sea present the largest amounts of 1IWC over seas
in the growing phase at 01:30 and 13:30 LT, respectively.         (7–15 mg m−3 ). The West Sumatra Sea and North Australia
Anomalies are calculated relative to the average computed         Sea present low values of 1IWC (< 2 mg m−3 ). We note
over the entire MariCont region. Both blue and red shadings       that the anomalies of Prec and IWC during the growing
highlight regions experiencing the growing phase of convec-       phase over the North Australia Sea at 13:30 LT are positive
tion, but while reds are associated with Prec values greater      (> 0.15 mm h−1 , Fig. 3b and > 2.5 mg m−3 , Fig. 3d, respec-
than the overall MariCont mean, blues, in contrast, are as-       tively). In the TL, the maxima (up to 3.0 mg m−3 ) and min-
sociated with precipitation less than the regional mean. Pix-     ima (down to 0.2–0.3 mg m−3 ) of 1IWC are located within
els are represented in the panels for both local times when       the same pixels as in the UT, although they are 3 to 6 times
(1) the onset of the convection is before 01:30 LT and the end    lower than in the UT. The decrease of 1IWC with altitude is
is after 13:30 LT, or (2) the onset of the convection is before   larger over land (by a factor of 6) than over sea (by a factor
13:30 LT, and the end is after 01:30 LT. The grey colour de-      of 3). We note that the similar pattern between the two lay-
notes pixels for which convection is not ongoing at 01:30 LT,     ers comes from the diurnal cycle of Prec in the calculation
nor at 13:30 LT. Similar anomalies of IWCMLS over the Mari-       of 1IWC at 146 and 100 hPa. The differences in the magni-
Cont are shown in Fig. 3c and d, over pixels when the con-        tudes of the 1IWC values at 100 and 146 hPa arise from the
vection is in the growing phase at 01:30 and 13:30 LT, respec-    different amounts of IWC measured by MLS at those two
tively. Note that, within each 2◦ × 2◦ pixel, at least 60 mea-    levels. That is, similar 1IWC patterns are expected between

Atmos. Chem. Phys., 21, 2191–2210, 2021                                            https://doi.org/10.5194/acp-21-2191-2021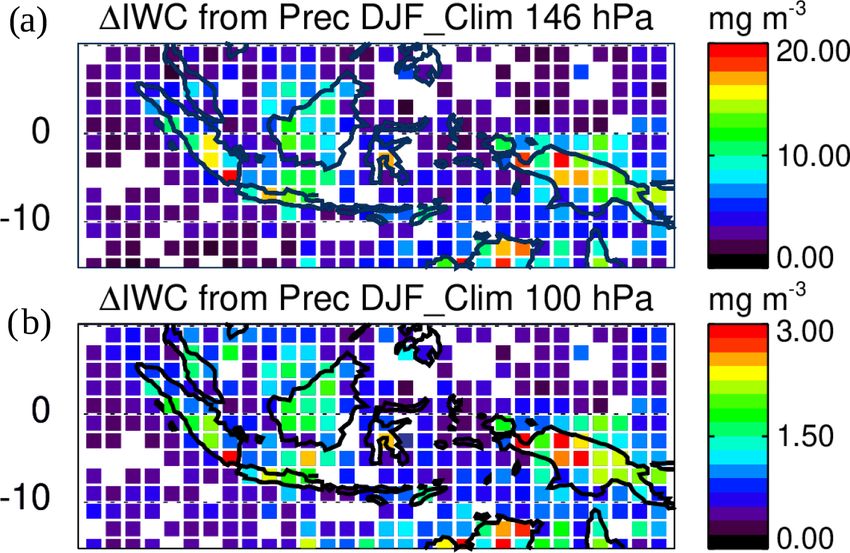
I.-A. Dion et al.: Ice injected into the tropopause by deep convection                                                               2197

Figure 3. Anomaly (deviation from the mean) of Prec (a–b) and ice water content (IWCMLS ) at 146 hPa (c–d), at 01:30 (a) and at
13:30 LT (b) over pixels where 01:30 and 13:30 LT are during the growing phase of the convection, respectively, averaged over the period of
DJF 2004–2017. The grey colour denotes pixels for which convection is not ongoing.

                                                                        plitude of the diurnal cycle of Prec, with low values of Prec
                                                                        all day long (∼ 0.25 mm h−1 ).
                                                                           Over land, the increasing phase of the Prec diurnal cy-
                                                                        cle is longer (from ∼ 09:00 to 20:00–00:00 LT) when 1IWC
                                                                        is large (Fig. 5b, c, d, e) than when 1IWC is small (from
                                                                        10:00 to 15:00–19:00 LT; Fig. 5g, h, i). Pixels labelled 1 and
                                                                        2 over New Guinea (Fig. 5d and e) and the pixel over south-
                                                                        ern Sumatra (Fig. 5c) show the amplitude of the diurnal cy-
                                                                        cle of Prec reaching 1.0 mm h−1 , while the pixel over North
                                                                        Australia (Fig. 5b) shows the lower amplitude of the diurnal
                                                                        cycle of Prec (0.5 mm h−1 ).
                                                                           IWCMLS during the growing phase of deep convection is
                                                                        also shown in Fig. 5. For pixels with large values of 1IWC,
Figure 4. Daily amount of ice injected (1IWC) up to the UT (a) and      IWCMLS is between 4.5 and 5.7 mg m−3 over North Aus-
up to the TL (b) estimated from Prec, averaged during DJF 2004–         tralia, South Sumatra and New Guinea 1. For pixels with
2017.                                                                   low values of 1IWC, IWCMLS is found between 1.9 and
                                                                        4.7 mg m−3 . To summarize, large values of 1IWC are ob-
                                                                        served over land in combination with (i) a longer growing
                                                                        phase of deep convection (> 9 h) and/or (ii) the large diur-
the two levels because, according to the model developed in
                                                                        nal amplitude of Prec (> 0.5 mm h−1 ). However, as IWCMLS
Dion et al. (2019), deep convection is the main process trans-
                                                                        ranges overlap for the high and low 1IWC, no definitive con-
porting ice into the UT and the TL during the growing phase
                                                                        clusion about the relationship between IWCMLS and 1IWC
of the convection. Convective processes associated with land
                                                                        can be drawn.
and sea are further discussed in Sect. 6.
                                                                           In the next section, we estimate 1IWC using another
   In order to understand better the role of deep convection
                                                                        proxy for deep convection, namely Flash measurements from
in determining the largest values of 1IWC per pixel, isolated
                                                                        LIS.
pixels selected in Fig. 4a are presented separately in Fig. 5a
and f. This figure shows the diurnal cycles of Prec in four pix-
els selected for their large 1IWC in the UT (≥ 15 mg m−3 ,              5   Relationship between the diurnal cycle of Prec and
Fig. 5b, c, d, e) and the diurnal cycle of Prec in four pixels se-          Flash over MariCont land and sea
lected for their low 1IWC in the UT (but large enough to ob-
serve the diurnal cycles of IWC between 2.0 and 5.0 mg m−3 ,            Lightning is created in cumulonimbus clouds when the elec-
Fig. 5g, h, i, j). Pixels with low values of 1IWC over land             tric potential energy difference is large between the base and
(Fig. 5g, h and i) present a small amplitude of diurnal cycles          the top of the cloud. Lightning can appear at the advanced
of Prec (∼ +0.5 mm h−1 ), with maxima between 15:00 and                 stage of the growing phase of the convection and during the
20:00 LT and minima around 11:00 LT. The pixel with a low               mature phase of the convection. For these reasons, in this
value of 1IWC over sea (Fig. 5j) shows an almost zero am-               section, we use Flash measured from LIS during DJF 2004–

https://doi.org/10.5194/acp-21-2191-2021                                                  Atmos. Chem. Phys., 21, 2191–2210, 2021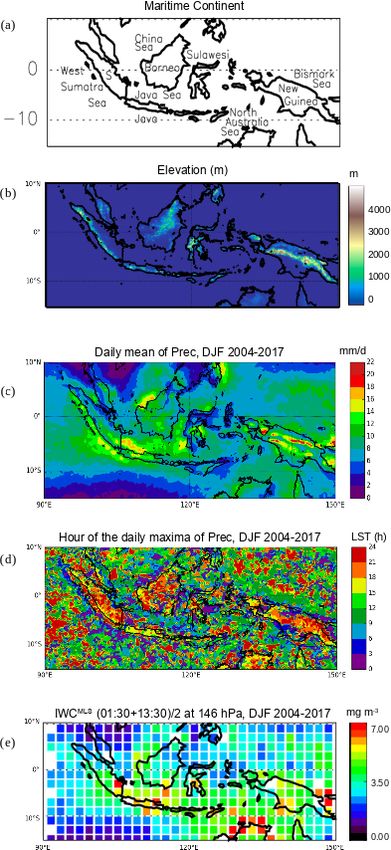
2198                                                     I.-A. Dion et al.: Ice injected into the tropopause by deep convection

Figure 5. Location of 2◦ × 2◦ pixels in Fig. 4, where (a) 1IWC > 15 mg m−3 and (f) 5 > 1IWC > 2 mg m−3 . Diurnal cycle of Prec (solid
line) over four pixels (in Fig. 4), where 1IWC > 15 mg m−3 (b, c, d, e) and 5 > 1IWC > 2 mg m−3 (g, h, i, j), during DJF 2004–2017. The
diamond represents IWCMLS during the increasing phase of the convection. The dashed line is the diurnal cycle of IWC estimated from the
diurnal cycle of Prec and from IWCMLS .

2015 as another proxy for deep convection in order to es-             tribution of Prec (Fig. 2c), maxima of Flash are found over
timate 1IWC (1IWCFlash ) and check the consistency with               similar regions to maxima of Prec (Java, east of the Su-
1IWC obtained with Prec (1IWCPrec ).                                  lawesi coast, Sumatra and northern Australia). Over Bor-
                                                                      neo and New Guinea, coastlines show larger values of Flash
5.1    Flash distribution over the MariCont                           (∼10−2 flashes d−1 ) than inland (∼10−3 flashes d−1 ). Dif-
                                                                      ferences between Flash and Prec distributions are found
Figure 6a shows the daily mean of Flash in DJF 2004–                  over the North Australia Sea, with a relatively large num-
2015 at 0.25◦ × 0.25◦ horizontal resolution. Over land,               ber of Flash (> 10−2 flashes d−1 ) compared to low Prec
Flash can reach a maximum of 10−1 flashes d−1 per pixel,              (4–10 mm d−1 ) (Fig. 2c), and over several inland regions
while, over seas, Flash is characterized by smaller values            of New Guinea, where the number of Flash is relatively
(∼ 10−3 flashes d−1 per pixel). When compared to the dis-             low (∼ 10−2 –10−3 flashes d−1 ) while Prec is high (∼ 14–

Atmos. Chem. Phys., 21, 2191–2210, 2021                                                 https://doi.org/10.5194/acp-21-2191-2021
I.-A. Dion et al.: Ice injected into the tropopause by deep convection 2199
20 mm d−1 ). Figure 6b shows the hour of the Flash max- Rutlegde (2001) and Mori et al. (2004), coastal zones are ar-
ima. Over land, maxima of Flash are mainly observed in the eas where precipitation results more from convective activ-
range 15:00–18:00 LT, while maxima of Prec (Fig. 2d) are ity than from stratiform activity and the amplitude of diurnal
mainly observed over a longer range of maxima from 18:00– maximum of Prec decreases with the distance from the coast-
24:00 LT. Coastal regions show similar hours of maximum line.
of Prec and Flash, i.e between 00:00 and 04:00 LT, although, Over offshore areas (Fig. 7c), minima of the diurnal cy-
over the West Sumatra coast, diurnal maxima of both Prec cle of Prec and the diurnal cycle of Flash are reached in
and Flash happen 1–4 h earlier (from 23:00–24:00 LT) than the late afternoon, between 16:00 and 17:00 LT (Flash) and
those of other coasts. 17:00 and 18:00 LT (Prec), whilst maxima of the diurnal
cycle of Prec and Flash are reached in the early morn-
5.2 Prec and Flash diurnal cycles over the MariCont ing, between 06:00 and 07:00 LT (Flash) and around 08:00–
09:00 LT (Prec). Results over offshore areas are consistent
This section compares the diurnal cycle of Flash with the di- with the diurnal cycle of Flash and Prec calculated by Liu
urnal cycle of Prec in order to assess the potential for Flash and Zipser (2008) over the whole tropical ocean, showing the
to be used as a proxy for deep convection over land and sea increasing phase of the diurnal cycle of Flash starting 1–2 h
of the MariCont. Diurnal cycles of Prec and Flash over the before the increasing phase of the diurnal cycle of Prec.
MariCont land, coastline and offshore (MariCont_L, Mari- The time interval between the maximum and minimum of
Cont_C and MariCont_O, respectively) are shown in Figs. Prec is always longer than that for Flash. The period after the
7a–c, respectively. Within each 0.25◦ × 0.25◦ pixel, ocean, maximum of Prec is likely more representative of stratiform
land and coast filters were applied from the SoDa eleva- rainfall than deep convective rainfall. Consistent with that
tion filter. Each pixel is designated as either land or sea. picture, model results from Love et al. (2011) have shown
Then MariCont_C is the region defined by sea pixels that the suppression of deep convection over the offshore area
are within five pixels of a land pixel. This choice of five pix- west of Sumatra from the early afternoon due to a down-
els was made after consideration of some sensitivity tests in welling wavefront characterized by deep warm anomalies
order to have the best compromise between a high signal-to- around noon. According to the authors, later in the afternoon,
noise ratio and a good representation of the coastal region. gravity waves are forced by the stratiform heating profile and
The MariCont_O is the average of all offshore pixels defined propagate slowly offshore. They also highlighted that the di-
as sea pixels excluding 10 pixels (∼ 2000 km) over the sea urnal cycle of the offshore convection responds strongly to
from the land; thus coastline pixels are excluded as well as the gravity wave forcing at the horizontal scale of 4 km. To
all the coastal influences. MariCont_L is the average over all summarize, diurnal cycles of Prec and Flash show the fol-
land pixels. lowing:
Over land, during the growing phase of the convection,
Prec and Flash start to increase at the same time (10:00– i. Over land, Flash increases proportionally with Prec dur-
12:00 LT), but Flash reaches a maximum earlier (from ing the growing phase of the convection.
15:00 LT) than Prec (from 18:00 LT), consistent with the
range of maximum hours observed in Figs. 2d and 6b. This ii. Over coastlines, the Flash increasing phase is more than
is consistent with the finding of Liu and Zipser (2008) over 6–7 h ahead of the Prec increasing phase.
the whole tropics. The different timing of the maxima could
iii. Over offshore areas, the Flash increasing phase is about
come from the fact that in the dissipating stage of the convec-
1–2 h ahead of the Prec increasing phase.
tion, the number of flashes decreases, whilst the precipitation
remains relatively high. Combining our results with the ones In Sect. 7, we investigate whether this time difference im-
presented in Dion et al. (2019), Flash and Prec can be con- pacts the estimation of 1IWC over land, coasts and offshore
sidered to be good proxies for deep convection during the areas.
growing phase of the convection over the MariCont_L.
Over coastlines (Fig. 7b), the Prec diurnal cycle is delayed 5.3 Prec and Flash diurnal cycles and small-scale
by about +2 to 7 h with respect to the Flash diurnal cycle. processes
The Prec minimum is around 18:00 LT, while the Flash min-
imum is around 11:30 LT. Maxima of Prec and Flash are In this subsection, we study the diurnal cycle of Prec and
found around 04:00 and 02:00 LT, respectively. This means Flash at 0.25◦ × 0.25◦ resolution over areas of deep convec-
that the increasing phase of Flash is 2–3 h longer than that tive activity over the MariCont. In line with the distribution
of Prec. These results are consistent with the work of Mori of large values of Prec (Fig. 2), IWCMLS (Fig. 3) and 1IWC
et al. (2004) showing a diurnal maximum of precipitation in (Fig. 4), we have selected five islands and five seas over the
the early morning between 02:00 and 03:00 LT and a diur- MariCont. Diurnal cycles of Prec and Flash are presented
nal minimum of precipitation between 11:00 and 21:00 LT over land for (a) Java, (b) Borneo, (c) New Guinea, (d) Su-
over coastal zones of Sumatra. According to Petersen and lawesi and (e) Sumatra as shown in Fig. 8 and over sea for
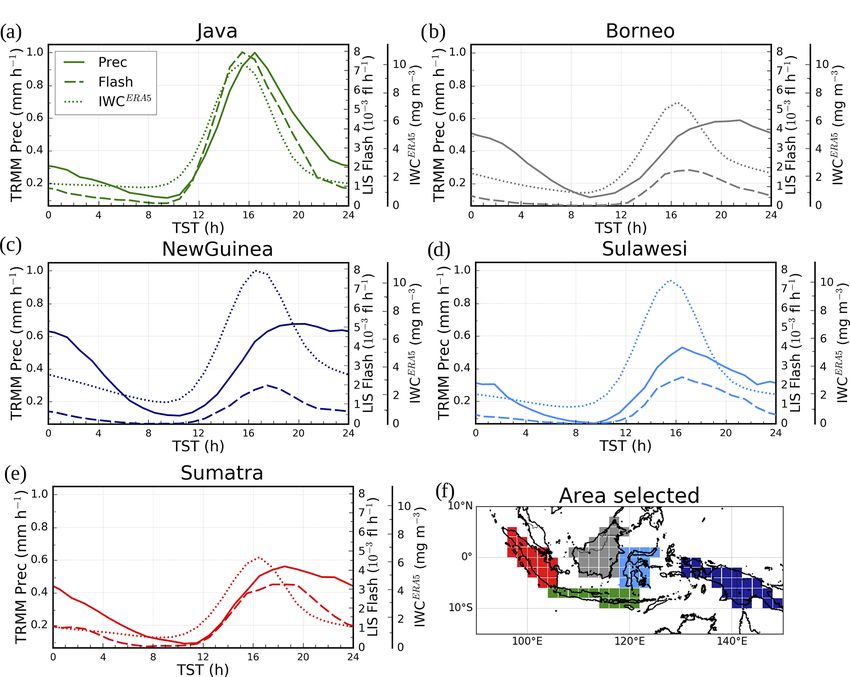
https://doi.org/10.5194/acp-21-2191-2021 Atmos. Chem. Phys., 21, 2191–2210, 20212200 I.-A. Dion et al.: Ice injected into the tropopause by deep convection Figure 6. Daily mean of Flash measured by LIS averaged over the period DJF 2004–2015 (a). Hour (local solar time (LST)) of the diurnal maximum of Flash (b). the (a) Java Sea, (b) North Australia Sea (NAusSea), (c) Bis- neo, New Guinea and Sumatra, have high mountains but also marck Sea, (d) West Sumatra Sea (WSumSea) and (e) China large lowland areas. Mountains promote deep convection at Sea as shown in Fig. 9. Diurnal cycles of IWC from ERA5 the beginning of the afternoon, while lowlands help maintain (IWCERA5 ) are also presented in Figs. 8 and 9 and will be the convective activity through shallow convection and strat- discussed in Sect. 6. iform rainfall (Nesbitt and Zipser, 2003; Qian, 2008). Deep Over land, the amplitude of the diurnal cycle of Prec is the and shallow convection are then mixed during the slow dis- largest over Java (Fig. 8a), consistent with Qian (2008), with sipating phase of the convection (from ∼ 16:00–08:00 LT). a maximum reaching 1 mm h−1 , while, over the other areas, However, because Flash is observed only in deep convec- maxima are between 0.4 and 0.6 mm h−1 . Furthermore, over tive clouds, the decreasing phase of the Flash diurnal cy- Java, the duration of the increasing phase in the diurnal cycle cle is shorter than the decreasing phase of Prec. The diurnal of Prec is 6 h, consistent with that of Flash, whereas else- maxima of Prec found separately over the five islands of the where the duration of the increasing phase is longer in Prec MariCont (at 0.25◦ × 0.25◦ resolution) are much higher than than in Flash by 1–2 h. The particularity of Java is related to the diurnal maxima of Prec found over broad tropical land the increasing phase of the diurnal cycle of Prec (6 h), which regions (South America, South Africa and MariCont_L, at is faster than over all the other land areas considered in our 2◦ × 2◦ resolution) from Dion et al. (2019): ∼ 0.6–1.0 and study (7–8 h). The strong and rapid convective growing phase ∼ 0.4 mm h−1 , respectively. However, the duration of the in- measured over Java might be explained by the fact that the creasing phase of the diurnal cycle of Prec is consistent with island is narrow, with high mountains (up to ∼ 2000 m alti- the one calculated over tropical land by Dion et al. (2019). tude, as shown in Fig. 2b) reaching the coast. The topography Over sea, the five selected areas (Fig. 9a–e) show a diur- promotes the growth of intense and rapid convective activ- nal cycle of Prec and Flash similar to that of either coast- ity. The convection starts around 09:00 LT, rapidly elevating line or offshore areas, depending on the region considered. warm air up to the top of the mountains. Around 15:00 LT, The diurnal cycle of Prec and Flash over Java Sea is simi- air masses cooled at higher altitudes are transported to the lar to the one over coastlines (Fig. 7b). Java Sea (Fig. 9a), sea, favouring the dissipating stage of the convection. Like an area mainly surrounded by coasts, shows the largest di- Java, Sulawesi is a small island with high topography. How- urnal maximum of Prec (∼ 0.7 mm h−1 ) and Flash (∼ 1.1 × ever, the amplitude of the diurnal cycle of Prec and Flash 10−3 flashes h−1 ) with the longest growing phase. In this is not as strong as over Java. Other islands, such as Bor- area, land and sea breezes observed in coastal areas impact Atmos. Chem. Phys., 21, 2191–2210, 2021 https://doi.org/10.5194/acp-21-2191-2021
I.-A. Dion et al.: Ice injected into the tropopause by deep convection 2201
18:00 LT). Over NAusSea, the diurnal minimum of Prec is
delayed by more than 9 h compared to the diurnal minimum
of Flash.
To summarize, over islands, the increasing phases of con-
vection for Flash and Prec start at the same time and increase
similarly, but the diurnal maximum of Flash is reached 1–2 h
before the diurnal maximum of Prec. Over seas, the duration
of the increasing phase of convection and the amplitude of
the diurnal cycles are not always similar, depending on the
area considered. The diurnal cycles of Flash and Prec show
some time lag as for over the North Australia Sea where the
diurnal cycle of Flash is more than 9 h ahead of the diurnal
cycle of Prec. In Sect. 7, we estimate 1IWC over the five
selected island and sea areas from Prec and Flash as a proxy
for deep convection.
6 Horizontal distribution of IWC from ERA5
reanalyses
The ERA5 reanalysis provides hourly IWC at 150 and
100 hPa (IWCERA5 ). The diurnal cycle of IWCERA5 over the
MariCont will be used to calculate 1IWCERA5 in order to
support the horizontal distributions and the amount of ice
injected into the UT and the TL deduced from our model
combining IWCMLS and TRMM-3B42 Prec or IWCMLS and
LIS flash. In assessing the consistency or lack thereof in the
comparisons between 1IWCERA5 and both 1IWCPrec and
1IWCFlash , it should be kept in mind that IWCERA5 data
quality has not yet been fully evaluated. Figure. 10a, b, c and
d present the daily mean and the hour of the diurnal max-
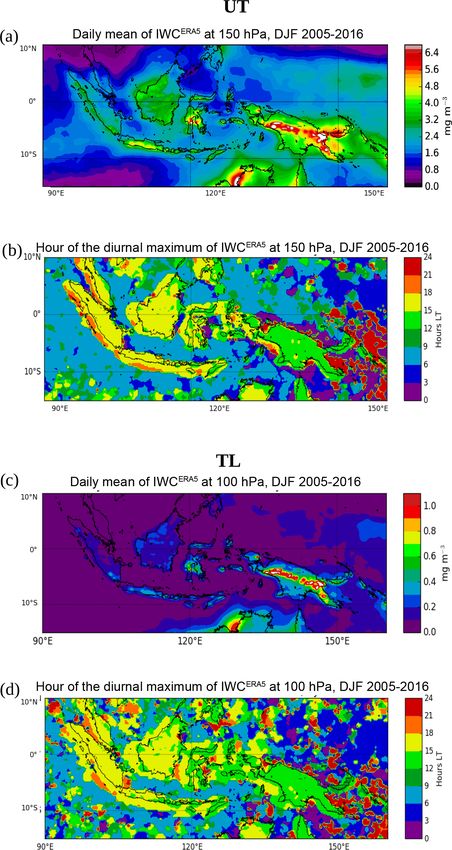
ima of IWCERA5 at 150 and 100 hPa. In the UT, the daily
mean of IWCERA5 shows a horizontal distribution over the
Figure 7. Diurnal cycle of Prec (solid line) and diurnal cycle of
MariCont consistent with that of IWCMLS (Fig. 2e), except
Flash (dashed line) over MariCont_L (a), MariCont_C (b) and
over New Guinea, where IWCERA5 (exceeding 6.4 mg m−3 )
MariCont_O (c).
is much larger than IWCMLS (∼ 4.0 mg m−3 ). The highest
amount of IWCERA5 is located over the New Guinea moun-
tain chain and over the west coast of northern Australia (ex-
the diurnal cycle of the convection (Qian, 2008). Over the ceeding 6.4 mg m−3 in the UT and 1.0 mg m−3 in the TL).
Java Sea, Prec is strongly impacted by land breezes from Over islands in the UT and the TL, the time of the IWCERA5
the islands of Borneo and Java (Qian, 2008), explaining why diurnal maximum is found between 12:00 and 15:00 LT over
Prec and Flash reach largest values during the early morn- Sulawesi and New Guinea and between 15:00 and 21:00 LT
ing. By contrast, NAusSea, Bismarck Sea and WSumSea over Sumatra, Borneo and Java, which is close to the time of
(Fig. 9b, c and d, respectively), which are large regions on the diurnal maximum of Flash over islands (Fig. 6). Over sea,
which coastal influences are likely to be weak, show a small in the UT and the TL, the time of the IWCERA5 diurnal max-
amplitude of the diurnal cycle. In our analysis, these three imum is found between 06:00 and 09:00 LT over the West
study zones are the areas including the most offshore pixels. Sumatra Sea, Java Sea and North Australia Sea, between
The China Sea shows a diurnal maximum of Flash shifted 06:00 and 12:00 LT over the China Sea and between 00:00
by about 4 h before the diurnal maximum of Prec, but the and 03:00 LT over the Bismarck Sea. There are no significant
time of the diurnal minimum of Prec and Flash is similar. differences between the time of the maximum of IWCERA5
Over the China Sea and Bismarck Sea, the diurnal cycle of in the UT and in the TL.
Flash shows a weak amplitude, with maxima reaching only The diurnal cycles of IWCERA5 at 150 hPa are presented
0.1–0.2 × 10⁻³ flashes h−1 . Furthermore, over the Bismarck in Figs. 8 and 9 over the selection of islands and seas of
Sea, while the diurnal minimum in Prec is around 18:00 LT, the MariCont together with the diurnal cycles of Prec and
there are several local minima in Flash (08:00, 14:00 and Flash. Over islands (Fig. 8), the maximum of the diurnal cy-
https://doi.org/10.5194/acp-21-2191-2021 Atmos. Chem. Phys., 21, 2191–2210, 20212202 I.-A. Dion et al.: Ice injected into the tropopause by deep convection
Figure 8. Diurnal cycles of Prec (solid line), Flash (dashed line) and IWCERA5 from ERA5 at 150 hPa (dotted line) over MariCont islands:
Java (a), Borneo (b), New Guinea (c), Sulawesi (d) and Sumatra (e) and map of the study zones over land (f).
cle of IWCERA5 is found between 16:00 and 17:00 LT, con- only the magnitude of the diurnal cycle (max–min) matters
sistent with the diurnal cycle of Prec and Flash. The dura- for the calculation of 1IWC.
tions of the increasing phase of the diurnal cycles of Prec,
Flash and IWCERA5 are all consistent with each other (6–
8 h). Over sea (Fig. 9), the maximum of the diurnal cycle
of IWCERA5 is mainly found between 07:00 and 10:00 LT 7 Ice injected over a selection of island and sea areas
over the Java Sea and North Australia Sea, consistent with
the diurnal cycle of Prec, and a second peak is found around Figure 11 synthesizes 1IWC deduced from observations and
16:00 LT. Thus, the duration of the increasing phase of the di- reanalysis in the UT and the TL over the five islands and five
urnal cycles of IWCERA5 is consistent with that of Prec over seas of the MariCont studied in the previous section.
these two sea study zones (10 h) but not with that of Flash.
Over the Bismarck Sea, the diurnal maxima of IWCERA5 are 7.1 1IWC deduced from observations
found at 04:00 LT with a second peak later at noon. Over
the West Sumatra Sea, two diurnal maxima are found at Equations (1)–(3) are used to calculate 1IWC from Prec
08:00 and 17:00 LT. Over the China Sea, the diurnal maxi- (1IWCPrec ) and from Flash (1IWCFlash ). As presented in
mum of IWCERA5 is found at 16:00 LT with a second peak the previous section, Prec and Flash can be used as two prox-
at 08:00 LT. These differences in the timing of the maximum ies for deep convection, although differences in their diur-
of the diurnal cycle of Prec, Flash and IWCERA5 observed at nal cycles may depend on the region considered. The ob-
small scale over the seas of the MariCont are not well un- servational 1IWC range calculated between 1IWCPrec and
derstood. However, these differences do not affect the calcu- 1IWCFlash provides a quantitative characterization of the un-
lation of the 1IWCPrec , 1IWCFlash or 1IWCERA5 because certainty in our model. In the following we will consider
the relative difference, expressed as a percentage, between
Atmos. Chem. Phys., 21, 2191–2210, 2021 https://doi.org/10.5194/acp-21-2191-2021I.-A. Dion et al.: Ice injected into the tropopause by deep convection 2203
Figure 9. Diurnal cycles of Prec (solid line), Flash (dashed line) and IWCERA5 from ERA5 at 150 hPa (dotted line) over MariCont seas: Java
Sea (a), North Australia Sea (NAusSea) (b), Bismarck Sea (c), West Sumatra Sea (WSumSea) (d) and China Sea (e) and map of the study
zones over sea (f).
1IWCPrec and 1IWCFlash as apply to the observational 1IWC range calculated between
1IWCPrec and 1IWCFlash in the TL as in the UT, with dif-
1IWCPrec − 1IWCFlash
r Prec−Flash = 100 × . (4) ferences of less than 0.4 mg m−3 .
1IWCPrec + 1IWCFlash × 0.5
To summarize, independent of the proxies used for the cal-
culation of 1IWC, and for both UT and TL, the island of
In the UT (Fig. 11a), over islands, 1IWC calculated over
Java shows the largest injection of ice over the MariCont. The
Sumatra, Borneo, Sulawesi and New Guinea varies from
minimum value of the observational 1IWC range over Java
4.9–7.1 mg m−3 , whereas, over Java, 1IWC reaches 8.1–
is larger than the maximum value of the observational 1IWC
8.7 mg m−3 . 1IWCFlash is generally greater than 1IWCPrec
range of other land study zones by more than 1.0 mg m−3 in
by less than 1.4 mg m−3 (with r Prec−Flash ranging from −6 %
the UT and more than 0.3 mg m−3 in the TL. Furthermore, it
to −22 % over the study zones) for all the islands, ex-
has been shown that both proxies can be used in our model,
cept for Java where 1IWCPrec is larger than 1IWCFlash by
with more confidence over land: 1IWCPrec and 1IWCFlash
0.6 mg m−3 (r Prec−Flash = 7 %). Over sea, 1IWC varies from
are more consistent with each other, both in the UT and in the
1.1 to 4.4 mg m−3 . 1IWCFlash is greater than 1IWCPrec by
TL, over islands (relative difference r Prec−Flash = +7 % to
0.6 to 2.3 mg m−3 (r Prec−Flash = −35 % to −71 %), except
−22 %) than over seas (r Prec−Flash = +6 % to −71 %). The
for the Java Sea, where 1IWCPrec is greater than 1IWCFlash
larger difference over seas is probably due to the larger con-
by 0.2 mg m−3 (r Prec−Flash = 6 %). Over the North Australia
tribution from stratiform precipitation to Prec over sea and to
Sea and West Sumatra Sea, 1IWCFlash is more than twice as
the very low values of Flash over seas (< 10−2 flashes d−1
large as 1IWCPrec (r Prec−Flash = −63 % and −71 %, respec-
per pixel).
tively).
In the TL (Fig. 11b), the observational 1IWC range is
found to be between 0.7 and 1.3 mg m−3 over islands and be-
tween 0.2 and 0.7 mg m−3 over seas. The same conclusions
https://doi.org/10.5194/acp-21-2191-2021 Atmos. Chem. Phys., 21, 2191–2210, 20212204 I.-A. Dion et al.: Ice injected into the tropopause by deep convection
Figure 11. (a) 1IWC (mg m−3 ) estimated from Prec (red) and
Flash (orange) at 146 hPa and 1IWC estimated from ERA5 at the
level 150 hPa and at the level 150 hPa degraded in the vertical, over
Figure 10. Daily mean of IWCERA5 averaged over the period DJF islands and seas of the MariCont: MariCont_L (MCL) and Mari-
2005–2016 at 150 hPa (a) and at 100 hPa (c). Time (hour, local time Cont_O (MCO); from west (W) to east (E) over land, Sumatra
(LT)) of the diurnal maximum of IWCERA5 at 150 hPa (b) and at (Sum), Borneo (Bor), Java, Sulawesi (Sul) and New Guinea (NG);
100 hPa (d). and over seas, West Sumatra Sea (WSS), China Sea (ChinS), Java
Sea (JS), North Australia Sea (NAS) and Bismarck Sea (BS). (b)
Same as in (a) but for 100 hPa.
7.2 1IWC deduced from reanalysis
1IWC from ERA5 (1IWCERA5 z0 ) is calculated in the UT and by a box of ∼ 300 × 7 × 4 km3 near the pointing tangent
the TL (z0 = 150 and 100 hPa, respectively) as the max– height. In order to compare IWCMLS and IWCERA5 , two
min difference in the amplitude of the diurnal cycle. We can steps were taken: (1) the horizontal resolution of ERA5 was
use the IWCERA5 to assess the impact of the vertical reso- degraded from 0.25◦ ×0.25◦ to 2◦ ×2◦ (∼ 200 km × 200 km),
lution of the MLS measurements on the observationally de- and (2) the vertical resolution of ERA5 was degraded by con-
rived 1IWC estimates. According to Wu et al. (2008), es- volving the vertical profiles of IWCERA5 with a box func-
timates of IWC derived from MLS represent spatially aver- tion whose width is 5 and 4 km at 100 and 146 hPa, respec-
aged quantities within a volume that can be approximated tively. IWCERA5 with degraded vertical resolution is named
Atmos. Chem. Phys., 21, 2191–2210, 2021 https://doi.org/10.5194/acp-21-2191-2021I.-A. Dion et al.: Ice injected into the tropopause by deep convection 2205
IWCERA5 . The ERA5 amount of ice injected at z0 = 150 In the following, we define the total range covering the
and 100 hPa with degraded vertical resolution 1IWCERA5 z0 ) observational and reanalysis 1IWC estimates, r Total , as the
is thus calculated from hIWCERA5
z0 i. In the following we con- maximum value of the higher range minus the minimum
sider the difference r ERA5−hERA5i between 1IWCERA5 and value of the lower range divided by the mean of these two
1IWCERA5 as follows: values. In the UT, the observational and reanalysis 1IWC
estimates span 4.2 to 10.0 mg m−3 (with r Total values from
1IWCERA5 − 1IWCERA5 20 % to 57 %) over land and 0.4 to 4.4 mg m−3 (with r Total
r ERA5−hERA5i = 100 × . (5) values from 107 % to 156 %) over sea. In the TL, the
1IWCERA5 + 1IWCERA5 × 0.5
observational and reanalysis 1IWC estimates span 0.5 to
Figure 11 shows 1IWCERA5 and 1IWCERA5 at z0 = 150 3.9 mg m−3 (with r Total values from 88 % to 134 %) over land
z0 z0
and 100 hPa, over the island and the sea study zones. In the and 0.1 to 0.7 mg m−3 (with r Total values of 142 % to 160 %)
UT (Fig. 11a), over islands, 1IWCERA5 and 1IWCERA5 over sea.
150 150
calculated over Sumatra and Borneo vary from 4.9 to Amounts of injected ice deduced from observations and
7.0 mg m−3 (r ERA5−hERA5i ranges from 20 % to 22 %), whilst reanalysis are fairly consistent over land in the UT and over
1IWCERA5 ERA5 land and sea in the TL but are inconsistent over sea in the UT.
150 and 1IWC150 over Java, Sulawesi and New
Guinea reach 7.5–10.0 mg m−3 (r ERA5−hERA5i = 21 % to However, the impact of the vertical resolution on the estima-
24 %). Over sea, 1IWCERA5 and 1IWCERA5 vary from tion of 1IWC is much larger in the TL than in the UT (r Total
150 150
−3
0.35 to 1.1 mg m (r ERA5−hERA5i = 9 % to 33 %). Over is- is larger in the TL than in the UT). At both levels, obser-
lands and sea, 1IWCERA5 ERA5 vational and reanalyses 1IWC estimated over land is more
150 is greater than 1IWC150 . The
small differences between 1IWC150 and 1IWCERA5
ERA5
over than twice as large as 1IWC estimated over sea. Although
150
islands and sea in the UT support the fact that the vertical res- Java has shown the largest values of 1IWC from observa-
olution at 150 hPa has a low impact on the estimated 1IWC. tions compared to other study zones, the reanalysis 1IWC
In the TL, over land, 1IWCERA5 and 1IWCERA5 range shows that Sulawesi and New Guinea may also reach
100 100
vary from 0.5 to 3.9 mg m −3 (r ERA5−hERA5i = −32 % to high values of 1IWC, similar to those seen over Java. How-
−138 %), with 1IWCERA5 being larger than 1IWCERA5 ever, as the ERA5 IWC data have yet to be extensively val-
100 100
−3
by as much as 2.5 mg m over some islands. Over sea, idated, it is also possible that the reanalysis overestimates
1IWCERA5 ERA5
vary from 0.05 to 0.4 mg m−3 IWC in these regions.
100 and 1IWC100
(r ERA5−hERA5i = −85 % to −139 %), with 1IWCERA5 100 lower
ERA5
than 1IWC100 by as much as 0.3 mg m−3 . The large dif-
ferences between 1IWCERA5 ERA5 8 Discussion on small-scale convective processes
100 and 1IWC100 over islands
and sea in the TL support the fact that the vertical resolution impacting 1IWC over a selection of areas
at 100 hPa has a high impact on the estimation of 1IWC.
Our results have shown that, in all the datasets used, the is-
7.3 Synthesis land of Java and the Java Sea are the two areas with the
largest amount of ice injected up to the UT and the TL over
The comparison between the observational 1IWC range and the MariCont land and sea, respectively. In this section, pro-
the reanalysis 1IWC range is presented in Fig. 11. In the UT, cesses impacting 1IWC in the different study zones are dis-
over land, observation and reanalysis 1IWC ranges agree to cussed.
within 0.1 to 1.0 mg m−3 , which highlights the robustness of
our model over land, except over Sulawesi and New Guinea, 8.1 Java, Sulawesi and New Guinea
where the observational and the reanalysis 1IWC ranges dif-
fer by at least 1.7 and 0.7 mg m−3 , respectively. Over sea, The islands of Sulawesi, New Guinea and particularly Java
the observational 1IWC range is systematically greater than have been shown as the areas of the largest 1IWC in the UT
that of the reanalysis by ∼ 1.0–2.2 mg m−3 , with systemat- and TL. Qian (2008) have used high-resolution observations
ically larger estimates derived from observations than from and regional climate model simulations to show the three
the reanalysis. The consistency between observational and main processes impacting the diurnal cycle of rainfall over
reanalysis 1IWC ranges is calculated as the minimum value the island of Java. The main process explaining the rapid and
of the higher range minus the maximum value of the lower strong peak of Prec during the afternoon over Java (Fig. 8a)
range divided by the mean of these two values. In the UT, ob- is the sea-breeze convergence around midnight. This conver-
servational and reanalysis 1IWC estimates are found to be gence caused by the sea-breeze phenomenon increases the
consistent over land, where the relative differences between deep convective activity and impacts the diurnal cycle of Prec
their ranges are less than 25 %, but inconsistent over sea, and the IWC injected up to the TL by amplifying their quan-
where differences are 62 % to 96 %. In the TL, the relative tities. The second process is the mountain–valley wind con-
differences between the observational and reanalysis 1IWC verging toward the mountain peaks, reinforcing the conver-
ranges are 0 % to 49 % over land and 0 % to 28 % over sea. gence and the precipitation. The land breeze becomes mi-
https://doi.org/10.5194/acp-21-2191-2021 Atmos. Chem. Phys., 21, 2191–2210, 2021You can also read