Impact on health and provision of healthcare services during the COVID-19 lockdown in India: a multicentre cross-sectional study
←
→
Page content transcription
If your browser does not render page correctly, please read the page content below
Open access Original research
BMJ Open: first published as 10.1136/bmjopen-2020-043590 on 19 January 2021. Downloaded from http://bmjopen.bmj.com/ on October 19, 2021 by guest. Protected by copyright.
Impact on health and provision of
healthcare services during the
COVID-19 lockdown in India: a
multicentre cross-sectional study
Rajiv Raman ,1 Ramachandran Rajalakshmi,2 Janani Surya,3
Radha Ramakrishnan,4 Sobha Sivaprasad,5 Dolores Conroy,4 Jitendra Pal Thethi,6
V Mohan,7 Gopalakrishnan Netuveli8
To cite: Raman R, ABSTRACT
Rajalakshmi R, Surya J, et al. Strength and limitations of this study
Introduction The COVID-19 pandemic resulted in a
Impact on health and provision national lockdown in India from midnight on 25 March
of healthcare services during ►► This multicentre study highlights the impact of the
2020, with conditional relaxation by phases and zones
the COVID-19 lockdown in lockdown on healthcare services and general, social
from 20 April. We evaluated the impact of the lockdown
India: a multicentre cross- and mental health of the population.
sectional study. BMJ Open in terms of healthcare provisions, physical health, mental
►► We were able to study the impact based on the se-
2021;11:e043590. doi:10.1136/ health and social well-being within a multicentre cross-
verity of lockdown by comparing phases 3 and 4
bmjopen-2020-043590 sectional study in India.
of the lockdown and also differences on impact in
Methods The SMART India study is an ongoing house-to-
►► Prepublication history and red and non-red zones and influence of lockdown in
house survey conducted across 20 regions including 11
supplemental materials for people with diabetes.
states and 1 union territory in India to study diabetes and
this paper is available online. ►► The interactions between the pandemic and lock-
To view these files, please visit its complications in the community. During the lockdown,
down have resulted in both positive and negative
the journal online (http://dx.doi. we developed an online questionnaire and delivered it in
impacts.
org/10.1136/bmjopen-2020- English and seven popular Indian languages (Hindi, Tamil,
►► As this is a cross-sectional study and data were not
043590). Marathi, Telegu, Kannada, Bengali, Malayalam) to random
collected prior to lockdown, we are unable to infer
samples of SMART-India participants in two rounds from 5
Received 10 August 2020 causality.
May 2020 to 24 May 2020. We used multivariable logistic
Revised 28 December 2020 regression to evaluate the overall impact on health and
Accepted 04 January 2021
healthcare provision in phases 3 and 4 of lockdown in red
and non-red zones and their interactions. pandemic and it was declared a global health
Results A total of 2003 participants completed this emergency by WHO on 30 January 2020.2
multicentre survey. The bivariate relationships between Preventive strategies to mitigate the mortality
the outcomes and lockdown showed significant negative rates due to this virus have been challenging
associations. In the multivariable analyses, the interactions
even in many high-income countries with low
between the red zones and lockdown showed that all
population density.3
five dimensions of healthcare provision were negatively
affected (non-affordability: OR 1.917 (95% CI 1.126 to The government of India declared a
3.264), non-accessibility: OR 2.458 (95% CI 1.549 to nationwide lockdown from 25 March 2020 as
3.902), inadequacy: OR 3.015 (95% CI 1.616 to 5.625), a preventative measure against the COVID-19
inappropriateness: OR 2.225 (95% CI 1.200 to 4.126) and pandemic in India when the numbers of
discontinuity of care: OR 6.756 (95% CI 3.79 to 12.042)) recorded cases were only 519, with nine
and associated depression and social loneliness. reported deaths.4 Although there was signif-
Conclusion The impact of COVID-19 pandemic and icant scepticism about this world’s largest
lockdown on health and healthcare was negative. The lockdown, maintaining social distancing in
© Author(s) (or their exaggeration of income inequality during lockdown can India is a mammoth challenge. Living condi-
employer(s)) 2021. Re-use be expected to extend the negative impacts beyond the
tions vary widely in India, population density
permitted under CC BY-NC. No lockdown.
commercial re-use. See rights range from an average of 1202–54 000 people
and permissions. Published by per square mile in cities such as Mumbai,
BMJ. INTRODUCTION and India is home to 17% of the global
For numbered affiliations see Social distancing is a successful mitigation population. Given the risks that India faced
end of article. strategy used to slow transmission rates if COVID-19 affected the nation at the pace
Correspondence to during communicable disease outbreaks.1 that it affected Italy and other countries, the
Dr Rajiv Raman; Unlike other virus epidemics, COVID-19, government of India had to rapidly respond
rajivpgraman@gmail.com caused by SARS-CoV-2, rapidly evolved into a with such a strategic decision.
Raman R, et al. BMJ Open 2021;11:e043590. doi:10.1136/bmjopen-2020-043590 1Open access
BMJ Open: first published as 10.1136/bmjopen-2020-043590 on 19 January 2021. Downloaded from http://bmjopen.bmj.com/ on October 19, 2021 by guest. Protected by copyright.
As population movement from outside and within India clusters stratified into urban, rural and a pre- defined
maintained the rise of cases,5 the lockdown had to be special category of population such as people with poor
extended further on three occasions, referred to as lock- access to healthcare, or cohorts that are presumed high
down phases 1 –4 and conditional relaxation of the lock- risk or low risk of developing diabetes. Each cluster will
down is still ongoing. As there were regional differences screen 800–2000 consenting participants 40 years or older
in COVID-19 cases, the 739 districts in India (average for a cumulative sample size of a minimum of 48 000.
population 1.7×10⁶ but can range from 57×103 to 4 x 10⁶) In each region, a census enumeration block that usually
were also divided into zones colour coded as red, orange consists of 125–150 households with a population of
and green during phases 2–4 based on the doubling rates, 650–700 was the primary sampling unit for urban areas
with the red zone representing the highest doubling rates. while villages were defined in the rural areas. Bigger
There was global press coverage on this lockdown villages were further divided to ensure that approximately
related disruption, chaos, financial difficulties, lack of 300 households could be covered. The house-to-house
shelter and food for the vulnerable populations, fear, survey was conducted by approaching each household in
social exclusion, stigma and misinformation on COVID- consecutive streets in each area.
19. However, there is a lack of evidence of the impact of The inclusion criteria are adults who are ≥40 years of age
this lockdown on the health of individuals at population (special groups may contain adult population of any age)
level. who are local residents of Indian origin and are willing
Given that 70% of the healthcare in India is provided to give informed consent. Exclusion criteria include
by the private sector and most only provided minimal vulnerable adults in whom it may not be possible to carry
services during the lockdown, we hypothesised that the out all the tests; pregnant and breast feeding women;
immediate consequences of lockdown would be restricted anyone in the opinion of the fields worker deemed too
healthcare provisions and negative impact on the general ill to be screened; and those who are currently partici-
health, mental health and social well-being of the popu- pating in intervention trials with investigational medic-
lation.6 Reduced capacity due to social distancing and inal products.
other restrictions after relaxation may also be a cause of In the SMART India study, diabetes was defined as
interruptions to healthcare provision. known diabetes on anti- diabetes medications or diet
We report here the results of a questionnaire-based controlled or a random blood sugar of >200 mg/mL
survey designed to study the impact on healthcare provi- (8.9 mmol/mmol).
sions and general, social and mental health of individ-
uals that participated in a multicentre study (SMART Participants for the COVID-19 questionnaire study
India).7 Our research question was ‘Will the severity of Two random samples in phases 3 and 4 of the lockdown
the pandemic and restrictiveness of lockdown stage affect were obtained from participants of the ongoing SMART
the access to healthcare and the health and well-being of India study.8 First sample was a random sample of the
the participants in the SMART India study?’ whole SMART India cohort and second random sample
included people with diabetes from the study cohort to
ensure we had a good proportion of the sample consisting
METHODS of people who would need to access healthcare. We anal-
All participants gave verbal informed consent before data ysed both samples together because of the low cell counts
collection for this survey. when adjusting for the complex design relatively large
numbers of variables. Weighting was used to ensure the
Smart India study age and gender distribution of our samples were similar
The SMART India study, funded by the Global Challenge to that of the latest census of India.
Research Fund and UK Research & Innovation (UKRI), is
a household survey on diabetes and its complications. The Severity of lockdown in India and description of zones
aim of the SMART India study is to develop practical and The lockdown in India was divided into phases. During
affordable models to (1) diagnose people with diabetes phase 1 of the lockdown, people were urged to stay
and pre-diabetes and (2) identify those at risk of diabetes indoors, all services, except healthcare and other essen-
complications so that these models can be applied to the tial services, were closed, non- essential transport was
population in low-income and middle-income countries suspended and most activities were prohibited. In phase
(LMIC) where laboratory tests are unaffordable.7 2, the country was divided into three zones: red, orange
The study sample was based on a multistage, stratified and green based on the number of cases of COVID-19
sampling technique using data from the 2011 census of and spread of the virus. In red zones, all forms of public
India and covered different geographical regions (North, transport, for example, by air, rail, road were suspended,
South, East and West) and included 11 states and 1 union most institutions were closed, and gatherings of people
territory: Assam, Chhattisgarh, Karnataka, Kerala, Madhya for any purpose was prohibited. Only emergency services
Pradesh, Uttar Pradesh, Maharashtra, Odisha, Tamil and those related to healthcare were allowed. In orange
Nadu, Telangana, West Bengal and Delhi. All survey clus- zones, outpatient departments and clinics were allowed
ters were independent samples. Each region had three to be open with social distancing norms and other
2 Raman R, et al. BMJ Open 2021;11:e043590. doi:10.1136/bmjopen-2020-043590Open access
BMJ Open: first published as 10.1136/bmjopen-2020-043590 on 19 January 2021. Downloaded from http://bmjopen.bmj.com/ on October 19, 2021 by guest. Protected by copyright.
safety precautions. Limited movements of taxis and cab- but distinct dimensions, 5 ‘A’s, were defined for access:
aggregators were allowed, and interdistrict movement adequate, accessible, affordable, appropriate and avail-
of people for permitted activities was allowed. In the able.10 We adapted questions from a patient-led survey
green zones, most restrictions were removed in a phased developed by European Patients Forum to measure
manner. access.11
In phase 3, the red zone districts continued to remain Availability of healthcare was measured using a ques-
under lockdown. The orange zone districts had no tion about ease of obtaining overall access and scored 1
public transportation but private and hired vehicles were if accessing information was not easy. Affordability was
permitted and green zone districts operated with buses measured by asking whether the participant experienced
limited to 50% capacity. In phase 4, the states were given financial difficulties due to spending on healthcare during
more power in the implementation of lockdown and the lockdown (1=sometimes or often). Accessibility of
delineation of the zones. Our COVID-19 lockdown study healthcare was measured by counting the number of
was conducted during phases 3 and 4 of the lockdown. times there was delay in getting services and dichotomised
Four lockdown stages can be described in the order of as none vs one or more. Similarly, adequacy of health-
strictness of lockdown from the least to the most: phase care was measured by three statements on provision of
3 lockdown—non- red zones, phase 3 lockdown—red information on treatment options, adapting treatment to
zones, phase 4 lockdown—non-red zones and phase 4 changing needs and involvement in the treatment deci-
lockdown—red zones. sions. We scored 1 if the response to any of the questions
was ‘No’. Finally, appropriateness was measured using a
Questionnaire question on whether the participant was treated for their
The questionnaire was designed to evaluate provision of medical condition differently to that they received prior
healthcare services and self-rated impact of COVID-19 to COVID-19 (1=treated differently).
lockdown on physical, mental and social well-being and We then measured the patient experience of health-
was developed from existing validated instruments from care during this time, which we measured by adapting
Europe. It was translated to seven different languages the communication section of a questionnaire devel-
to address non- English-
speaking population. Accuracy oped for LMIC.12 We asked five questions on whether
of the translations was checked by three health profes- on approaching healthcare providers, the participants
sionals per language. Prior to the survey being carried were treated with courtesy and respect, were listened to
out a test-run was done on 14 participants, who were and received understandable information. We scored
not part of the SMART-India study, to cross-validate the one if the response to any of these questions was ‘false’.
questionnaire. The fieldworkers from the 20 centres in Lastly, we assessed whether the quality of care patients
the SMART India study were trained to administer the received during the lockdown is a break in the continuity
questionnaire by telephone and the data were entered of care. We used the concept of ‘experienced continuity
into an electronic cloud- based database, developed of care’13 and measured it using four questions based on
specifically for the SMART India study. The data manage- four dimensions, longitudinal, relational, flexible and
ment group consisted of two project coordinators and cross-boundary.14 The binary variable was scored 1 if the
an IT expert. A checklist was prepared and weekly web response to any of these questions was ‘No’.
meetings conducted with the interviewers. In each call,
two interview forms were randomly picked and checked Measures of self-reported health impacts of COVID-19
for accuracies. The data management group monitored, The impact of the lockdown on individuals was measured
checked and verified the data entry before the database on physical health, mental health and social well-being.
was locked for analysis. Physical health was measured using a single-item compara-
tive self-rating question asking the participants ‘compared
Outcome variables with before the lock down, how is your health in general?’
The outcomes were the five dimensions of healthcare with a 5-point Likert scale response ranging from ‘very
provision viz. availability, affordability, accessibility, good’ to ‘very poor’ and dichotomised as poor heath for
appropriateness, and adequacy, patient experience and responses fair to very poor vs good and very good. Mental
continuity of care and measures of self-reported physical health was measured using the WHO-5 well-being index.15
health, depression, emotional and/or social loneliness. The responses were noted on a 6-point Likert scale scored
For this analysis, we derived binary variables describing 0 (‘at no time’) to 5 (‘all of the time’) with the scores
poor or negative outcomes using a subset of questions. converted to a percentage scale. We dichotomised the
score at the cut-offOpen access
BMJ Open: first published as 10.1136/bmjopen-2020-043590 on 19 January 2021. Downloaded from http://bmjopen.bmj.com/ on October 19, 2021 by guest. Protected by copyright.
emptiness, missing people around oneself and a feeling
of rejection. The other three items referred to social
loneliness referring to a lack of boarder engagement
with social networks. We recoded the three items of social
loneliness17 so that for all items the higher score meant
greater loneliness. The scale was further dichotomised so
that ‘none of the times’ and ‘rarely’ counted as zero and
the rest as one. The two sub scales ranged from 0 to 3
and the total loneliness score ranged from 0 to 6. The
subscales were summed only if all items were non-missing
while in computing the total score at most one missing
item among the six can be accommodated. The subscales
and the total score were dichotomised at >1 to produce
binary variables representing emotionally lonely, socially
lonely and lonely.
Statistical analysis
Sample size
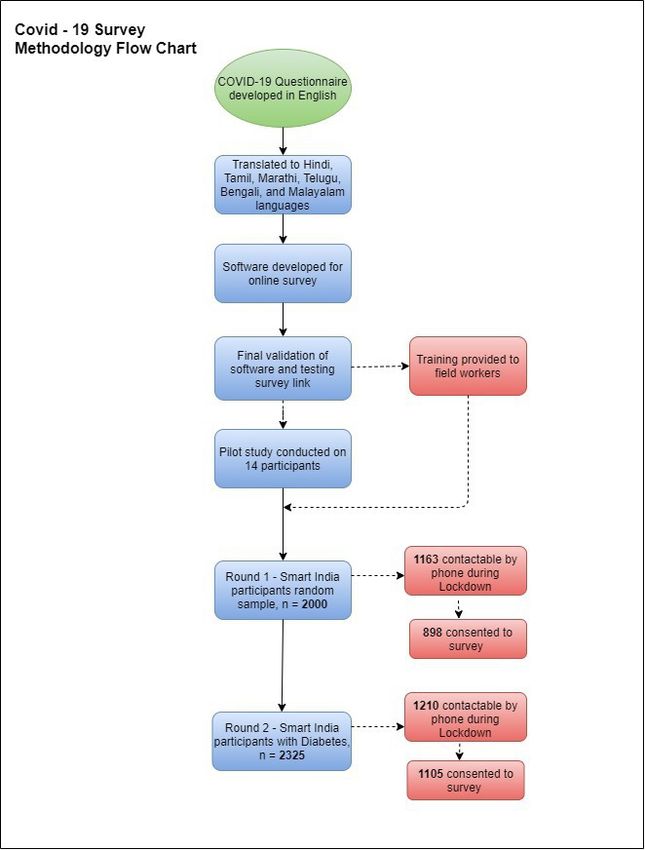
In the absence of any pre-existing data, we assumed that Figure 1 Flow diagram showing the derivation of the
a modest 50% of the participants will access healthcare random samples.
services and during the lockdown there will be a 10%
reduction in the proportion participants accessing health-
data and estimated the difference in proportion of the
care services. Based on that we computed that to identify
outcome in more strict lockdown condition (red zone in
that difference with 80% power and at a 0.05 significance
lockdown phase 4) and less strict conditions. Proportion
level, we will need 609 participants.
of times the difference was not significant (at α=0.05) was
considered as β, the probability of type II error and the
Analysis
power was then computed as 1-β. We estimated the post
The outcomes were each dimension of healthcare provi-
hoc power for changes in all outcomes.
sion and measures of self- reported physical health,
depression, emotional and/or social loneliness. Our Patient and public involvement statement
primary exposure variables were zones of lockdown (red Patients were not allowed to visit hospitals due to lock-
or not red) and phase of lockdown (phase 3 or phase 4). down, so we assumed poor patient experiences based on
Control variables in the analyses included age, gender, the increased numbers of patients calling the hospitals
rural vs urban residents, self-rated financial difficulties for advice. Patients were not involved in the design of the
(none, some or great), occupation (working or not), study and were not involved in the recruitment to and
financial situation (difficulty in meeting daily needs— conduct of the study. We intend to write a summary of the
none, some or great) and living arrangements (large results to the participants who request for it.
household, with spouse, alone or living with unrelated
individuals). In analysing this data, we took into account
the stratification in the data by multiple centres and used RESULTS
population weights by using svy commands with STATA The COVID-19 telephone survey was carried out on
(V.15). We created weights based on age and gender random samples of participants from the SMART India
distribution of the Indian population. The target popu- study cohort in two rounds, from 5 May to 24 May 2020
lation in our survey was between 25 and 90 years and the during phases 3 and 4 of the lockdown respectively. The
weights align our sample with the latest Indian Census derivation of the random samples from the SMART India
(2011) (online supplemental table S1). cohort is shown in figure 1.The survey was conducted in
Multiple logistic regression models were used to esti- the following states/union territories: Assam, Chhattis-
mate the associations between outcomes and exposures. garh, Karnataka, Kerala, Madhya Pradesh, Uttar Pradesh,
In all models, we included an interaction term between Maharashtra, Odisha, Tamil Nadu, Telangana, West
red zone and lockdown stage. Other interactions such Bengal and Delhi. There was no change in zone clas-
as between zones, stage and presence of diabetes were sification between round 1 and 2 of the survey. A total
tested but were not significant and not used in the final of 2373/4325 (55%) were contactable by telephone
models tested. The analyses took into account stratifica- and 2003/2373 (84%) consented and responded to the
tion by centres and population weights. questionnaires.
After a reviewer had suggested that our sample size The participant characteristics are shown in table 1.
might lack sufficient power, we estimated post hoc power Nearly 83% of the sample were aged 30–65 years, repre-
through simulation. For this, we drew 10 000 random senting the population most likely be affected by the lock-
samples with replacement with the same size as our down. More than half the sample were men and nearly
4 Raman R, et al. BMJ Open 2021;11:e043590. doi:10.1136/bmjopen-2020-043590Open access
BMJ Open: first published as 10.1136/bmjopen-2020-043590 on 19 January 2021. Downloaded from http://bmjopen.bmj.com/ on October 19, 2021 by guest. Protected by copyright.
Table 1 Participant characteristics and distribution among lockdown stages
Lockdown stages (100%)
Three Four
Non-red Red zone Non-red Red zone
Control variables N=2003 (%) zone N=306 N=592 zone N=349 N=756
Age Weighted % in the cross-table between lockdown
stages and control variables
25–29 years 51 (2.5) 7.9 9 0 0
30–65 years 1668 (83.3) 10.9 21.9 12 27.7 F(2, 4008.6) =10.534
>65 years 284 (14.2) 1.7 2.5 2.4 4.1 p≤0.001
Gender
Male 1098 (54.8) 7.8 19.4 7 16.5 F(1.93, 3818.53) =2.675
Female 905 (45.2) 12.7 14 7.4 15.2 p=0.071
Working (missing=1)
No 820 (41.0) 9.1 9.4 6.6 13.3 F(1.50, 2974.84) =2.605
Yes 1182 (59.0) 11.4 23.9 7.8 18.5 p=0.090
Area 0 0 0 0
Urban 1516 (75.7) 17.5 23 11.9 24.1 F(1.88, 3729.12) =4.040
Rural 487 (24.3) 3 10.3 2.5 7.6 p=0.020
Living arrangements
Alone 171 (8.5) 9.6 21.6 10 27.8
With my spouse 180 (9.0) 3 6.4 1.2 1.8
With my spouse, children 1561 (77.9) 1.1 4.7 1.3 2 F(4.08, 8090.17) =15.361
and others
With non-related others 91 (4.5) 6.8 0.7 1.9 0.1 p≤0.001
Financial circumstances missing=17
No difficulties 715 (36.0) 12.8 15.4 7.9 6.4
Some difficulties 865 (43.5) 6.5 12.3 4.9 16.3 F(2.61, 5129.13) =13.811
Great difficulties 406 (20.4) 1.2 5.6 1.6 9.1 p≤0.001
Diabetes
Absent 746 (37.2) 18.3 29.5 0 0 F(2.06, 4092.32) =423.311
Present 1257 (62.8) 2.2 3.9 14.4 31.7 pOpen access
BMJ Open: first published as 10.1136/bmjopen-2020-043590 on 19 January 2021. Downloaded from http://bmjopen.bmj.com/ on October 19, 2021 by guest. Protected by copyright.
In the case of health and well-being outcomes, the lock-
Table 2 Associations of lockdown stage and zones with
healthcare and health variables down related variables had fewer significant associations.
The interaction between the zones and stages of lock-
Unadjusted OR (95% CI)
down was significantly associated with depression (OR
Lockdown stages Four (ref: 3)
1.752 (95% CI 1.065 to 2.882)) and social loneliness (OR
Zones Red (Ref: non-red) 2.96 [95% CI 1.306 to 6.709]).
Healthcare variables Consistently, financial difficulties predicted nega-
Non-availability 1.17 (0.79 to 1.72) 2.61 (1.49 to 4.56) tive outcomes in healthcare service provision as well as
Non-affordability 1.93 (1.44 to 2.60) 2.22 (1.47, 3.35) general, psychological and social well-being. On exploring
further, we discovered that the effect of financial difficul-
Non-accessibility 2.74 (2.03 to 3.70) 1.93 (1.26 to 2.94)
ties were considerably larger for three outcomes during
Inadequacy 1.91 (1.42 to 2.57) 3.06 (1.97 to 4.74)
the most severe lockdown compared with other times
Inappropriate 5.76 (4.29 to 7.72) 2.65 (1.81 to 3.88) (non-accessibility: OR 11.81 (95% CI 6.24 to 22.33) vs OR
Discontinuity of care 2.16 (1.49 to 3.12) 0.62 (0.40 to 0.95) 1.82 (95% CI 1.34 to 2.46), relative difference (RD)=6.5;
Negative patient 0.75 (0.46 to 1.21) 4.91 (2.43 to 9.90) inappropriateness: OR 10.33 (95% CI 2.95 to 36.21) vs
experience OR 10.33 (95% CI 2.95 to 36.21), RD=3.7; discontinuity
Health and well-being of care: OR 15.22 (95% CI .58 to 30.57) vs OR 2.94 (95%
Poor health 2.00 (1.36 to 2.94) 0.91 (0.53 to 1.57) CI 2.08 to 4.15). See online supplemental table S2 for
WHO-5 screening for 2.61 (1.99 to 3.42) 2.99 (2.13 to 4.21) other results.
depression Post hoc sample size power analyses using simulation
Emotional loneliness 1.70 (1.22 to 2.37) 4.35 (2.86 to 6.62) showed that the rejection rate with our sample size alpha
Social loneliness 2.57 (1.58 to 4.16) 1.16 (0.54 to 2.53) level of 0.05 was 0% for all outcomes except for non-
Loneliness 1.97 (1.06 to 3.65) 3.55 (1.62 to 7.81)
availability (8.4%), negative patient experience (93.8%)
(emotional and/or and poor health (8.1%).
social)
DISCUSSION
Though lockdown was introduced as an urgent national
complex nature of the relationships between our expo-
mitigation strategy against COVID-19, our cross-sectional
sure variables and the outcomes. study has shown the degree to which healthcare provision
Our main exposures of interest are the lockdown stages and health and well-being of people were affected during
and zones. In tables 3 and 4, we present the results for their lockdown in India, especially in the red zone.
main effects and interaction between them on healthcare The unadjusted associations in this study showed that
provision and health and well- being. The main effect lockdown affected access to healthcare and health and
of the lockdown stage is the effect of lockdown stage 4 well-being of the participants negatively. However, multi-
and non-red zones on the outcomes; the main effect of variable logistic regression models revealed that the nega-
red zone is the effect of red zone and lockdown stage 3 tive influences of the lockdown were mainly in areas of
on the outcomes; and the interaction effect is the effect high burden of the pandemic. In contrast, availability of
of red zone and lockdown stage four on the outcomes. healthcare, negative patient experience and poor health
The main effects and interaction should be considered were not associated with lockdown in these models.
together when discussing the impact of COVID-19 lock- Among the health outcomes, mental health and loneli-
down on healthcare and health. ness were affected by the lockdown and the burden of
Except for healthcare availability and negative experi- pandemic while self-reported poor health had no impact.
ence, on all other healthcare outcomes, the interaction These results were similar to other studies from India.10 18
between the zones and stages of lockdown had significant Verma and Mishra6 in their survey during the first lock-
negative association (Non- availability: OR 0.626 (95% down in India reported the prevalence of moderate to
CI 0.321 to 1.221), non- affordability: OR 1.917 (95% severe depression, anxiety and stress to be 25%, 28% and
CI 1.126 to 3.264), non-accessibility: OR 2.458 (95% CI 11.6%, respectively, in the study participants.
1.549 to 3.902), inadequacy: OR 3.015 (95% CI 1.616 to However, the relation of the pandemic and lockdown is
5.625), inappropriateness: OR 2.225 (95% CI 1.200 to more complex. Our study supports previous reports that
4.126), negative patient experience: OR 0.295 (95% CI COVID-19 pandemic has resulted in some unexpected
0.069 to 1.264) and discontinuity of care: OR 6.756 [95% and sometimes beneficial outcomes due to changes in
CI 3.79 to 12.042]). This meant that in the most severe human behaviour and system responses.19 One such
forms of lockdown, there was two to three times lack in beneficial effect in our study was that the continuity of
healthcare service provision. In the earlier stage of lock- care was better in areas with greater impact of the COVID-
down, there was nearly four times reduction in the avail- 19. This could be the result on the focus on vulnerable
ability of healthcare services and six times more negative population with pre-existing conditions. However, where
patient experience. the impact of the pandemic was higher and lockdown was
6 Raman R, et al. BMJ Open 2021;11:e043590. doi:10.1136/bmjopen-2020-043590Table 3 Factors associated with impact on different dimensions of healthcare services provision
Negative patient
Non-availability Non-affordability Non-accessibility Inadequacy Inappropriate experience Discontinuity of care
Variables OR (95% CI) OR (95% CI) OR (95% CI) OR (95% CI) OR (95% CI) OR (95% CI) OR (95% CI)
Red zone (main effects) 3.545 (2.163 to 5.81) 0.956 (0.597 to 1.531) 0.955 (0.678 to 1.344) 1.584 (0.94 to 2.67) 1.021 (0.604 to 1.728) 5.694 (1.978 to 16.388) 0.299 (0.191 to 0.468)
Lockdown stage 4 (main 1.716 (0.991 to 2.974) 0.965 (0.595 to 1.566) 0.739 (0.492 to 1.11) 0.518 (0.299 to 0.897) 1.420 (0.775 to 2.603) 1.050 (0.268 to 4.108) 0.430 (0.257 to 0.719)
effects)
Interaction red zone and 0.626 (0.321 to 1.221) 1.917 (1.126 to 3.264) 2.458 (1.549 to 3.902) 3.015 (1.616 to 5.625) 2.225 (1.200 to 4.126) 0.295 (0.069 to 1.264) 6.756 (3.79 to 12.042)
lockdown stage 4
Age (Ref. 30–64 years)
Less than 30 years 0.379 (0.128 to 1.123) 0.195 (0.063 to 0.599) 0.103 (0.023 to 0.470) 0.415 (0.136 to 1.267) Omitted Omitted 0.280 (0.115 to 0.684)
Raman R, et al. BMJ Open 2021;11:e043590. doi:10.1136/bmjopen-2020-043590
More than 65 years 1.158 (0.795 to 1.687) 0.923 (0.672 to 1.268) 1.033 (0.77 to 1.385) 1.337 (0.992 to 1.803) 1.058 (0.75 to 1.493) 0.717 (0.387 to 1.326) 0.947 (0.678 to 1.323)
Females (Ref. males) 1.071 (0.653 to 1.757) 0.816 (0.583 to 1.141) 0.888 (0.611 to 1.289) 1.708 (1.245 to 2.342) 0.376 (0.271 to 0.520) 0.679 (0.43 to 1.071) 1.346 (0.947 to 1.914)
Working (Ref. not working) 1.241 (0.637 to 2.417) 0.979 (0.694 to 1.379) 0.86 (0.574 to 1.288) 1.084 (0.760 to 1.547) 0.740 (0.531 to 1.03) 0.422 (0.256 to 0.696) 1.517 (1.075 to 2.143)
Living arrangements (Ref. large household)
Alone 2.143 (1.022 to 4.491) 1.228 (0.711 to 2.123) 1.021 (0.611 to 1.707) 1.854 (0.987 to 3.483) 1.595 (0.971 to 2.62) 3.131 (1.645 to 5.959) 0.959 (0.575 to 1.6)
With my spouse 1.912 (0.988 to 3.699) 1.067 (0.753 to 1.512) 1.215 (0.872 to 1.692) 1.153 (0.817 to 1.627) 1.332 (0.814 to 2.18) 1.536 (0.726 to 3.252) 0.82 (0.527 to 1.274)
With non-related others 6.758 (1.238 to 36.889) 1.089 (0.385 to 3.08) 0.796 (0.305 to 2.077) 1.2 (0.499 to 2.882) 1.507 (0.789 to 2.879) 1.579 (0.335 to 7.438) 13.515 (3.07 to 59.5)
Financial difficulties (Ref. none)
Some difficulties 3.998 (2.824 to 5.661) 7.239 (5.15 to 10.176) 2.94 (2.229 to 3.878) 5.741 (3.888 to 8.477) 4.223 (2.854 to 6.251) 4.1 (2.051 to 8.197) 4.318 (3.153 to 5.913)
Great difficulties 4.885 (3.383 to 7.053) 14.265 (9.846 to 20.669) 2.113 (1.609 to 2.776) 6.05 (4.14 to 8.842) 8.316 (5.372 to 12.872) 9.596 (4.96 to 18.566) 6.81 (4.687 to 9.896)
Rural region (ref. urban) 0.78 (0.529 to 1.15) 1.611 (1.261 to 2.06) 1.122 (0.847 to 1.487) 0.893 (0.665 to 1.2) 1.849 (1.386 to 2.465) 0.659 (0.38 to 1.144) 0.809 (0.587 to 1.114)
Has diabetes (ref. No) 0.504 (0.37 to 0.684) 0.636 (0.471 to 0.860) 1.372 (1.051 to 1.791) 1.113 (0.837 to 1.481) 2.26 (1.432 to 3.566) 1.645 (0.949 to 2.85) 0.999 (0.74 to 1.35)
Bold results are significant.
Open access
7
BMJ Open: first published as 10.1136/bmjopen-2020-043590 on 19 January 2021. Downloaded from http://bmjopen.bmj.com/ on October 19, 2021 by guest. Protected by copyright.8
Open access
Table 4 Impact of lockdown on general health, mental health and social well-being
WHO-5 screening for Loneliness emotional
Poor health depression Emotional loneliness Social loneliness and/or social
Variables OR (95% CI) OR (95% CI) OR (95% CI) OR (95% CI) OR (95% CI)
Red zone (main effects) 0.859 (0.556 to 1.329) 1.526 (1.129 to 2.063) 3.362 (2.368 to 4.774) 0.565 (0.301 to 1.06) 2.115 (1.067 to 4.191)
Lockdown stage 4 (main effects) 1.219 (0.755 to 1.968) 1.428 (0.878 to 2.325) 1.983 (1.198 to 3.283) 0.854 (0.443 to 1.643) 1.978 (1.064 to 3.678)
Interaction Red zone and lockdown 1.148 (0.65 to 2.028) 1.752 (1.065 to 2.882) 0.821 (0.5 to 1.348) 2.96 (1.306 to 6.709) 1.254 (0.516 to 3.05)
stage 4
Age (ref. 30–64 years)
Less than 30 years 0.234 (0.075 to 0.731) Omitted 0.249 (0.093 to 0.667) 0.345 (0.114 to 1.048) 1.079 (0.327 to 3.56)
More than 65 years 2.085 (1.494 to 2.908) 0.842 (0.619 to 1.146) 0.757 (0.552 to 1.039) 1.224 (0.816 to 1.836) 1.524 (0.873 to 2.66)
Females (ref. males) 2.22 (1.482 to 3.326) 0.872 (0.677 to 1.123) 0.627 (0.473 to 0.832) 0.828 (0.479 to 1.433) 1.388 (0.789 to 2.445)
Working (ref. not working) 1.615 (0.882 to 2.955) 0.827 (0.635 to 1.079) 0.763 (0.573 to 1.016) 1.521 (0.703 to 3.292) 2.262 (0.875 to 5.847)
Living arrangements (ref. large household)
Alone 2.131 (1.303 to 3.484) 1.193 (0.779 to 1.825) 2.986 (1.648 to 5.41) 0.859 (0.401 to 1.843) 0.828 (0.35 to 1.959)
With my spouse 0.694 (0.466 to 1.034) 2 (1.43 to 2.796) 1.271 (0.856 to 1.889) 3.152 (1.292 to 7.686) 1.077 (0.564 to 2.056)
With non-related others 10.037 (2.366 to 42.582) 0.912 (0.478 to 1.741) 0.328 (0.134 to 0.8) 1.713 (0.389 to 7.53) 0.52 (0.172 to 1.569)
Financial difficulties (ref. None)
Some difficulties 2.244 (1.592 to 3.164) 5.344 (3.942 to 7.246) 1.621 (1.111 to 2.366) 2.46 (1.496 to 4.045) 1.995 (1.091 to 3.647)
Great difficulties 5.514 (3.882 to 7.834) 6.895 (4.86 to 9.783) 2.664 (1.823 to 3.895) 3.59 (2.22 to 5.806) 3.474 (1.873 to 6.444)
Rural region (ref. urban) 0.986 (0.766 to 1.27) 1.243 (0.978 to 1.58) 1.192 (0.913 to 1.556) 0.657 (0.435 to 0.992) 1.023 (0.669 to 1.563)
Has diabetes (ref. no) 1.287 (0.967 to 1.715) 0.652 (0.471 to 0.902) 0.705 (0.504 to 0.987) 0.931 (0.664 to 1.304) 0.692 (0.463 to 1.033)
Bold results are significant.
Raman R, et al. BMJ Open 2021;11:e043590. doi:10.1136/bmjopen-2020-043590
BMJ Open: first published as 10.1136/bmjopen-2020-043590 on 19 January 2021. Downloaded from http://bmjopen.bmj.com/ on October 19, 2021 by guest. Protected by copyright.Open access
BMJ Open: first published as 10.1136/bmjopen-2020-043590 on 19 January 2021. Downloaded from http://bmjopen.bmj.com/ on October 19, 2021 by guest. Protected by copyright.
more restrictive, the healthcare outcomes were signifi- was amended and approved by the Ministry of Health
cantly poor with the exceptions of non-availability and and Family Welfare, Government of India officially on
negative patient experience. We cannot offer an explana- 25 March 2020.24 Thus, telehealth practices are adopted
tion why more restrictive lockdown offered protection in to a variable extend in the regions where the study was
these cases. done. Although, most healthcare providers have rapidly
Several factors may account for the deteriorating switched to telephone and video consultations to keep in
mental health including the fear of COVID-19 infection, touch with their patients, our study shows that people do
the fear of the unknown in terms of the length period of not perceive that postlockdown treatment they receive is
lockdown and the pandemic, consequences of the lock- appropriate compared with prelockdown. This requires
down on finances and well-being, continuous exposure a significant change in perceptions of both clinical staff
to reports on COVID-19 deaths worldwide and reduced and patients on adjusting to these uncertain times.
access to extended family, friends and other social support Our study results are in keeping with a recent predic-
systems. It is also interesting to note that social loneliness tive modelling on the impact of lockdown, Ghosal et
increased. This may represent the inability to cope with al projected that the duration of lockdown is directly
the restrictions despite the availability of internet and proportional to the worsening of glycaemic control and
smartphone technology to stay connected. predicted an increase in diabetes-related complications
We found the income inequality to be consistent with consequent additional load on an already over-
across all outcomes with the likelihood of poor outcomes burdened public healthcare system.25 Another report
increasing as financial difficulties increased. Greater finan- indicated that the lockdown could cause weight gain
cial difficulties were associated with significantly greater due to poor physical activity, increased snacking and
odds of non- accessibility to healthcare (twelve times), consumption of calorie- rich foods.26 On the contrary,
inappropriate health provision (eleven times) and discon- a recent survey of people with type 2 diabetes in India
tinuity of care (fifteen times). Greater financial stress also showed better mean glycaemic control during lockdown
predicted poorer mental health, higher anxiety, depres- compared with before lockdown.27 In our sensitivity
sion and stress. It also modified the relationship between analysis, we found that diabetes had no influence on the
our main exposures and the outcomes (see online supple- relationship between our outcomes and lockdown status.
mental table S2). Historically pandemics accentuate the Although it as assumed that during the lockdown period,
impact of socioeconomic inequalities and COVID-19 is challenges in procuring regular prescribed medicines or
no exception.20 21 As a result, the impact of the COVID-19 lifestyle changes related to dietary habits, physical activity
pandemic will extend beyond the pandemic itself due disruption could adversely impact people with diabetes,
to sustained and exaggerated inequalities, unless appro- our results suggest that people with diabetes seem to cope
priate policy responses are made. The Government of with adversities of lockdown probably because they are
India took a step in the right direction by reducing the already aware of available healthcare services. Indeed, the
financial burden on people such as an offer of optional lockdown may have had a positive impact on some people,
moratorium on equated monthly instalments of all types having more time to change to a healthier lifestyle.
of loans until the end of August 2020. The strengths of this study are that we were able to
The need for social distancing, use of personal protec- provide valuable information on the health impact
tion equipment, avoidance of surgery that may generate during the COVID-19 lockdown in India. Because of
aerosols, testing of patients and staff and need for our ongoing SMART India study, we were able to rapidly
compulsory quarantine before a hospital admission have develop and deliver the questionnaire to participants
all caused significant constraints on the access, adequacy who were accessible by telephone. The questionnaire
and appropriateness of healthcare services globally. was developed mainly from previously validated question-
These points were emphasised in the WHO report that naires. As far as we are aware, this is the first multicentre
stressed that the movement restriction measures of study in India conducted during the lockdown that eval-
lockdown have considerable social and economic costs uated the impact of the lockdown on healthcare services
and should be implemented with the understanding, and general, social and mental health of the population.
consent and participation of communities, and based Our sample contained sufficient numbers of people with
on the principle of doing no harm.22 In India, Kerala’s other known risk factors. About 20% of the sample were
Abraham Committee report on post-lockdown planning in the older age group. The sample also had adequate
also cautioned that the ‘cure could be more expensive numbers of younger individuals to understand the impact
than the disease’ and called for a graded approach to in this group as recent data indicates that median age of
tackling the epidemic.23 Legislation of telemedicine is COVID-19 infection in India is 38 years compared with
an important step in tackling the restrictions imposed the older age groups observed in the Western countries.6
on the current face to face consultations. The board of Indians are among the ethnicities that face a statistically
governors of Medical Council of India adopted the ‘Tele- higher risk of death from COVID-19 compared with those
medicine Practice Guidelines’ which includes the overar- of white ethnicity.28 From our models, we were also able to
ching principles and practical framework of telemedicine report that diabetes had no influence on the relationship
for the country. In the wake of COVID-19 outbreak, it between our outcomes and lockdown status. Our post
Raman R, et al. BMJ Open 2021;11:e043590. doi:10.1136/bmjopen-2020-043590 9Open access
BMJ Open: first published as 10.1136/bmjopen-2020-043590 on 19 January 2021. Downloaded from http://bmjopen.bmj.com/ on October 19, 2021 by guest. Protected by copyright.
hoc sample size calculation by simulation showed that the of the translations (including but not limited to local regulations, clinical guidelines,
study had sufficient power for all the outcomes except the terminology, drug names and drug dosages), and is not responsible for any error
and/or omissions arising from translation and adaptation or otherwise.
negative patient experience due to its low probability in
Open access This is an open access article distributed in accordance with the
the study. Creative Commons Attribution Non Commercial (CC BY-NC 4.0) license, which
Our study might be limited by its cross- sectional permits others to distribute, remix, adapt, build upon this work non-commercially,
nature and use of participants of an existing study as the and license their derivative works on different terms, provided the original work is
sampling frame. However, the existence of an accessible properly cited, appropriate credit is given, any changes made indicated, and the use
is non-commercial. See: http://creativecommons.org/licenses/by-nc/4.0/.
sample of randomly selected households across India was
a motivating factor to undertake this study in the rapidly ORCID iD
changing lockdown scenarios. Although our measures are Rajiv Raman http://orcid.org/0000-0001-5842-0233
from validated questionnaires, we acknowledge that these
have never been piloted in India and so is a weakness of
our study. Data were self-reported and not primary health REFERENCES
or outcome data, the response rate was 50%, so selection 1 Ferguson N, Laydon D, Nedjati-Gilani G. Impact of non-
pharmaceutical interventions (NPIs) to reduce COVID-19 mortality
bias (even despite weighting) might have impacted the and healthcare demand. Imperial College of London.
results and data were not collected prior to the lockdown 2 WHO. World Health Organization novel coronavirus (2019-nCoV)
situation report - 11, 2019. Available: https://www.who.int/
or epidemic so making firm conclusions about its affect is emergencies/diseases/novel-coronavirus-2019/situation-reports
difficult. Future studies are recommended to evaluate the [Accessed 9 Jun 2020].
impact of economic slowdown, unemployment and finan- 3 Remuzzi A, Remuzzi G. COVID-19 and Italy: what next? Lancet
2020;395:1225–8.
cial constraints in each household with time as people’s 4 Mazumder A, Arora M, Bharadiya V, et al. SARS-CoV-2 epidemic in
responses focus on livelihood rather than lives. India: epidemiological features and in silico analysis of the effect of
interventions. F1000Res 2020;9:315.
5 Bhattacharjee A, Kumar M, Patel KK. When COVID-19 will decline in
Author affiliations India? prediction by combination of recovery and case load rate. Clin
1
Shri Bhagwan Mahavir Vitreoretinal Services, Medical Research Foundation, Epidemiol Glob Health 2021;9:17–20.
Sankara Nethralaya, Chennai, India 6 Verma S, Mishra A. Depression, anxiety, and stress and socio-
2
Dr.Mohan’s Diabetes Specialities Centre and Madras Diabetes Research demographic correlates among general Indian public during
COVID-19. Int J Soc Psychiatry 2020;66:756–62.
Foundation, Chennai, India 7 Sivaprasad S, Raman R, Conroy D, et al. The ORNATE India project:
3
Diabetic Retinopathy Project, Sankara Nethralaya, Chennai, India United Kingdom-India research collaboration to tackle visual
4
UCL Institute of Ophthalmology, London, UK impairment due to diabetic retinopathy. Eye 2020;34:1279–86.
5
NIHR Moorfields Biomedical Research Centre, Moorfields Eye Hosp NHS Foundation 8 COVID-19: Lockdown across India, in line with WHO guidance. UN
Trust, London, UK News. 24 Mar 2020.
6 9 Gulliford M, Figueroa-Munoz J, Morgan M, et al. What does ‘access
B005 Meenakshi Classic, Bangalore, India to health care’ mean? J Health Serv Res Policy 2002;7:186–8.
7
Madras Diabetes Research Foundation, Chennai, India 10 Penchansky R, Thomas JW. The concept of access: definition and
8
University of East London, London, UK relationship to consumer satisfaction. Med Care 1981;19:127–40.
11 European Patients Forum. Access to health care, 2016. Available:
https://www.eu-patient.eu/globalassets/policy/access/final-access-
Acknowledgements SMART India study Group Investigators. We also would like to survey-report_16-dec.pdf [Accessed 12 Jun 2020].
thank our reviewers, Mark Siedner and Pragati B Hebbar for providing useful input 12 Webster TR, Mantopoulos J, Jackson E, et al. A brief questionnaire
into strengthening this manuscript. for assessing patient healthcare experiences in low-income settings.
Int J Qual Health Care 2011;23:258–68.
Contributors RRaman, RRaj, SS, DC and GN contributed in literature search, study 13 Freeman GK, Olesen F, Hjortdahl P. Continuity of care: an essential
design, data interpretation. RRaman, RRaj, SS, RRam and DC helped in writing the element of modern general practice? Fam Pract 2003;20:623–7.
manuscript. JS, RRaman, RRaj, RRam, GN helped in data collection. SS, DC and GN 14 Naithani S, Gulliford M, Morgan M. Patients’ perceptions and
contributed in data analysis and making figures. JPT helped in study design, data experiences of ‘continuity of care’ in diabetes. Health Expect
collection. VM contributed in study design, writing. 2006;9:118–29.
15 Topp CW, Østergaard SD, Søndergaard S, et al. The WHO-5
Funding This work was supported by SMART India study, part of the ORNATE India well-being index: a systematic review of the literature. Psychother
project, is funded by the GCRF UKRI (MR/P207881/1). The research is supported by Psychosom 2015;84:167–76.
the NIHR Biomedical Research Centre at Moorfields Eye Hospital NHS Foundation 16 De Jong Gierveld J, Van Tilburg T. A six-item scale for overall,
Trust and UCL Institute of Ophthalmology, London, UK. emotional and social loneliness: confirmative tests on new survey
data. Res Aging 2006;28:582–98.
Competing interests None declared. 17 Weiss RS. Loneliness: the experience of emotional and social
Patient consent for publication Not required. isolation. Cambridge, MA: MIT Press, 1973.
18 Rehman U, Shahnawaz MG, Khan NH, et al. Depression, anxiety and
Ethics approval The Institutional Ethics Committee of Vision Research Foundation, stress among Indians in times of Covid-19 Lockdown. Community
Sankara Nethralaya, Chennai, India approved the study (VRF/674A-2018-P). Ment Health J 2020;7309680 doi:10.1007/s10597-020-00664-x
19 Nelson B. The positive effects of covid-19. BMJ 2020;369:m1785.
Provenance and peer review Not commissioned; externally peer reviewed. 20 Kawachi I. COVID-19 and the ‘rediscovery’ of health inequities. Int J
Data availability statement Data are available on reasonable request. The Epidemiol 2020;49:1415–8.
21 Bambra C, Riordan R, Ford J, et al. The COVID-19 pandemic and
datasets generated during and/or analysed during the current study are not publicly health inequalities. J Epidemiol Community Health 2020;74:964.
available, as it is against the organisation/hospital policy. But are available from the 22 WHO. COVID-19 strategy update. Geneva: World Health
corresponding author on reasonable request. Organization, 2020. https://www.who.int/publications/i/item/covid-
Supplemental material This content has been supplied by the author(s). It has 19-strategy-update-14-april-2020
23 Government of Kerala. Report of the expert committee on strategy
not been vetted by BMJ Publishing Group Limited (BMJ) and may not have been
for easing lockdown restrictions. Thiruvananthapuram, 2020.
peer-reviewed. Any opinions or recommendations discussed are solely those Available: https://www.pslhub.org/learn/coronavirus-COVID-19/
of the author(s) and are not endorsed by BMJ. BMJ disclaims all liability and lockdown-exit-strategies/government-of-kerala-covid-19-report-of-
responsibility arising from any reliance placed on the content. Where the content the-expert-committee-on-strategy-for-easing-lockdown-restrictions-
includes any translated material, BMJ does not warrant the accuracy and reliability 6-april-2020-r2220/
10 Raman R, et al. BMJ Open 2021;11:e043590. doi:10.1136/bmjopen-2020-043590Open access
BMJ Open: first published as 10.1136/bmjopen-2020-043590 on 19 January 2021. Downloaded from http://bmjopen.bmj.com/ on October 19, 2021 by guest. Protected by copyright.
24 Telemedicine Practice Guidelines - Enabling Registered Medical 26 Ghosh A, Arora B, Gupta R, et al. Effects of nationwide lockdown
Practitioners to Provide Healthcare Using Telemedicine. Appendix during COVID-19 epidemic on lifestyle and other medical issues of
5 of the Indian medical council (professional conduct, etiquette and patients with type 2 diabetes in North India. Diabetes Metab Syndr
ethics regulation), 2002. Available: https://www.mohfw.gov.in/pdf/ 2020;14:917–20.
Telemedicine.pdf
27 Anjana RM, Pradeepa R, Deepa M. Acceptability and utilisation
25 Ghosal S, Sinha B, Majumder M. Estimation of effects of
nationwidelockdown for containing coronavirus infection on of technologies and effect of glycemic control in type 2 diabetes-
worsening of glycosylatedhaemoglobin and increase in diabetes- lessons learnt from lockdown. Diabetes TechnolTher 2020.
related complications: a simulationmodel using multivariate 28 Khunti K, Singh AK, Pareek M, et al. Is ethnicity linked to incidence
regression analysis. Diabetes MetabSyndr 2020;14:319–23. or outcomes of COVID-19? BMJ 2020;369:m1548.
Raman R, et al. BMJ Open 2021;11:e043590. doi:10.1136/bmjopen-2020-043590 11You can also read