Gender differences in preventing the spread of coronavirus
←
→
Page content transcription
If your browser does not render page correctly, please read the page content below
finding

Gender differences in
preventing the spread
of coronavirus
Irmak Olcaysoy Okten, Anton Gollwitzer, & Gabriele Oettingen

                                                   abstract         *

                                                   Social distancing, handwashing, and mask wearing are key to preventing
                                                   the spread of COVID-19. However, people vary in the degree to which
                                                   they follow these practices. Previous findings have indicated that women
                                                   adhere more to preventive health practices than men do. We examined
                                                   whether this pattern held true for the COVID-19 pandemic by comparing
                                                   women and men in three studies. In Study 1, women reported a greater
                                                   degree of social distancing and handwashing. In Study 2, conducted
                                                   in three different states in the northeastern United States, a greater
                                                   percentage of women wore masks in public. In Study 3, anonymous
                                                   county-level GPS data collected from approximately 15 million
                                                   smartphones per day between March 9 and May 29, 2020, indicated that
                                                   counties with a greater percentage of women exhibited greater social
                                                   distancing. These data suggest that during pandemics, policymakers may
                                                   benefit from disseminating preventive health messages that are purposely
                                                   tuned to motivate adherence by men.

                                                   Olcaysoy Okten, I., Gollwitzer, A., & Oettingen, G. (2020). Gender differences in
                                                   preventing the spread of coronavirus. Behavioral Science & Policy 6(2), 109–122.
                                                   Retrieved from https://behavioralpolicy.org/journal_issue/covid-19/

a publication of the behavioral science & policy association                                                                   109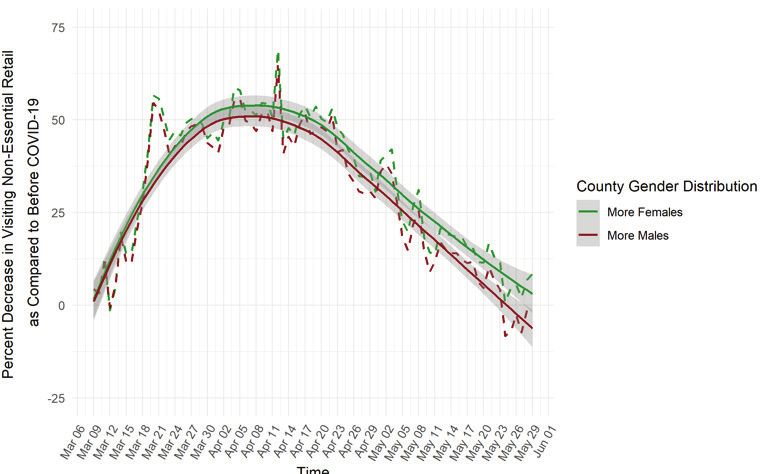
T
             he guidelines for preventing COVID-          with a greater percentage of women than men
             19’s spread are straightforward.1 Medical    exhibited greater social distancing by reducing
             experts have unanimously emphasized          general movement and visits to nonessen-
      the importance of social distancing (avoiding       tial retailers (that is, nonessential stores and
      physical contact with others), personal hygiene     services) between March 9 and May 29, 2020.
      (such as handwashing), and mask wearing.
      Yet individuals and communities vary in their
      adherence to these guidelines. 2–4 Although         Study 1
      some people have carefully followed shelter-
      in-place orders, others have flocked to packed      Method
      beaches or gone on pub crawls. 5,6 The indi-        Participants. We initially recruited 800 partici-
      vidual and group differences that underlie such     pants from the United States via the recruitment
      divergences in compliance should inform poli-       service Prolific. On April 8, 2020, participants
      cymakers’ understanding of how to motivate          completed a five-minute survey that was
      people to engage in preventive measures during      programmed on Qualtrics. We excluded 30
      viral pandemics and whom to target.                 participants for inattention or because their
                                                          gender was nonbinary. Of the remaining 770
      In this article, we examine whether gender          participants, 442 were women. The average
      helps explain variance in individual and group      age was 30.7 years. The distribution of partic-
      responses to COVID-19-related public health         ipant ethnicity was 61.9% White, 7.4% Black or
      guidelines. Specifically, do women adhere to        African American, 13.7% Asian, 9.4% Hispanic,
      the recommendations more than men do? We            5.4% mixed, 0.7% American Indian, 0.1% Native
      hypothesized that women would follow the            Hawaiian, and 1.7% other. See the Supple-
      guidelines more assiduously. For one, they typi-    mental Material for details on the power
      cally engage in preventive health practices more    analysis, participant recruitment, and participant
      in their daily lives: for example, they visit and   characteristics.
      comply with the recommendations of doctors
      and make use of preventive health services          Measures. Five questions assessed preventive
      more than men do.7 Women also pay more              COVID-19 practices. Participants reported the
      attention to their own and others’ health-related   number of days they had had in-person contact
      needs and react more empathetically to others’      with others in the past week (0–7 days), the
      pain.8–14 Moreover, women are more likely to        number of days they had had in-person contact
      avoid risky behaviors and decisions, including      with friends and family in the past week (0–7
      risks related to their health.15,16                 days), their frequency of handwashing, their
                                                          tendency to stay home (other than shopping for
      We conducted three studies to test whether          groceries), and their tendency to maintain six feet
      women are more likely than men to endorse           of distance from others. Participants responded
      and engage in COVID-19 preventive behav-            to the last three items on a scale ranging from
      iors. In Study 1, we examined whether women         1 = Strongly disagree to 7 = Strongly agree. It is
      report greater social distancing and hand-          important to note that self-report items similar
      washing. We also looked into possible factors       to these items are correlated with actual social
      that could motivate reported compliance with        distancing behaviors (as assessed by smart-
      these preventive measures, such as listening        phone step counters and GPS tracking). 17 See
      to medical experts and exhibiting alarm and         the Supplemental Material for a complete list of
      anxiety over health threats posed by COVID-         the questions included in Study 1.
      19. In Study 2, we looked at whether these
      results extend to actual behavior—do a greater      We assessed individuals’ reported reliance on a
      percentage of women wear masks in public?           number of external sources when deciding the
      Finally, in Study 3, we used GPS data of approx-    extent to which they would socially distance:
      imately 15 million people in the United States      medical experts, the president, religious leaders,
      to assess whether people living in counties         their governor, national media, social media,

110                                                 behavioral science & policy | volume 6 issue 2 2020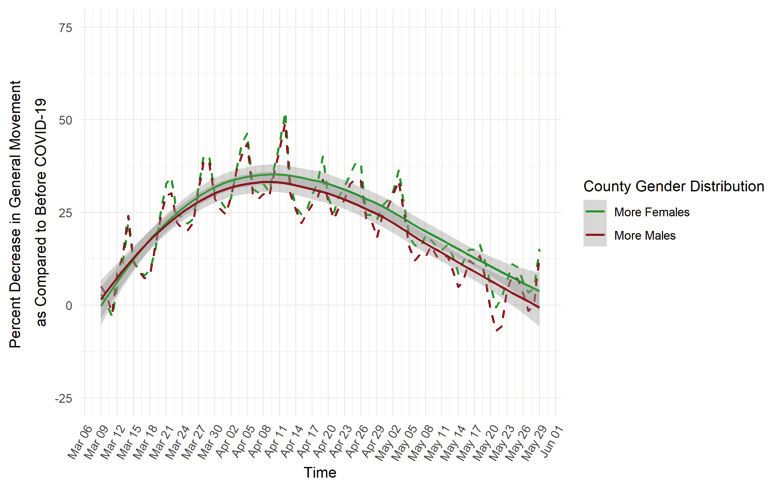
other countries’ experiences, their family, their      including political orientation (1 = Very conser-
friends, and their neighbors. We also assessed         vative, 7 = Very liberal).
participants’ reported reliance on internal
sources: their own health history, anxiety,            Results
feelings of responsibility for themselves, and         Results are shown in Table 1 and, more fully, in
feelings of responsibility for others. Specifically,   Table S1 in the Supplemental Material.
participants were asked, “How are the following
factors influencing to what extent you are             Preventive Practices. Women reported
socially distancing yourself from others?” Partic-     engaging in four of the five measured preventive
ipants answered on a scale ranging from 1 = Not        practices to a greater degree than men—main-
at all to 7 = Very much.                               taining six feet of distance, handwashing, staying
                                                       at home, and having less frequent in-person
Participants reported their anxiety (“Thinking         contact with family and friends. The only item
about Covid-19 makes me feel extremely                 without a gender difference was the frequency
anxious”) on a scale of 1 = Strongly disagree to       of in-person contact with people other than
7 = Strongly agree, preoccupation (“How much           family or friends, although the means were in
preoccupied are you by the current Coronavirus         the predicted direction.
pandemic?”) on a scale of 1 = Not at all to 7 =
Extremely, and uncertainty regarding COVID-19          Sources of Information for Social Distancing.
(“How much uncertainty do you experience in            Women reported relying on information from
your daily life as a result of the current Corona-     data-driven sources (medical experts, their
virus pandemic?”) on a scale of 1 = Not at all to      governor, other countries’ experiences, media)
7 = Extremely.                                         more than men did when deciding to what
                                                       extent they should social distance. Additionally,
To explore whether additional factors might            compared with men, women reported being
have influenced responses to these questions,          more influenced by all four internal sources
we had participants answer several other ques-         (health history, anxiety, feeling responsible for
tions. They reported their daily frequency of          others, feeling responsible for oneself). The
checking COVID-19 news in an open-ended                tendency to listen to data-driven sources and
question. They also reported how knowledge-            the tendency to consult internal sources both
able they felt about the disease on a scale of         positively correlated with preventive health
1 = Not at all knowledgeable to 7 = Extremely          practices, suggesting that women were more
knowledgeable. They reported whether they              likely to listen to sources that motivate compli-
belonged to a vulnerable population for                ance with preventive COVID-19 health practices.
contracting COVID-19 (such as due to health,           Women and men, however, were about equally
age, profession, or other reasons), whether            likely to turn to less data-oriented external
they knew anyone who contracted the disease,           sources, such as the president, religious leaders,
the likelihood of their contracting COVID-19 in        and familiar others. The reported influence of
the future (1 = Not at all likely, 7 = Very likely),   these sources showed either weak correlations
how important not contracting the disease              (in both directions) or no significant correla-
was to them (1 = Not at all important, 7 = Very        tions with preventive health practices. See Table
important), and how much their daily routines          S2 in the Supplemental Material for specific
changed during the pandemic (1 = Not at all, 7 =       correlations.
Extremely). All these questions were presented
in random order. We also assessed whether              Psychological Experience. Women reported
participants’ answers were skewed by a desire          experiencing negative emotions (anxiety, preoc-
to respond in a socially acceptable or desirable       cupation, uncertainty) in response to COVID-19
way. 18 Finally, we asked participants to report       to a greater degree than men did.
their number of on-site workdays in the past
week, as well as demographic characteristics,          Other Factors. Most of the other factors we
                                                       examined did not influence the observed

a publication of the behavioral science & policy association                                                111
Table 1. Study 1 results: Gender differences in self-reported measures
                                                                             Women                Men
                                                                            (n = 442)          (n = 328)                         95% CI
                                                                                                                           Lower        Upper      Cohen’s
                               Variable                                       M (SD)            M (SD)            p        bound        bound        d
 Preventive practices
   In-person contact with family or friends (days per week)                 4.18 (2.97)       4.72 (2.86)        .011        0.12         0.96        0.19
   In-person contact with others (days per week)                            1.61 (2.07)       1.81 (2.08)        .191       −0.10         0.49        0.09
   Handwashing                                                              6.37 (1.07)       6.17 (1.25)        .020       −0.36       −0.03       −0.17
   Staying at home (other than shopping)                                    5.83 (1.65)       5.51 (1.83)        .013       −0.57       −0.07       −0.19
   Attention to maintaining six-foot distance                               6.29 (1.14)       6.03 (1.20)        .003       −0.42       −0.09       −0.22

 Source of information for social distancing
   External
        The president                                                       2.87 (2.09)       2.91 (1.93)        .775       −0.24         0.33        0.02
        Religious leaders                                                   2.03 (1.73)       1.98 (1.65)        .714       −0.29         0.20      −0.03
        Your governor                                                       5.03 (1.95)       4.48 (1.87)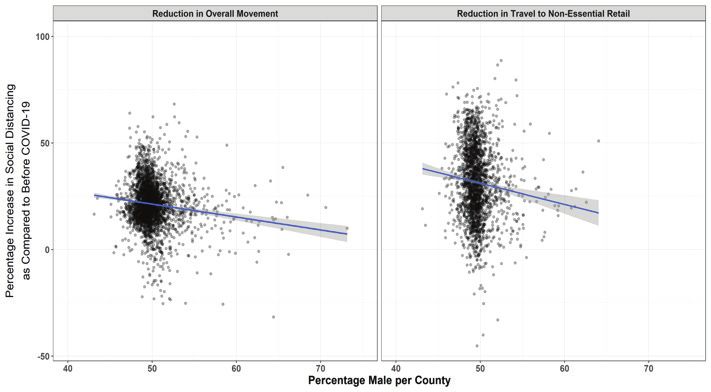
gender differences in preventive actions,            variables, such as income, the race and ethnicity
sources of information, or emotional response        of inhabitants, the median age of the inhab-
(see the Supplemental Material for details). Men     itants, and the average number of people per
in our sample were, however, more conservative       household. (See the Supplemental Material for
than women, t(767)= 4.44, p < .001 (see note A       details.) The percentages of male and female
for a discussion of the statistical notations used   inhabitants were similar across the three loca-
in this article). When we controlled for political   tions, however. All three observation locations
conservatism, the effect size of many of the         had main streets with paved sidewalks that are
observed findings decreased by between 43%           convenient for walking.
and 6%, although the results remained signifi-
cant in most cases. These results suggest that       Participants. Before beginning the study, we
some latent factor underlying male gender            made an observation plan and preregistered
and conservatism may have influenced our             it, as described in the Supplemental Mate-
results. In the future, researchers should test      rial. Specifically, we determined that each
whether psychological constructs related to          of us would observe 100 pedestrians in our
both maleness and conservatism—for instance,         assigned zip code region. Observations were
a greater sense of power, more assertiveness,        made over two hours on May 4 in New York
or greater feelings of autonomy and indepen-         and Connecticut and over approximately eight
dence10,17,19,20—help explain the observed gender    hours across May 4 and May 5 in New Jersey
differences.                                         (because of low pedestrian traffic). We observed
                                                     127 women and 173 men in total.

Study 2                                              Procedure. Because we were self-quarantining
Although Study 1 revealed gender differences,        in our respective homes in the three locations,
it remains possible that the reported behav-         we selected one street, or several blocks close
iors do not reflect actual behavior. To address      by to observe pedestrians. We assessed and
this concern, in Study 2, we used observa-           tallied the gender of each observed individual
tional methodologies to test whether women           (including individuals on bikes but not those
are more likely than men to wear face cover-         in cars) and noted whether the individual was
ings in public during the COVID-19 pandemic.         wearing a mask. A person was deemed to be
Observational methods are thought to be more         wearing a mask if his or her chin, mouth, and
valid for reflecting real-world behavior than are    nose were covered (whether with cloth or with
methods that merely rely on self-reports. 21–24      an actual mask). An individual who had a mask
Differences found in the field are also more         around his or her neck or in his or her hands was
convincing because they show up in spite of          counted as not wearing a mask.
other contextual influences (that is, in spite of
noise or error variance in the data). 25 Based on    Results
the results of Study 1 and on previous work          The results are shown in Figure 1 (for details,
on gender differences in preventive health           see Table S3 in the Supplemental Material). A
behavior, we predicted that women would be           chi-square analysis revealed a significant asso-
more likely than men to wear masks in public.        ciation between gender and mask wearing, with
                                                     women being more likely than men to wear
Method                                               masks, as compared with chance, p = .003.
Observation Locations & Participants. We             Follow-up analyses showed that a significantly
conducted our observations in three U.S. loca-       higher percentage of women wore a mask
tions, identified by zip code: 10012 in New York     (55.1%) than did not wear a mask (44.9%), p <
City; 06511 in New Haven, Connecticut; and           .05. In contrast, the proportion of men who
08901 in New Brunswick, New Jersey. Although         wore a mask (37.6%) was significantly lower than
these locations are all in the northeastern United   the proportion of those who did not (62.4%), p
States, they differ on a variety of demographic      < .05. Although we did not make a prediction

a publication of the behavioral science & policy association                                             113
Figure 1. Study 2 results: Percentage of mask wearing in smartphone GPS location coordinates), we
men versus women examined whether the gender makeup of
approximately 3,000 U.S. counties predicts the
60% extent to which people in those counties prac-
ticed social distancing early in the COVID-19
50% pandemic, between March 9 and May 29, 2020.
Social distancing was measured via (a) overall
% Mask Wearing
40% reduction in movement and (b) reduction in
visits to nonessential retailers (encompassing
30% stores and services) as compared with move-
ment and visits before the pandemic started in
20% the United States (that is, before March 9). See
the Supplemental Material for a fuller definition
10% of nonessential retailer.
0% Method
Men Women
Participants. The aggregated movement data
of approximately 15 million people across the
about a gender difference in the number of United States per day between March 9 and
people in public, we observed more men (57.7%) May 29, 2020 were shared by Unacast (a soft-
than women (42.3%) on the street, p = .008, ware company that provides location and map
despite the fact that the overall gender distri- services). 26 These data are anonymized in that
bution of the examined zip code locations was they aggregate GPS coordinates by county. The
largely evenly split. This result aligns with the data set included information from 3,054 coun-
finding of Study 1 that women reported a higher ties. Twenty-nine counties with 2,000 or fewer
tendency to stay at home during the pandemic. inhabitants were removed from this number
for the analyses. We excluded 952 additional
counties from the analyses involving visits to
Study 3 nonessential retailers because of missing data.
Consistent with the self-reported gender differ-
ences observed in Study 1, measures of an Measures
observed behavior—mask wearing—in Study Social Distancing. As noted earlier, social
2 indicated that women are more likely than distancing was assessed in two ways: by
men to engage in COVID-19 preventive prac- decreases in overall movement and decreases in
tices. However, the samples of Studies 1 and visits to nonessential retailers (as compared with
2 were not completely representative of the pre-COVID-19 movement and visits, individually
U.S. population. For instance, the sample in controlled for in each county). For more details,
Study 1 differed from the general population in see Study 3 in the Supplemental Material.
being younger by about 10 years, being more
educated, and having a higher proportion of County Gender Percentages. Counties’ gender
Asians and lower proportions of Black and breakdowns were provided by https://github.
Hispanic individuals (see note B). Additionally, com/JieYingWu/COVID-19_US_County-level_
the sample in Study 2 was limited to people Summaries.
seen in three specific U.S. locations. Therefore,
in Study 3, we tested whether our results extend Additional Considerations. Descriptions of
to social distancing behavior at the U.S. county covariates (variables we controlled for in addi-
level. tional analyses) and of the coding of these
variables can be found in Table S4 in the Supple-
Using the aggregated geotracking data of mental Material. The variables are also listed in
approximately 15 million people around the the Results section below.
United States per day (tracked via individuals’
114 behavioral science & policy | volume 6 issue 2 2020Results males + total # of females]*100; M = 50.07%, SD We examined whether the percentage of men = 2.26%, minimum value = 43.13%, maximum versus women in a county predicted an indi- value = 73.16%), we found, as shown in Figure 2, vidual county’s degree of social distancing that counties with a higher proportion of males between March 9 and May 29, 2020. We took (by 2 standard deviations above the mean) into account that social distancing policies were reduced general movement 4.02 percentage instituted around mid-March and loosened points less and reduced their visits to nones- toward the middle and end of April; thus, social sential retailers 9.08 percentage points less than distancing increased and then decreased over did counties with an average gender distribution time. For more details on how we conducted (See note C for statistical details. Also see the all the data analyses discussed in this Results base model statistics in Tables S6 and S7 of the section, see the Supplemental Material. Supplemental Material.) Not surprisingly, social distancing—in terms of We further examined how the link between both reduced general movement and reduced gender distribution and social distancing visits to nonessential retailers—was higher in changed over time during the study period. places with higher per capita rates of infection, Then, to examine the robustness of this relation, on the weekends, in high-income counties we reran the test while controlling for several (where people are more likely to be able to work potential covariates. These variables included from home), and when stay-at-home policies COVID-19 cases per capita (cumulative cases were in place (see Figure S2 in the Supplemental divided by county population, measured for Material). Regarding counties’ gender distribu- each specific day in the included date range), tion (calculated as [total # of males]/[total # of state policy (whether a stay-at-home order was Figure 2. Study 3 results: Increase in social distancing (March 9, 2020–May 29, 2020) at the county level as a function of the percentage of male raw scores Note. Social distancing was assessed by degree of overall movement and visits to nonessential retailers (stores and services) in the United States as measured by anonymous GPS data from more than 3,000 counties. Counties with a higher percentage of men had lower levels of social distancing. a publication of the behavioral science & policy association 115
in effect in a specific state on a specific day), and females increased over time. These find-
whether a day fell on a weekend or weekday, ings were observed while including the control
median income, median age, population density variables noted earlier (such as COVID-19 cases
(in terms of population per square mile of land per capita and median income). The interac-
area), religiosity (rate of religious adherents tion between gender and time can be seen in
per 1,000 people), percentage of employed the highlighted rows in the main model and
residents, economic inequality, percentage of saturated model in Tables S6 and S7 in the
adults who only have a high school diploma, Supplemental Material.
percentage of adults with a college degree, and
percentage of adults who have at least a bach- In theory, factors other than those already
elor’s degree. (See Table S4 in the Supplemental considered could have confounded the results.
Material for descriptions of and sources for the For instance, the findings could have conceiv-
variables.) ably been driven by men and women holding
jobs that differ as to whether they are consid-
We found that counties with a higher percentage ered essential during the pandemic. Adding in
of males showed comparatively less and less counties’ percentages of employment in various
social distancing as the COVID-19 pandemic types of professions to our test, however, did
progressed between March 9 and May 29, 2020, not account for our findings. As is shown in
as measured both by movement (see Figure Table S8 in the Supplemental Material, the
3) and by visits to nonessential retailers (see results were unchanged when we controlled
Figure 4). See note D for the statistical details. for counties’ percentage of workers in a long list
In other words, the difference between males of job areas—among them, agriculture, mining,
Figure 3. Study 3 results: U.S. counties’ average social distancing
(percentage reduction in general movement) as a function of time
& counties’ gender distribution
Percentage Decrease in General Movement
as Compared to Before COVID-19
Note. This figure compares movement in counties with more males to movement in counties with more females (split in terms
of above the median of counties’ gender distribution versus below the median of counties’ gender distribution for the purposes
of the figure). Dashed lines depict the daily average across counties. Solid lines depict these same data after smoothing (that is,
after removal of random variation and plotting of the overall trend). Estimates were composed from raw scores. The analysis
controlled for prepandemic social distancing (that is, distancing before March 9, 2020).
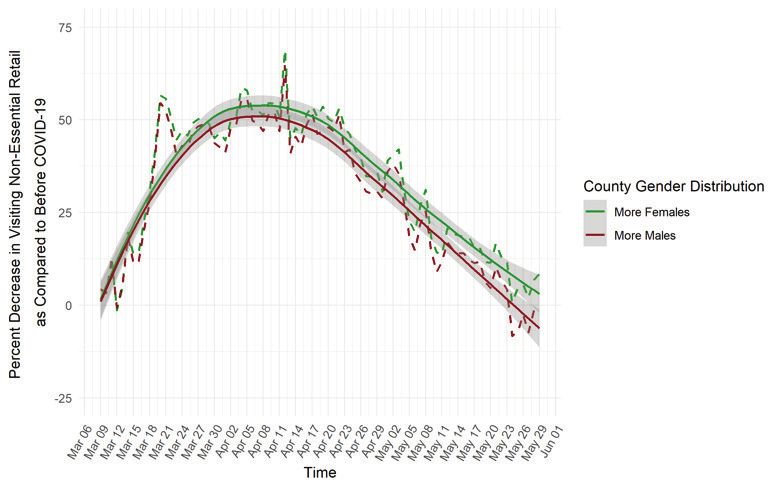
116 behavioral science & policy | volume 6 issue 2 2020Figure 4. Study 3 results: U.S. counties’ average social distancing
(percentage reduction in visits to nonessential retailers) as a function
of time & counties’ gender makeup
Percentage Decrease in Visiting Non-Essential Retail
as Compared to Before COVID-19
Note. This figure compares visits to nonessential retailers in counties with more males to visits in counties with more females
(split in terms of above the median of counties’ gender distribution versus below the median of counties’ gender distribution
for the purposes of the figure). Dashed lines depict the daily average across counties. Solid lines depict these same data after
smoothing (after removal of random variation and plotting of the overall trend). Estimates were composed from raw scores.
The analysis controlled for prepandemic social distancing (that is, distancing before March 9, 2020).
utilities, construction, manufacturing, wholesale single people. Overall, household type did not
trade, retail trade, health care and social assis- consistently moderate the influence of gender
tance, and accommodation and food services on social distancing across the study period, as
(ps < .001). is illustrated in Tables S11 and S12 and Figures
S4–S7 in the Supplemental Material.
We also explored the effect of political orien-
tation. The effect of gender distribution on
reduced physical distancing over time did not Discussion
substantially decrease when we accounted In three studies, we observed gender differences
for counties’ percentage of votes for Donald in preventive practices meant to limit the spread
Trump over Hillary Clinton in 2016 (except in of COVID-19. In Study 1, we found that women
one specific analysis, in which the effect was are more likely than men to report engaging in
reduced but remained significant). See Tables S9 social distancing and handwashing, as well as to
and S10 in the Supplemental Material for details. listen to data-driven and internal sources (such
as medical experts and feelings of responsibility
The findings in Study 3 could potentially have to themselves and others) when making social
been driven by gender differences in behavior distancing decisions.
within households during the pandemic (such as
men doing more of the grocery shopping than Because of the potential limitations of self-
women were). To test this possibility, we exam- report survey measures (gender differences may
ined counties’ total number of families versus occur more in reporting than in actual behavior),
a publication of the behavioral science & policy association 117we used behavioral methodologies in two other Limitations
studies to investigate the links between gender Our studies had several limitations. First, the
and preventive behavior. Specifically, Study observed gender differences in social distancing
2 extended the findings of Study 1 to actual might be explained by structural factors (such as
preventive behavior in the form of wearing employment conditions or family composition)
masks in public. We observed that a greater rather than by individuals’ personal motivation
percentage of women than men wore masks in to maintain preventive health practices. In Study
public in three different locations of the north- 1, we accounted for one such factor by demon-
eastern United States (New Haven, Connecticut; strating that the number of on-site workdays
New York, New York; and New Brunswick, New at the time of the study did not account for or
Jersey). contribute to the observed gender differences.
And, in Study 3, potentially gendered behavior in
Study 3 extended these results to the group families (such as shopping and childcare) did not
level. We examined whether the gender distri- appear to account for the observed results: the
bution of U.S. counties predicted the degree of number of single versus family households in a
social distancing behavior in these counties as county did not moderate our findings. Finally,
assessed by the movements of approximately controlling for factors related to socioeconomic
15 million GPS smartphone coordinates per status (SES)—that is, annual income, economic
day across the United States between March 9 inequality, education, employment, and type
(close to the start of the pandemic in the United of profession—at the county level in Study 3
States) and May 29, 2020. Our analyses revealed did not change our results. Nevertheless, all
that U.S. counties with more male constituents these county-level factors were analyzed on
exhibited less social distancing, as measured the basis of prepandemic data (that is, these
by general movements and visits to nones- data did not take into account the shifts in SES
sential retailers, and this pattern became more that resulted from the pandemic) and there-
pronounced as the pandemic progressed. fore should be interpreted with caution. Future
research should investigate the role of behaviors
Exploratory analyses in Study 1 suggested that within households and other structural factors
political ideology might be one factor underlying that could influence how gender contributed to
the reported gender differences in preventive social distancing decisions and practices as the
health measures. Consistent with this sugges- COVID-19 pandemic was unfolding.
tion, other research has recently documented
that political conservatives, as compared with Second, the behavioral observations in Study 2
more politically liberal respondents, engage in were restricted to the three locations where we
less social distancing, feel more in control over were located while stay-at-home orders were in
their own COVID-19 preventive actions, and feel place. Although these locations vary in annual
less responsible for the prevention of the spread household income, household composition,
of the virus. 27–29 Although political ideology only age, and ethnicity, one should be cautious in
partly accounted for the gender differences generalizing these findings to the entire U.S.
observed in Study 1 (at the individual level) and population. Also, all three locations were in
did not account for the link between coun- “blue” counties and states that voted for Clinton
ties’ gender distribution and social distancing over Trump in the 2016 election. Although Study
in Study 3 (at the group level), future research 3, in which we examined millions of data points
could involve a systematic investigation of the from across the entire United States (including
exact role that ideology and other ideology- conservative counties), largely remedies these
relevant constructs (such as masculinity and concerns, future research should nonetheless
endorsement of traditional gender roles) may test whether the observed gender differences
play in people’s adherence to public health in mask wearing extend to other locations and
recommendations for limiting the spread of demographics.
COVID-19.
118 behavioral science & policy | volume 6 issue 2 2020Third, in Study 3, although the link between frequently get together can be an effective
counties’ gender distribution and social strategy.32,33
distancing was robust to a number of covariates,
this link was not very strong. That is, including Alternatively, interventions that target percep-
further covariates in the analyses would likely tions of masculinity by inviting men to critically
at some point eliminate the observed effects reflect on the social norms of manhood may
of counties’ gender distribution on social make them aware of the obstacles that might
distancing. We note, though, that this would not stand in the way of their taking preventive
be particularly surprising, because the added actions during COVID-19.34 Research has shown
variables would probably pick up on the psycho- that educational sessions that are led by male
logical influences that underlie the reasons why role models and allow young men to discuss
maleness is linked to reduced social distancing masculinity norms have been effective in
in the first place (such as the tendency to react improving other preventive health behaviors. 35
to perceived threats to one’s masculinity and a Similar strategies could be applied in the service
propensity for risk-taking). of COVID-19 prevention, perhaps through inter-
active online platforms.
Finally, the present studies do not eliminate the
potential role of biological factors in gender A self-regulation strategy called WOOP (wish,
differences in the severity of COVID-19 cases outcome, obstacle, plan) may also be helpful, as
and mortality, such as the greater prevalence it has been shown to facilitate behavior changes
of hypertension, cardiovascular diseases, and in various domains, including the health
other relevant health problems among men domain. 36,37 WOOP includes four simple steps:
than women. That is, our findings are more (a) identifying a wish, (b) identifying and imag-
relevant to understanding gender differences in ining the best outcome of attaining this wish, (c)
the potential spread of COVID-19 (due to differ- identifying and imagining the internal obstacle
ences in engaging in preventive health practices) (such as an emotion, an irrational belief, or a
than to understanding gender differences in the bad habit) that stands in the way of fulfilling
severity of the cases and mortality rates. the identified wish, and (d) forming an if-then
plan to overcome the identified obstacle (“if my
obstacle occurs, then I will act in a way that will
Policy Implications overcome this obstacle”). In the current context,
Collectively, our results suggest that failing to people could be asked to identify a wish related
engage in preventive practices may be putting to reducing the spread of COVID-19, the best
men at higher risk of catching and spreading outcome of fulfilling this wish (such as “My
COVID-19. As such, alerting men in particular family will remain healthy”), and the internal
to the protective power of social distancing, obstacle that stands in their way (such as “I may
handwashing, and mask wearing may be helpful look like a coward if I wear a mask”). Finally, they
in reducing the spread of the virus. To fine- can form a specific if-then plan to overcome
tune preventive health policies so that they do their inner obstacle and engage in preven-
a better job of influencing men, policymakers tive health behaviors (as in, “If I think I will look
might target men’s illusions of invulnerability like a coward, then I will remember my family
(which are supported by traditional views of and wear a mask”). In light of the finding that
masculinity)20,30 and remind them of their hospitalization and fatality rates from COVID-19
responsibilities to others and themselves during have so far been higher among men,38–40 inter-
this critical period. 8,31 Disseminating preven- ventions focused on men may be particularly
tion messages particularly in places where men effective at attenuating the number of people
who fall ill and die from the disease.
a publication of the behavioral science & policy association 119end notes reduced their visits to nonessential retailers 9.08
percentage points less than did people in counties
A. Editors’ note to nonscientists: For any given data
having an average gender distribution. The statis-
set, the statistical test used—such as the chi-square
tical results were as follows: Bmovement = −2.01, 95%
(χ2), the t test, or the F test—depends on the
CI [−2.79, −1.21], p < .001, and Bvisitation = −4.54, 95%
number of data points and the kinds of variables
CI [−5.89, −3.18], p < .001. B values here indicate
being considered, such as proportions or means.
the change in the predicted variable (reduction in
The p value of a statistical test is the probability of
general movement or reduction in visits to nones-
obtaining a result equal to or more extreme than
sential retailers) as a function of a unit change in
would be observed merely by chance, assuming
the predicting variable. One unit change in the
that there are no true differences between the
predicting variable in these statistical models
groups under study (this assumption is referred to
captures a change of 2.26 (1 standard deviation)
as the null hypothesis). Researchers traditionally
because gender distribution was z scored in the
view p < .05 as the cutoff for statistical significance,
models. So, for instance, for general movement,
with lower values indicating a stronger basis for
the B coefficient can be interpreted as follows:
rejecting the null hypothesis. Statistical tests such
A change of 2.26 percentage points in gender
as the F test and t test are parametric: they make
distribution (for example, 50.00% male versus
some assumptions about the characteristics of
52.26% male) is linked to a 2.01 percentage point
a population, such as that the compared groups
decrease in social distancing (see the negative B
have an equal variance on a compared factor.
value of −2.01 for general movement). In other
In cases where these assumptions are violated,
words, counties with a greater male percentage
researchers make adjustments in their calcula-
(by 2.26 percentage points) were significantly less
tions to take into account dissimilar variances
likely to reduce general movement (that is, 2.01
across groups. A 95% confidence interval (CI) for
percentage points less).
a given metric indicates that in 95% of random
samples from a given population, the measured D. In Study 3, we found that counties with a higher
value will fall within the stated interval. Standard percentage of males showed comparatively
deviation (SD) is a measure of the amount of vari- less and less social distancing as the COVID-19
ation in a set of values. Approximately two-thirds pandemic progressed (between March 9 and May
of the observations fall between one standard 29, 2020), as measured both by movement and
deviation below the mean and one standard devi- by visits to nonessential retailers. The statistical
ation above the mean. In addition to the chance results were as follows: B movement = −0.42, 95% CI
question, researchers consider the size of the [−0.47, −0.38], p < .001, and Bvisitation = −0.35, 95%
observed effects, using such measures as Cohen’s CI [−0.46, −0.25], p < .001.
d or Cohen’s h. Cohen’s d or h values of 0.2, 0.5,
and 0.8 typically indicate small, medium, and large
effect sizes, respectively.
author affiliation
B. The percentage of White individuals in our sample
in Study 1 matched the proportion in the U.S. Olcaysoy Okten: New York University. Goll-
population (which, in 2018, was 60.4%).41 However, witzer: Yale University. Oettingen: New York
compared with the U.S. population, our sample University. Corresponding author’s e-mail:
was younger (Mdn = 38.2 years),41 and included a
irmakolcaysoy@gmail.com.
higher proportion of Asian individuals (U.S. popu-
lation in 2018: 5.9%) and lower proportions of
Black (U.S. population in 2018: 13.4%) and Hispanic
supplemental material
individuals (U.S. population in 2018: 18.3%). • https://behavioralpolicy.org/publication
C. In Study 3, we found that people in counties with • Methods & Analyses
a higher proportion of males reduced general
movement 4.02 percentage points less and
120 behavioral science & policy | volume 6 issue 2 2020references
1. Centers for Disease Control and 12. Cheng, Y., Decety, J., Lin, C. P., Hsieh, of the Society of Personality and Social
Prevention. (2020, April 11). How to J. C., Hung, D., & Lee, P. L. (2007). Sex Psychology, Portland, OR, United States.
protect yourself & others. https:// differences in the spinal excitability 24. Talhelm, T., Zhang, X., & Oishi, S. (2018,
www.cdc.gov/coronavirus/2019-ncov/ during observation of bipedal April 25). Moving chairs in Starbucks:
prevent-getting-sick/prevention.html locomotion. Neuroreport, 18, 887–890. Observational studies find rice-wheat
2. Tabri, N., Hollingshead, S. J., & Wohl, 13. Marzoli, D., Palumbo, R., Domenico, cultural differences in daily life in
M. J. A. (2020, March 31). Framing A. D., Penolazzi, B., Garganese, P., China. Science Advances, 4(4), Article
COVID-19 as an existential threat & Tommasi, L. (2011). The relation eaap8469. https://doi.org/10.1126/
predicts anxious arousal and prejudice between self-reported empathy and sciadv.aap8469
towards Chinese people. PsyArXiv. motor identification with imagined 25. Cialdini, R. (2019, February). Which
https://doi.org/10.31234/osf.io/mpbtr agents. PLOS ONE, 6, Article e14595. behavior speaks loudest? [Paper
https://doi.org/10.1371/journal.
3. Aleem, Z. (2020, March 15). A new poll presentation]. Annual meeting of
pone.0014595
shows a startling partisan divide on the the Society of Personality and Social
dangers of the coronavirus. https:// 14. Hoffman, M. L. (1977). Sex differences Psychology, Portland, OR, United States.
www.vox.com/2020/3/15/21180506/ in empathy and related behaviors. 26. Unacast. (2020). Social distancing
coronavirus-poll-democrats- Psychological Bulletin, 84, 712–722. scoreboard. https://www.unacast.com/
republicans-trump 15. Byrnes, J. P., Miller, D. C., & Schafer, covid19/social-distancing-scoreboard
4. Bruce, G., Nguyen, H., Ballard, J., W. D. (1999). Gender differences in risk 27. Everett, J. A. C., Colombatto, C., Chituc,
& Sanders, L. (2020, March 27). taking: A meta-analysis. Psychological V., Brady, W. J., & Crockett, M. (2020,
COVID-19 report: How the virus is Bulletin, 125, 367–383. March 20). The effectiveness of moral
affecting everything, from politics 16. Liang, W., Shediac-Rizkallah, M. C., messages on public health behavioral
to brands. YouGov. https://today. Celentano, D. D., & Rohde, C. (1999). intentions during the COVID-19
yougov.com/topics/science/ A population-based study of age and pandemic. PsyArXiv. https://doi.
articles-reports/2020/03/12/ gender differences in patterns of health- org/10.31234/osf.io/9yqs8
covid-19-report-how-virus-affecting- related behaviors. American Journal of
world-politics 28. Rothgerber, H., Wilson, T., Whaley,
Preventive Medicine, 17, 8–17. D., Rosenfeld, D. L., Humphrey, M.,
5. Dusenbury, W. (2020, March 16). 17. Gollwitzer, A., Martel, C., Marshall, J., Moore, A. L., & Bihl, A. (2020, April 22).
Some of Florida’s top beaches closed Höhs, J., & Bargh, J. A. (2020, June Politicizing the COVID-19 pandemic:
to prevent coronavirus, but not 4). Connecting self-reported social Ideological differences in adherence to
everybody got the message. Sun distancing to real-world behavior at the social distancing. PsyArXiv. https://doi.
Sentinel. https://www.sun-sentinel. individual and U.S. state level. PsyArXiv. org/10.31234/osf.io/k23cv
com/coronavirus/fl-ne-clearwater- https://doi.org/10.31234/osf.io/kvnwp
beach-coronavirus-20200316- 29. Gollwitzer, A., Martel, C., Brady, W. J.,
pag4de6onnauffkaykbfz6l654-story. 18. Reynolds, W. M. (1982). Development Pärnamets, P., Freedman, I., Knowles,
html of reliable and valid short forms of the E., & Van Bavel, J. J. (2020, May
Marlowe-Crowne Social Desirability 24). Partisan differences in physical
6. Rahman, K. (2020, March 15). St. Scale. Journal of Clinical Psychology, distancing predict infections and
Patrick’s Day revelers in Chicago and 38, 119–125. mortality during the coronavirus
Louisiana flout coronavirus warnings pandemic. PsyArXiv. https://doi.
to stay at home. Newsweek. https:// 19. Kray, L. J., Howland, L., Russell, A. G.,
org/10.31234/osf.io/t3yxa
www.newsweek.com/st-patricks-flout- & Jackman, L. M. (2017). The effects
coronavirus-warnings-fill-bars-1492376 of implicit gender role theories on 30. Mahalik, J. R., Burns, S. M., & Syzdek,
gender system justification: Fixed beliefs M. (2007). Masculinity and perceived
7. Waldron, I., & Johnston, S. (1976). strengthen masculinity to preserve the normative health behaviors as
Why do women live longer than men? status quo. Journal of Personality and predictors of men’s health behaviors.
Journal of Human Stress, 2(2), 19–30. Social Psychology, 112, 98–115. Social Science & Medicine, 64,
8. Umberson, D. (1992). Gender, marital 2201–2209.
20. Courtenay, W. H. (2000). Constructions
status and the social control of health of masculinity and their influence on 31. White, R. (2002). Social and political
behavior. Social Science & Medicine, 34, men’s well-being: A theory of gender aspects of men’s health. Health, 6,
907–917. and health. Social Science & Medicine, 267–285.
9. Gilligan, C. (1982). In a different voice: 50, 1385–1401. 32. Robertson, S., Zwolinsky, S., Pringle,
Psychological theory and women’s 21. Oettingen, G., & Seligman, M. E. (1990). A., McKenna, J., Daly-Smith, A., &
development. Harvard University Press. Pessimism and behavioural signs of White, A. (2013). “It is fun, fitness and
10. Gilligan, C., & Wiggins, G. (1988). The depression in East versus West Berlin. football really”: A process evaluation
origins of morality in early childhood European Journal of Social Psychology, of a football-based health intervention
relationships. In C. Gilligan, J. V. Ward, 20, 207–220. for men. Qualitative Research in Sport,
& J. M. Taylor (Eds.), Mapping the Exercise and Health, 5, 419–439.
22. Saarni, C. (1984). An observational
moral domain (pp. 111–138). Harvard study of children’s attempts to monitor 33. Aoun, S., Donovan, R. J., Johnson, L.,
University Press. their expressive behavior. Child & Egger, G. (2002). Preventive care in
11. Karniol, R., Grosz, E., & Schorr, I. (2003). Development, 55, 1504–1513. the context of men’s health. Journal of
Caring, gender role orientation, and Health Psychology, 7, 243–252.
23. Skitka, L. (2019, February). Presidential
volunteering. Sex Roles, 49(1–2), 11–19. plenary: Behavior is worth 1,000 words.
[Paper presentation]. Annual meeting
a publication of the behavioral science & policy association 12134. Fleming, P. J., Lee, J. G., & Dworkin,
S. L. (2014). “Real men don’t”:
Constructions of masculinity and
inadvertent harm in public health
interventions. American Journal of
Public Health, 104, 1029–1035.
35. Pulerwitz, J., Michaelis, A., Verma,
R., & Weiss, E. (2010). Addressing
gender dynamics and engaging men
in HIV programs: Lessons learned
from Horizons research. Public Health
Reports, 125, 282–292.
36. Oettingen, G. (n.d.). The science behind
WOOP. WOOP. https://woopmylife.org/
en/home
37. Wittleder, S., Kappes, A., Oettingen, G.,
Gollwitzer, P. M., Jay, M., & Morgenstern,
J. (2019). Mental contrasting with
implementation intentions reduces
drinking when drinking is hazardous:
An online self-regulation intervention.
Health Education & Behavior, 46,
666–676.
38. Grasselli, G., Zangrillo, A., Zanella, A.,
Antonelli, M., Cabrini, L., Castelli, A.,
Cereda, D., Coluccello, A., Foti, G.,
Fumagalli, R., Iotti, G., Latronico, N.,
Lorini, L., Merler, S., Natalini, G., Piatti,
A., Ranieri, M. V., Scandroglio, A. M.,
Storti, E., . . . Pesenti, A. (2020). Baseline
characteristics and outcomes of 1591
patients infected with SARS-CoV-2
admitted to ICUs of the Lombardy
region, Italy. JAMA, 323, 1574–1581.
https://doi.org/10.1001/jama.2020.5394
39. Garg, S., Kim, L., Whitaker, M.,
O’Halloran, A., Cummings, C., Holstein,
R., Prill, M., Chai, S. J., Kirley, P. D., Alden,
N. B., Kawasaki, B., Yousey-Hindes, K.,
Niccolai, L., Anderson, E. J., Openo, K.
P., Weigel, A., Monroe, M. L., Ryan, P.,
Henderson, J., . . . Fry, A. (2020, April 17).
Hospitalization rates and characteristics
of patients hospitalized with laboratory-
confirmed coronavirus disease
2019—COVID-NET, 14 states, March
1–30, 2020. Morbidity and Mortality
Weekly Report, 69, 458–464. https://
www.cdc.gov/mmwr/volumes/69/wr/
pdfs/mm6915e3-H.pdf
40. Novel Coronavirus Pneumonia
Emergency Response Epidemiology
Team. (2020). The epidemiological
characteristics of an outbreak of 2019
novel coronavirus diseases (COVID-
19)—China 2020. China CDC Weekly,
2(8), 113–122. https://doi.org/10.46234/
ccdcw2020.032
41. United States Census Bureau. (2019,
June 20). 2018 population estimates
by age, sex, race and Hispanic origin
[Press release]. https://www.census.gov/
newsroom/press-kits/2019/detailed-
estimates.html
122 behavioral science & policy | volume 6 issue 2 2020You can also read