Social Networks Use Patterns among University Youth: The Validity and Reliability of an Updated Measurement Instrument - MDPI
←
→
Page content transcription
If your browser does not render page correctly, please read the page content below
sustainability

Article
Social Networks Use Patterns among University
Youth: The Validity and Reliability of an Updated
Measurement Instrument
Melchor Gómez-García 1, *, Luis Matosas-López 2            and Julio Ruiz-Palmero 3
 1    Department of Pedagogy, Autonomous University of Madrid, 28049 Madrid, Spain
 2    Department of Financial Economics, Accounting and Modern Language, Rey Juan Carlos University,
      28032 Madrid, Spain; luis.matosas@urjc.es
 3    Department of Didactics and School Organization, University of Málaga, 29071 Málaga, Spain; julio@uma.es
 *    Correspondence: melchor.gomez@uam.es; Tel.: +0034-676-219-355

 Received: 13 April 2020; Accepted: 23 April 2020; Published: 25 April 2020

 Abstract: This article addresses the design and validation of an updated questionnaire that makes
 it possible to understand the use patterns and attitudes of university youth on social networks.
 The authors utilized a panel of 20 judges who were social media experts and a sample of 640
 university students. The exploratory factor analysis (EFA) explained 66.523% of the total variance.
 The confirmatory factor analysis (CFA), carried out to verify the dimensional structure of the
 instrument, reflected the appropriate parameters. The reliability study showed a Cronbach’s alpha of
 0.864. These data corroborated the development of a robust and reliable questionnaire. The resulting
 instrument did not contain items alluding to specific social networks (Facebook, Twitter, Instagram,
 or LinkedIn), but rather students’ usage patterns of them. The exclusion of items that referred to
 particular social networks during the research demonstrated a convergence in behavior on social
 media regardless of the nuances of each platform. This fact suggested that the platform was of
 secondary importance in the context of a new paradigm in which the type of use (viewing, posting,
 participating, or interacting) took precedence over the name of the network itself.

 Keywords: social networks; Facebook; Twitter; Instagram; LinkedIn; structural equation modeling;
 validity; reliability; university

1. Introduction
     Growth in Internet use has been accompanied by the spread of social media throughout the world.
In Spain, according to data from the National Institute of Statistics, through its Survey on Equipment
and Use of Information and Communication Technologies in Households, the percentage of social
networking users between 16 and 24 years reached 90.6% in 2019 [1].
     These platforms have an undeniable impact, and their integration into the lives of the youngest
stratum of society is an established reality. Many young people have fully integrated the use of social
networks into their daily routines. Gómez-Aguilar, Roses-Campos, and Farias-Batlle [2], for example,
suggested that these platforms have positioned themselves among youth as a space for a quick and
easy exchange of information. Meanwhile, Bernal and Angulo [3] stated that social networks offer
young people tools of support both in their search for personal contact and in the construction of their
social selves.
     The success of these platforms is owed to many factors, including aspects such as their dynamic
content, their collaborative utility, their intuitiveness, their accessibility, and their interactive nature [4].
However, what is a social network? Castañeda Quintero [5] defined these platforms as “those telematic

Sustainability 2020, 12, 3503; doi:10.3390/su12093503                         www.mdpi.com/journal/sustainability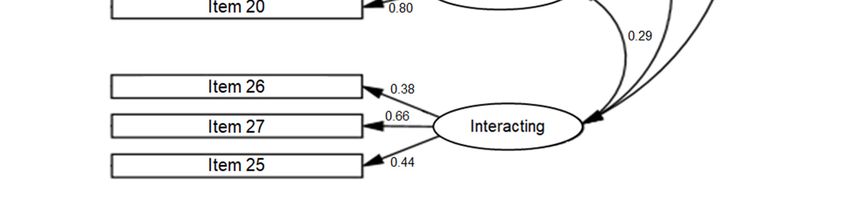
Sustainability 2020, 12, 3503                                                                       2 of 14

tools organized around user profiles—personal or professional—in which the individual must establish
connections with other individuals with whom they share common concerns”.
     However, the complexity of the social media phenomenon goes beyond the above definition.
Thus, Prendes Espinosa, Gutiérrez Porlán, and Castañeda Quintero [6] shifted the discussion regarding
these platforms toward broader aspects. Three such aspects are of note: (a) cognitive interactivity [7],
(b) collective intelligence on social networks [8], and (c) connectivism and participation in the digital
age [9].
     Similarly, the literature review by Almansa, Fonseca, and Castillo [10] on social media research
also demonstrated three major thematic areas: (a) the representation of users and the creation of
links between them [11,12]; (b) the structuring of networks around the individual’s concerns and
motivations [13,14]; and (c) the privacy and risks of social networks [15,16].
     More recently, García-Ruiz, Tirado, and Hernando [17] addressed the study of this phenomenon
from the perspective of the uses and gratification theory in mass media in order to examine the rewards
young people experience upon using some of these platforms intensively.

1.1. Social Networks in The University
     Social media figures prominently in the area of higher education. Many studies note the benefits
of using social networks as a value-added tool in teaching and learning processes. At a time when
pedagogical models are actively changing, the use of these platforms plays a key role in university
education [18]. In this context, the pillars of participation, interaction, and collaboration around which
social media is built make its integration into university education particularly propitious. Various
authors [19] pointed out that the introduction of these technologies in the university context may favor
a better adaptation to the guidelines established by the European Higher Education Area (EHEA).
     The literature regarding the applicability and implementation of social networks in teaching and
learning processes in higher education describes multiple approaches. Gutiérrez Porlan and Soto
Pérez [20], for example, explored the use of Facebook groups as a tool for interaction and participation
between students and teachers in the final course on pedagogy to improve the classroom environment.
     The study by Santillán García, Cornejo Marroquín, and Ausín Lomas [21] described an approach
focused on using Facebook to improve the dissemination and visibility of a blog with academic
information of interest to students in health sciences degree programs.
     The approach by Tuñez López and Sixto García [22] with journalism students proposed using
Facebook pages to redirect student-teacher communication flows to a virtual space.
     In the same vein, research conducted by Marín and Tur [23] among a sample of students in
education programs revealed participants’ positive attitudes toward the use of Twitter as a way to
reinforce their learning.
     Meanwhile, the study by Cabero and Marín [24] explored the predisposition of students majoring
in early childhood and elementary education at several universities toward the use of different social
networks (Facebook, Twitter, LinkedIn, and Hi5) for collaborative purposes.
     The research of Serrat Antoli [25] on the use of Facebook in the development of participatory
methodologies in the university context showed the potential of this platform, on the one hand, as a
generator of knowledge and, on the other, as a dynamic instrument for the course.
     Matosas-López and Romero-Luis’s work [26] with marketing students explored the correlations
between the use patterns of Facebook, Twitter, and Instagram and the perceived usefulness for these
students of certain digital learning resources.
     Finally, the research conducted by Santoveña-Casal and Bernal-Bravo [27] revealed that the use
of Twitter not only provided a motivational element that other tools, such as forums, were unable to
provide, but also enabled self-directed learning.
     All these works present experiences related to the application and use of different social
networking platforms in the university context. However, platforms such as MySpace, Tuenti,
Hi5, or Xing [2,19,24,28] have gradually lost popularity in favor of others, such as Facebook, Twitter,
Sustainability 2020, 12, 3503                                                                     3 of 14

Instagram, and LinkedIn [29]. Similarly, the functionality and usage patterns of social media users
have not remained static over time. Thus, functionalities that until a few years ago were of scant
importance, such as mentions or hashtags, or whose implementation presented technical challenges,
as in case of videos or GIFs (Graphic Interchange Format), are now central to habitual patterns of use
on these platforms.

1.2. Objective
      In a dynamic and changing context such as that of social networking, possessing up-to-date
information regarding the actual realities of social media use is of paramount importance, so much so
that, for example, Folch and Castellano [30] highlighted the need to carry out periodic and continuous
research on this topic. On the other hand, the awareness of encouraging sustainable education makes
the promotion of these technologies for educational purposes a sensible issue [31–33].
      This study aims to provide the academic community with a competent and effective questionnaire
to gather information on the current use patterns and attitudes of university youth on social networks.
To do so, the authors design and validate an updated measurement instrument.
      Given that use patterns on social media are changing rapidly, gathering information from patterns
at the current moment will help teachers to understand the type of use made by the student on
these platforms.

2. Material and Methods

2.1. Participants
     The research, carried out during the academic year 2019-2020, involved both a panel of experts
and a sample of university students. On the one hand, the authors turned to a panel of expert judges
for content validation. On the other hand, they used a sample of students for the comprehension
validity, construct validity, and reliability analyses of the questionnaire.
     The panel of expert judges involved in content validation were 20 subjects, all with more
than 8 years of experience. In line with the approach of García-Vera, Roig-Vila, and García [34],
the authors employed a multidisciplinary panel made up of teachers in the field of information and
communication technology (ICT) and professionals in social networking management. The panel
included 10 professors specialized in ICT education and 10 social media professionals with experience
in corporate communications in the public and private spheres. The average age of the panel members
was 41.16 (SD = 3.62), with 45% females (9 out of 20) and 55% males (11 out of 20).
     The sample of students participating in the analysis of comprehension validity, construct validity,
and reliability was made up of students in eight different degree programs at Rey Juan Carlos University
(a medium-sized university in Spain). The programs were selected from the university catalog by
convenience sampling, taking those that were representative and to which there was easier access [35].
Attempting to maintain heterogeneity between the different fields of study, the authors selected the
following eight degree programs: Marketing, Elementary Education, Law, Accounting and Finance,
International Relations, Industrial Organization Engineering, Nursing, and Social Work. To ensure the
representativeness of the programs selected over the entire sample, the authors performed stratified
sampling by selecting the participants in each program in a simple random manner [36]. The weight of
each stratum in the sample is listed in Table 1.
     Assuming a maximum indeterminate form in which the probability of being part of the sample is
identical to the probability of not being part of it (P = Q = 0.50) and assuming a 95% confidence level,
the sample of 640 subjects out of the total of 7128 enrolled students in the above eight majors showed a
sampling error of 3.64%. Based on the criteria of other authors that indicated sampling errors of up to
7% [37], the researchers considered that this sample provided the study more than adequate statistical
significance. The average age of the students was 19.93 (SD= 1.84), with 54.30% being female and
45.70% male.
Sustainability 2020, 12, 3503 4 of 14
Table 1. Distribution of strata in the sample.
Sample Percentage Out
Program Enrolled Students Sample
of Enrolled Students
Marketing 1853 164 8.85%
Elementary Education 1457 133 9.15%
Law 1411 125 8.84%
Accounting and Finance 841 74 8.75%
International Relations 719 65 9.10%
Industrial Organization Engineering 486 48 9.88%
Nursing 361 31 8.59%
Social Work 215 20 9.40%
Total 7128 640 8.98%
Source: created by the authors.
2.2. Design of the First Version of the Questionnaire
The body of the initial questionnaire was designed based on the authors’ literature review
regarding the use of social media. In the first version of the instrument, four blocks were considered,
consisting of a total of 28 items (see Table 2).
Table 2. Description of the items in the first version of the questionnaire.
Item Description
Block I
Item 1 Importance placed on having an active Twitter account
Item 2 Importance placed on having an active Facebook account
Item 3 Importance placed on having an active Instagram account
Item 4 Importance placed on having an active LinkedIn account
Item 5 Frequency of accessing Twitter
Item 6 Frequency of accessing Facebook
Item 7 Frequency of accessing Instagram
Item 8 Frequency of accessing LinkedIn
Block II
Item 9 Importance placed on following friends and/or family members
Item 10 Importance placed on following prominent figures
Item 11 Importance placed on mentioning friends and/or family members
Item 12 Importance placed on mentioning prominent figures
Item 13 Importance placed on sending private messages to other users
Item 14 Importance placed on watching videos or GIFs on the network
Item 15 Importance placed on posting videos or GIFs on the network
Item 16 Importance placed on searching for or accessing information
Item 17 Importance placed on looking at photos
Item 18 Importance placed on posting photos
Item 19 Importance placed on sharing your thoughts
Item 20 Importance placed on participating in surveys or games
Item 21 Importance placed on taking part in discussions
Block III
Item 22 Importance placed on posting status updates
Item 23 Importance placed on the look and presentation of your profile photo
Item 24 Importance placed on the personal description shown on your profile
Item 25 Frequency of use of the mentions function
Item 26 Frequency of use of the hashtag function
Item 27 Frequency of use of “like” function or similar
Block IV
Item 28 Device used to access social networks
Source: created by the authors.Sustainability 2020, 12, 3503 5 of 14
For the definition of Block I, which included the most common social networks, as well as
their frequency of use, the work of Sánchez-Rodríguez, Ruiz-Palmero, and Sánchez-Rivas was taken
as a reference [18]. In the design of Block II, which focused on the types of uses of the platform,
some of the reflections of the research on social media usage habits by García-Jiménez, López-de-Ayala,
and Catalina-Garcia were considered [38]. Block III addressed the layout of user profiles and the native
functionalities of the platform, following several of the conclusions of Almansa, Fonseca, and Castillo’s
work [10]. Finally, Block IV included information about the devices used to access social networks,
borrowed from the categorization proposed by Prendes Espinosa, Gutiérrez Porlan, and Castañeda
Quintero [6] in their research on user profiles of university students.
Of the 28 items that made up the body of the initial questionnaire, Items 1 through 27 took the
type of scale used by García-Ruiz et al. [17] in their work on uses and gratifications and were answered
on a five-point Likert scale. Item 28 was presented as a multiple-choice question with five devices as
answering choices (smartphone, tablet, laptop, desktop PC, and smart TV).
2.3. Fieldwork and Analysis Procedure
In line with the indications of Carter-Dios and Pérez [39] or Reche et al. [40], for the development of
instrumental studies, after completing the first version of the questionnaire, the validity and reliability
of the questionnaire were analyzed. The approach for this task consisted of four distinct stages:
(1) content validity analysis, (2) comprehension validity analysis, (3) construct validity analysis, and (4)
reliability analysis of the final instrument. In addition, after this four-stage procedure, the authors
reported the overall descriptive results obtained with the final questionnaire in a fifth section.
The technique used for content validity analysis, following the recommendations of similar
investigations [41,42], was expert judgment. Once this first validation was completed, with the
resulting items, the questionnaire was administered online to the student sample. The data collected
through this intermediate version of the instrument will serve to develop further analyses.
Comprehension validity was analyzed by examining, on the one hand, the standard deviation
(SD), skewness, and kurtosis values and, on the other, the corrected item-total correlation coefficient
and Cronbach’s alpha when individual items were deleted [43].
Construct validity, in line with other studies regarding the validation of questionnaires in the
university setting [44,45], was examined using an exploratory factor analysis (EFA) followed by a
confirmatory factor analysis (CFA). The fit of the CFA was evaluated by examining the comparative fit
index (CFI), the goodness-of-fit index (GFI), the root mean squared error of approximation (RMSEA),
and the standardized root mean squared residual (SRMR) [46,47].
Finally, the reliability of the final instrument was assessed with Cronbach’s alpha and the average
variance extracted (AVE) [48].
Once the validity and reliability analyses were completed, the overall descriptive results obtained
with the final questionnaire were shown, presenting the average value for each question along with its
SD. All analyses were carried out using the IBM SPSS 25 statistical analysis software and its extension
AMOS Version 20.
3. Results
3.1. Content Validity Analysis
Content validation was carried out in three successive rounds in which the panel of expert judges
assessed the pertinence, relevance, and precision of each of the 28 questions in the questionnaire. In each
of these three rounds, the panel of experts received a template in which each item was quantitatively
scored on a ten-point Likert scale.
In the first round of assessment, judges gave high scores on the pertinence of the questions
(M = 8.32, SD = 1.26). The second stage also received positive assessments regarding the relevance of
the items in the questionnaire (M = 8.91, SD = 0.95). Finally, the third round also reflected optimalSustainability 2020, 12, 3503 6 of 14
results regarding the level of precision in the wording of the questions (M = 8.37, SD = 0.98). Despite
the above, poorly scored items were also identified at all stages.
In line with the approaches of previous studies [48,49], in each round, the authors discarded those
items with average values less than seven. This refinement criterion led to eliminating nine of the
28 items in the first version of the instrument (Item 1, Item 2, Item 3, Item 4, Item 8, Item 9, Item 10,
Item 13, and Item 19), generating a second version of the questionnaire with 19 items.
3.2. Comprehension Validity Analysis
The study of comprehension validity, like the subsequent analyses, was carried out based on
the data obtained after the questionnaire was administered to the sample of students participating in
the study. For this analysis, the SDs were extracted in addition to skewness and kurtosis values (see
Table 3). Items with SD > 1 and skewness and kurtosis values between -1 and one were considered
adequate [50].
Table 3. Standard deviation values and skewness and kurtosis indicators.
Item SD Skewness Skewness Standard Error Kurtosis Kurtosis Standard Error
Item 5 1.456 0.972 0.145 −0.519 0.290
Item 6 1.733 −0.110 0.145 1.231 0.290
Item 7 1.780 0.368 0.145 −1.402 0.290
Item 11 1.097 −0.207 0.145 −0.470 0.290
Item 12 1.008 0.802 0.145 0.419 0.290
Item 14 1.095 −0.388 0.145 −0.566 0.290
Item 15 1.177 0.451 0.145 −0.736 0.290
Item 16 1.032 −0.810 0.145 0.162 0.290
Item 17 1.026 −0.711 0.145 0.104 0.290
Item 18 1.123 −0.203 0.145 −0.598 0.290
Item 20 1.251 0.386 0.145 −0.857 0.290
Item 21 1.186 0.378 0.145 −0.760 0.290
Item 22 1.120 −0.192 0.145 −0.700 0.290
Item 23 1.436 0.276 0.145 −1.278 0.290
Item 24 1.399 0.012 0.145 −1.265 0.290
Item 25 0.956 0.056 0.145 −0.628 0.290
Item 26 0.946 0.841 0.145 0.022 0.290
Item 27 1.071 −0.487 0.145 −0.254 0.290
Item 28 0.407 5.407 0.145 29.381 0.290
Source: created by the authors.
SD values, as well as skewness and kurtosis values were considered acceptable for 18 of the 19
items. Only Item 28 was eliminated, for presenting an SD less than one and skewness and kurtosis
values outside of the specified range. Item 28 pertained to the device students used to access
social networks. This question, because it was answered in the same way by nearly every subject
(a smartphone), did not contribute to gathering meaningful information. After eliminating this item,
a third version of the measurement instrument was generated, with 18 items.
The level of discrimination of each item was also examined using item-total correlation statistics
(see Table 4). The items considered adequate were those with corrected item-total correlation values of
> 0.20 and for which the elimination of the item did not substantially increase the reliability expressed
by Cronbach’s alpha [43].
The table shows acceptable corrected correlation and Cronbach’s alpha values for 13 of the 18
items, suggesting that five items may be deleted (Item 5, Item 6, Item 7, Item 23, and Item 24). Thus,
before analyzing the construct validity and final reliability of the instrument, a fourth, and a priori
final, version of the questionnaire was obtained, consisting of 13 items.Sustainability 2020, 12, 3503 7 of 14
Table 4. Item-total correlation statistics.
Scale Variance If Corrected Item-Total Cronbach’s Alpha If
Item
Item Deleted Correlation Item Deleted
Item 5 77.796 0.158 0.714
Item 6 77.142 0.125 0.723
Item 7 77.556 0.103 0.727
Item 11 74.742 0.422 0.686
Item 12 76.702 0.354 0.693
Item 14 73.596 0.488 0.680
Item 15 72.124 0.523 0.675
Item 16 73.834 0.511 0.680
Item 17 73.410 0.540 0.677
Item 18 70.947 0.621 0.667
Item 20 71.934 0.493 0.677
Item 21 74.750 0.380 0.689
Item 22 72.078 0.559 0.673
Item 23 81.285 0.024 0.728
Item 24 84.244 −0.087 0.738
Item 25 79.817 0.243 0.706
Item 26 80.939 0.222 0.711
Item 27 78.141 0.247 0.702
Source: created by the authors.
3.3. Construct Validity Analysis
Before proceeding with the factor analyses (EFA and CFA) required to analyze construct validity,
the Kaiser–Meyer–Olkin test for sampling adequacy and Bartlett’s test for sphericity were run.
The purpose of extracting these two statistics was to evaluate the fit of the data to the planned factor
analyses. The Kaiser–Meyer–Olkin value obtained was 0.764, better than the recommended value of
0.600. Bartlett’s test of sphericity yielded a statistical significance of 0.000. Both results confirmed the
existence of sufficient correlations between the items, so factorial analyses were appropriate [51,52].
3.3.1. EFA
Before the EFA, the authors extracted the scree plot (see Figure 1). This graph provided an initial
approach that identified four factors or dimensions. These four dimensions could be observed by the
existence of three turning points: a first and evident turning point in Element 2 and two slight turning
points matching more with Elements 11 and 12.
These four factors accounted for 66.523% of the total variance of the instrument. Their compositions
are detailed below.
Factor 1 included four items (Item 17, Item 14, Item 16, and Item 11) that explained 22.673% of the
variance. These items referred to the importance assigned to the viewing of photos, videos, and GIFs,
searching for information, and the use of mentions of friends and/or family members. The authors
labelled this factor “viewing.”
Factor 2 contained four items (Item 18, Item 22, Item 15, and Item 12) that explained 19.639% of
the variance. These items referred to the importance of posting photos, videos, and GIFs, making
status updates, and the use of mentions to prominent figures. This factor was labeled “posting.”
Factor 3 includes two items (Item 21 and Item 20) that explained 12.368% of the variance.
These addressed the importance assigned to participation in surveys, games, and discussions.
The authors labelled this factor “participating.”
Finally, Factor 4 contained the last three items (Item 26, Item 27, and Item 25). These explained
11.843% of the variance and referred to the frequency of use of hashtags, likes, and mentions. This factor
was labeled “interacting.”Sustainability 2020, 12, 3503 8 of 14
Sustainability 2020, 12, x FOR PEER REVIEW 9 of 16
Figure created
Figure 1. Scree plot. Source: 1. Screeby
plot.
the authors (SPSS.25).
The EFA was carried out following the extraction
Source: created of main
by the authors components, with varimax rotation,
(SPSS.25).
applying the criterion of eigenvalue > 1 for factor extraction. The rotated component matrix extracted
showedThethe
EFA was carried
dimensional out following
structure of the the extractionrevealing,
instrument, of main components, with
in accordance varimax
with rotation,
the scree plot,
applying
the theofcriterion
existence of eigenvalue
four underlying > 1infor
factors thefactor
set ofextraction.
items (seeThe rotated
Table 5). component matrix extracted
showed the dimensional structure of the instrument, revealing, in accordance with the scree plot, the
existence of four underlying factors Table Rotated
in 5.the set of component
items (see matrix.
Table 5).
Item Factor 1 Factor 2 Factor 3 Factor 4
Table 5. Rotated component matrix.
Item 17 0.841
Item Item 14 Factor
0.775 1 Factor 2 Factor 3 Factor 4
Item 17 Item 16 0.768
0.841
Item 14 Item 11 0.601
0.775
Item 16 Item 18 0.768 0.851
Item 11 Item 22 0.601 0.841
Item 15 0.731
Item 18 Item 12 0.480 0.851
Item 22 0.841
Item 21 0.841
Item 15 Item 20 0.731 0.769
Item 12 0.480
Item 26 0.698
Item 21 Item 27 0.841
0.687
Item 20 Item 25 0.769
0.668
Item 26 Source: created by the authors. 0.698
Item 27 0.687
Item 25 0.668
Source: created by the authors.addressed the importance assigned to participation in surveys, games, and discussions. The authors
labelled this factor “participating.”
Finally, Factor 4 contained the last three items (Item 26, Item 27, and Item 25). These explained
11.843% of the variance and referred to the frequency of use of hashtags, likes, and mentions. This
Sustainability
factor 2020, 12,“interacting.”
was labeled 3503 9 of 14
3.3.2. CFA
3.3.2. CFA
Once the dimensional structure of the instrument was known, its validity was confirmed by
Once the dimensional structure of the instrument was known, its validity was confirmed by
means of CFA. This CFA was done by estimating the parameters of the model under the maximum
means of CFA. This CFA was done by estimating the parameters of the model under the maximum
likelihood criterion. The model produced by the analysis, with its respective standardized regression
likelihood criterion. The model produced by the analysis, with its respective standardized regression
coefficients and the covariances between factors, is reflected in Figure 2.
coefficients and the covariances between factors, is reflected in Figure 2.
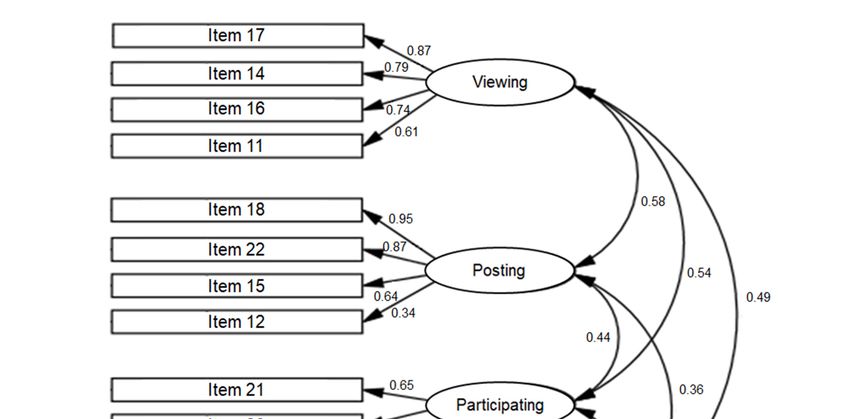
Figure 2. Confirmatory factor analysis (CFA) model for the questionnaire assessing the use of social
networks.
Figure Source: created
2. Confirmatory byanalysis
factor the authors (AMOS
(CFA) model20).
for the questionnaire assessing the use of social
networks. Source: created by the authors (AMOS 20).
The evaluation of the CFA model was carried out by examining the usual indicators: CFI,
GFI, RMSEA,
The andofSRMR.
evaluation Themodel
the CFA model fit,carried
was measured as examining
out by the chi-squared/degrees of freedom
the usual indicators: ratio
CFI, GFI,
(χ 2 /df), was 2.473, presenting the following fit indicators: CFI = 0.935, GFI = 0.925, RMSEA = 0.073,
RMSEA, and SRMR. The model fit, measured as the chi-squared/degrees of freedom ratio (χ /df), was2
and SRMR = 0.0596.
The CFI can be interpreted as a multivariate coefficient of determination, which is considered
optimal when greater than 0.90 [53]. Similarly, the GFI is a comparative fit indicator that is also
considered appropriate at 0.90 to 0.95 [54]. The RMSEA reflects the difference between the population
matrix and sample model and indicates a good model fit when less than 0.08 [55]. Finally, the SRMR
represents the status of standardized residuals, and a value below 0.08 again indicates an optimal fit [56].
3.4. Reliability Analysis of The Final Instrument
The reliability and internal consistency of the final version of the questionnaire were examined
using Cronbach’s alpha. This coefficient explores the homogeneity of the items contained in each
factor, revealing whether they are interconnected [57].
The internal consistency of the items comprising the first factor (viewing) showed a Cronbach’s
alpha of 0.831. The items included in the second factor (posting) presented a Cronbach’s alpha of
0.798. The internal consistency for the third factor (participating) showed a value of 0.684. The items of
the fourth factor (interacting) had a Cronbach’s alpha of 0.604. According to Kerlinger and Lee [58],Sustainability 2020, 12, 3503 10 of 14
reliability coefficients between 0.600 and 0.850 for each of the constructs are considered optimal.
Similarly, the reliability of the instrument as a whole also had a satisfactory overall coefficient of 0.864.
To conclude, in accordance with Calderón et al. [48], the reliability analysis was completed by
examining the AVE. The AVE was above 0.50 for each of the four factors, further corroborating the
reliability of the final instrument.
3.5. Descriptive Results Obtained with the Validated Questionnaire
Table 6 presents the descriptive results obtained for each item of the final questionnaire. The results
are organized by factor. Factor 1 (viewing) highlights the importance assigned to viewing photos and
searching for information. Factor 2 (posting) demonstrates that participants assigned great importance
to posting photos and posting status updates on their profiles.
Table 6. Descriptive results of the validated questionnaire.
Item Description Average SD
Factor 1: Viewing
Item 17 Importance placed on looking at photos 3.80 1.026
Item 14 Importance placed on watching videos or GIFs on the network 3.55 1.095
Item 16 Importance placed on searching for or accessing information 3.89 1.032
Item 11 Importance placed on mentioning friends and/or family members 3.24 1.097
Factor 2: Posting
Item 18 Importance placed on posting photos 3.12 1.023
Item 22 Importance placed on posting status updates 2.96 1.020
Item 15 Importance placed on posting videos or GIFs on the network 2.35 1.177
Item 12 Importance placed on mentioning prominent figures 2.20 1.008
Factor 3: Participating
Item 21 Importance placed on taking part in discussions 2.47 1.286
Item 20 Importance placed on participating in surveys or games 2.53 1.351
Factor 4: Interacting
Item 26 Frequency of use of the hashtag function 1.91 0.946
Item 27 Frequency of use of “like” function or similar 3.43 1.071
Item 25 Frequency of use of the mentions function 2.65 0.956
Source: created by the authors.
Likewise, of note in Factor 3 (participating) was the item referring to participation in surveys or
games. However, the responses to this item had a high dispersion, which denoted a low degree of
consensus among the participants on this question. Finally, in Factor 4 (Interacting), the item that stood
out was on the subjects’ high frequency of the use of the “like” function.
4. Discussion and Conclusions
The questionnaire designed by the authors filled the need to obtain up-to-date information
regarding the social network use patterns among university youth. This work provided an updated
measurement instrument that could be used to understand the realities of social networking, as a step
before the development of pedagogical practices that incorporate these technologies.
The analyses carried out indicated that the resulting questionnaire was robust and reliable.
The content validity, assessed by a panel of expert judges, presented high scores and levels of agreement
in terms of pertinence, relevance, and precision in the wording of the items. The comprehension
validity included adequate values for SD, skewness, kurtosis, and corrected item-total correlation for
the items in the final instrument. Similarly, the construct validity, examined by EFA, explained 66.523%
of the variance, and the subsequent CFA yielded optimal values of CFI, GFI, RMSEA, and SRMR.
Likewise, the reliability analysis of the final questionnaire revealed an overall Cronbach’s alpha of
0.864, as well as appropriate AVE values.Sustainability 2020, 12, 3503 11 of 14
The procedure presented led to a questionnaire whose final version was comprised of four factors
or dimensions (viewing, posting, participating, and interacting) spread across 13 items. These 13 items
allowed information to be gathered on aspects such as the type of content that was searched for and
posted, participation and collaboration with other users, and the ways users interacted within the
social media setting.
It should be noted that the final version attained after the process of developing and validating
the instrument did not contain items that referred to any specific social network, but rather students’
patterns of use within them. The elimination of items that made explicit mention of specific platforms
reflected, in the authors’ view, a convergence in behaviors within social media regardless of the different
nuances of each network. The authors concluded, therefore, that the distinctive and characteristic
elements of each platform were of secondary importance in a new paradigm in which the type of
use (viewing, posting, participating, or interacting) prevails over the name and brand image of the
network itself.
These findings were in line with previous studies highlighting the volatile and fleeting nature of
many social media platforms. Examples of this were the works by Matosas-López and Romero-Ania [29]
and by Matosas-López, Romero-Ania and Romero-Luis [59], studies in which the authors addressed
how certain networks disappeared and gave way to others. From the opposite perspective, the results of
this research came into conflict with those of previous studies on the use of social networks, works that
focused their analyses on specific platforms of a general nature such as WhatsApp [60] or platforms
specialized in education such as Edmodo [61].
In view of the above, the authors underline that one of the main advances of this work was that it
demystified the topic of what platform to use to put the focus on what to do regardless of whether it is
a platform or another.
On the other hand, the overall descriptive results obtained through the final questionnaire
confirmed many of the findings of previous studies. Factor 1 (viewing), in line with the study by
Monge Benito and Olabarri Fernández [62], revealed the importance participants placed on viewing
content on these networks. In addition, this factor confirmed the usefulness of these platforms as tools
for searching for information, noted by Prendes Espinosa et al. [6].
Factor 2 (posting), consistent with the findings of Sánchez-Rodríguez et al. [18], emphasized
the importance students placed on sharing content with their network. This factor also confirmed
what Valerio Ureña and Serna Valdivia pointed out [63]: university students are always interested in
updating their status on their profiles.
Likewise, Factor 3 (participating), in line with Abella García and Delgado Benito [64], corroborated
the importance university students placed on these platforms as tools for discussion and information
exchange. This factor also confirmed the findings of García-Ruiz et al. [17] and Doval-Avendaño,
Domínguez Quintas, and Dans Álvarez [65] regarding the entertainment potential of these technologies.
Finally, Factor 4 (interacting) highlighted the use of the “like” function, confirming what was
reported by García Galera, Fernández Muñoz and Del Hoyo Hurtado [66] in their work on cooperation
and ways of interacting among young university students in the digital age.
In light of the above, the authors concluded that the developed questionnaire was valid and
reliable for evaluating the use patterns of university youth on social networks at the present time.
The instrument made it possible to obtain necessary information for the implementation of pedagogical
practices supported by these platforms.
Author Contributions: Methodology, writing, review and editing and project administration, M.G.-G.;
data curation, formal analysis, resources, and writing, original draft, L.M.-L.; funding acquisition, conceptualization,
and supervision, J.R.-P. All authors equally contributed to this article. All authors read and agreed to the published
version of the manuscript.
Funding: This research was funded by the ERASMUS + program financed by the European Union, Grant Number
2019-1-ES01-KA201-065104.
Conflicts of Interest: The authors declare no conflict of interest.Sustainability 2020, 12, 3503 12 of 14
References
1. INE. Encuesta Sobre Equipamiento y Uso de Tecnologías de Información y Comunicación en Los Hogares. TICH 2019;
INE: Madrid, Spain, 2019.
2. Gómez-Aguilar, M.; Roses-Campos, S.; Farias-Batlle, P. El uso académico de las redes sociales en universitarios.
Comunicar 2012, 19, 131–138. [CrossRef]
3. Bernal, C.; Angulo, F. Interacciones de los jóvenes andaluces en las redes sociales. Comunicar 2013, 20, 25–30.
4. Castaño, C.; Maiz, I.; Palacio, G.; Villarroel, J.D. Prácticas educativas en entornos Web 2.0; Cabero, J., Ed.;
Editorial Síntesis: Madrid, Spain, 2008; ISBN 9788497565714.
5. Castañeda Quintero, L. Aprendizaje Con Redes Sociales: Tejidos Educativos Para Los Nuevos Entornos;
Cabero-Almenara, J., Ed.; Editorial MAD: Sevilla, Spain, 2010; ISBN 978-84-676-3619-2.
6. Prendes Espinosa, P.; Gutiérrez Porlán, I.; Castañeda Quintero, L. Perfiles de uso de redes sociales: Estudio
descriptivo con alumnado de la Universidad de Murcia. Rev. Complut. Educ. 2015, 26, 175–195. [CrossRef]
7. Prendes Espinosa, M.P. Nuevas Tecnologías y Educación; Pearson Educación: Madrid, Spain, 2004;
ISBN 8420541621.
8. Lévy, P. Inteligencia Colectiva Por Una Antropología Del Ciberespacio; Organización Panamericana de la Salud:
Washington, DC, UA, 2004; ISBN 2707126934.
9. Siemens, G. Connectivism: A Learning Theory for the Digital Age. Int. J. Instr. Technol. Distance Learn. 2014,
2, 1–9.
10. Almansa, A.; Fonseca, O.; Castillo, A. Redes sociales y jóvenes. Uso de Facebook en la juventud colombiana
y española. Comunicar 2013, 20, 127–135.
11. Junco, R. The relationship between frequency of Facebook use, participation in Facebook activities, and student
engagement. Comput. Educ. 2012, 58, 162–171. [CrossRef]
12. McAndrew, F.T.; Jeong, H.S. Who does what on Facebook? Age, sex, and relationship status as predictors of
Facebook use. Comput. Hum. Behav. 2012, 28, 2359–2365. [CrossRef]
13. Backstrom, L.; Huttenlocher, D.; Kleinberg, J.; Lan, X. Group formation in large social networks: Membership,
growth, and evolution. In Proceedings of 12th International Conference on Knowledge Discovery in Data Mining;
ACM Press: New York, NY, USA, 2006; pp. 44–54.
14. Liu, H.; Maes, P.; Davenport, G. Unraveling the Taste Fabric of Social Networks. Int. J. Semant. Web Inf. Syst.
2006, 2, 42–71. [CrossRef]
15. Calvete, E.; Orue, I.; Estévez, A.; Villardón, L.; Padilla, P. Cyberbullying in adolescents: Modalities and
aggressors’ profile. Comput. Hum. Behav. 2010, 26, 1128–1135. [CrossRef]
16. McBride, D.L. Risks and benefits of social media for children and adolescents. J. Pediatr. Nurs. Nurs. Care
Child. Fam. 2011, 26, 498–499. [CrossRef]
17. García-Ruiz, R.; Tirado, R.; Hernando, Á. Redes sociales y estudiantes: motivos de uso y gratificaciones.
Evidencias para el aprendizaje. Aula Abierta 2018, 47, 291–298. [CrossRef]
18. Sánchez-Rodríguez, J.; Ruiz-Palmero, J.; Sánchez-Rivas, E. Uso problemático de las redes sociales en
estudiantes universitarios. Rev. Complut. Educ. 2015, 159, 1130–2496. [CrossRef]
19. Espuny Vidal, C.; González Martínez, J.; Lleixà Fortuño, M.; Gisbert Cervera, M. Actitudes y expectativas
del uso educativo de las redes sociales en los alumnos universitarios. RUSC. Univ. Knowl. Soc. J. 2011,
8, 171–185.
20. Gutiérrez Porlan, I.; Soto Pérez, F.J. Conectados: Una experiencia de uso de Facebook con estudiantes de
Pedagogía. In Proceedings of the IV Jornadas Nacionales TIC y Educación y Y III Jornadas EXPERTIC. Los Retos
De La Competencia Digital: El Cambio Metodológico; de Murcia, R., Consejería de Educación, F.E., Estadística,
S.G.S., Eds.: Lorca, Spain, 2012.
21. Santillán García, A.; Cornejo Marroquín, C.; Ausín Lomas, S. Las fan page de Facebook como medio de
difusión de la enfermería basada en la evidencia. Enfermería Glob. 2012, 11. [CrossRef]
22. Tuñez López, M.; Sixto García, J. Las redes sociales como entorno docente: Análisis del uso de Facebook en
la docencia universitaria. Pixel-Bit. Rev. Medios Educ. 2012, 41, 77–92.
23. Marín, V.I.; Tur, G. Student Teachers’ Attitude towards Twitter for Educational Aims. Open Prax. 2014, 6,
275–285. [CrossRef]
24. Cabero, J.; Marín, V. Posibilidades educativas de las redes sociales y el trabajo en grupo. Percepciones de los
alumnos universitarios. Comunicar 2014, 21, 165–172.Sustainability 2020, 12, 3503 13 of 14
25. Serrat Antoli, N. Metodologías participativas y Facebook en el ámbito universitario. Innoeduca. Int. J. Technol.
Educ. Innov. 2015, 1, 25. [CrossRef]
26. Matosas-López, L.; Romero-Luis, J. Correlaciones entre redes sociales y recursos educativos digitales en
estudiantes universitarios de Marketing en el EEES. In Contenidos audiovisuales, narrativas y alfabetización
mediática; Sierra Sánchez, J., Ed.; McGraw Hill: Madrid, Spain, 2019; pp. 393–402. ISBN 978-84-486-1816-2.
27. Santoveña-Casal, S.; Bernal-Bravo, C. Explorando la influencia del docente: Participación social en Twitter y
percepción académica. Comunicar 2019, 27, 75–84. [CrossRef]
28. Durán, M.; Guerra, J.M. Usos y tendencias adictivas de una muestra de estudiantes universitarios españoles
a la red social Tuenti. An. Psicol. 2015, 31, 260–267.
29. Matosas-López, L.; Romero-Ania, A. Preferencias de uso de redes sociales entre los estudiantes universitarios
de ciencias sociales. In Proceedings of the XIX Congreso Internacional de Investigación Educativa: Investigación
Comprometida para la Transformación Social; AIDIPE: Madrid, Spain, 2019; pp. 164–170.
30. Folch, C.S.; Castellano, C.M. Los medios sociales como herramientas de acceso a la información en la
enseñanza universitaria. Digit. Educ. Rev. 2017, 118–129.
31. Matosas-López, L.; Bernal-Bravo, C.; Romero-Ania, A.; Palomero-Ilardia, I. Quality Control Systems in Higher
Education Supported by the Use of Mobile Messaging Services. Sustainability 2019, 11, 6063. [CrossRef]
32. Hsieh, M.Y. The Most Sustainable Niche Principles of Social Media Education in A Higher Education
Contracting Era. Sustainability 2020, 12, 399. [CrossRef]
33. Ruiz-Palmero, J.; Sánchez-Rivas, E.; Gómez-García, M.; Sánchez Vega, E. Future Teachers’ Smartphone Uses
and Dependence. Educ. Sci. 2019, 9, 194. [CrossRef]
34. García-Vera, V.; Roig-Vila, R.; García, P. Construcción de un instrumento para medir la utilidad percibida de
las TIC usadas en la docencia por estudiantes de arquitectura técnica. Pixel-Bit. Rev. Medios Educ. 2016, 49,
121–135. [CrossRef]
35. Sabariego Puig, M. El proceso de investigación. In Metodología De La Investigación Educativa; Alzina, R.B., Ed.;
La Muralla: Madrid, Spain, 2004; pp. 128–163. ISBN 84-7133-748-7.
36. Gargallo López, B.; Suárez Rodríguez, J.; Garfella Esteban, P.; Fernández March, A. El cuestionario
CEMEDEPU. Un instrumento para la evaluación de la metodología docente y evaluativa de los profesores
universitarios. Estud. Sobre Educ. 2011, 21, 9–40.
37. Rivas-Rebaque, B.; Gértrudix-Barrio, F.; Britto, J.C.D.C. De La percepción del docente universitario ante el
uso y valor de los datos abiertos. Educ. XX1 2019, 22, 141–163. [CrossRef]
38. García-Jiménez, A.; López-de-Ayala, M.C.; Catalina-García, B. Hábitos de uso en Internet y en las redes
sociales de los adolescentes españoles. Comunicar 2013, XXI, 1–9.
39. Carretero-Dios, H.; Pérez, C. Normas para el desarrollo y revisión de estudios instrumentales. Int. J. Clin.
Heal. Psychol. 2005, 5, 521–551.
40. Reche Urbano, E.; Quintero Ordoñez, B.; Vilches Vilela, M.J. Influencia mediática en la vida de los menores.
Proceso de construcción y validación de un instrumento. EDMETIC 2017, 6, 359–381. [CrossRef]
41. Escobar-Pérez, J.; Cuervo-Martínez, Á. Validez de contenido y juicio de expertos: Una aproximación a su
utilización. Av. Med. 2008, 6, 27–36.
42. Santos Rego, M.A.; Sotelino Losada, A.; Jover Olmeda, G.; Naval, C.; Alvarez Castillo, J.L.; Vazquez Verdera, V.
Diseño y validación de un cuestionario sobre práctica docente y actitud del profesorado universitario hacia
la innovación. Educ. XX1 2017, 20, 39–71. [CrossRef]
43. Lacave Rodero, C.; Molina Díaz, A.I.; Fernández Guerrero, M.M.; Redondo Duque, M.A. Análisis de la
fiabilidad y validez de un cuestionario docente. Rev. Investig. Docencia Univ. Inf. 2016, 9, 2.
44. Luna Serrano, E. Validación de constructo de un cuestionario de evaluación de la competencia docente.
Rev. Electron. Investig. Educ. 2015, 17, 13–27.
45. Martínez Clares, P.; Pérez Cusó, F.J.; González Morga, N. ¿Qué necesita el alumnado de la tutoría universitaria?
Validación de un instrumento de medida a través de un análisis multivariante. Educ. XX1 2019, 22, 189–213.
[CrossRef]
46. Bentler, P.M. EQS, Structural Equations Program Manual; Multivariate Statistical Software: CA, USA, 2006.
47. Timmerman, M.E.; Lorenzo-Seva, U. Dimensionality assessment of ordered polytomous items with parallel
analysis. Psychol. Methods 2011, 16, 209–220. [CrossRef]Sustainability 2020, 12, 3503 14 of 14
48. Calderón, A.; Arias-Estero, J.L.; Meroño, L.; Méndez-Giménez, A. Diseño y Validación del Cuestionario
de Percepción del Profesorado de Educación Primaria sobre la Inclusión de las Competencias Básicas
(#ICOMpri3). Estud. Sobre Educ. 2018, 34, 67–97.
49. Bulger, S.M.; Housner, L.D. Modified Delphi Investigation of Exercise Science in Physical Education Teacher
Education. J. Teach. Phys. Educ. 2007, 26, 57–80. [CrossRef]
50. Lloret-Segura, S.; Ferreres-Traver, A.; Hernández-Baeza, I.; Tomás-Marco, A. El análisis factorial exploratorio
de los ítems: una guía práctica, revisada y actualizada. An. Psicol. 2014, 30, 1151–1169. [CrossRef]
51. Kaiser, H.F. An index of factorial simplicity. Psychometrika 1974, 39, 31–36. [CrossRef]
52. Sharon, A.T.; Bartlett, C.J. Effect of instructional conditions in producing leniency on two types of rating
scales. Pers. Psychol. 1969, 22, 251–263. [CrossRef]
53. Tanaka, J.S.; Huba, G.J. A fit index for covariance structure models under arbitrary GLS estimation. Br. J.
Math. Stat. Psychol. 1985, 38, 197–201. [CrossRef]
54. Bentler, P.M. Comparative fit indexes in structural models. Psychol. Bull. 1990, 107, 238–246. [CrossRef]
[PubMed]
55. Steiger, J.H. Structural Model Evaluation and Modification: An Interval Estimation Approach. Multivar.
Behav. Res. 1990, 25, 173–180. [CrossRef] [PubMed]
56. Hu, L.; Bentler, P.M. Cutoff criteria for fit indexes in covariance structure analysis: Conventional criteria
versus new alternatives. Struct. Equ. Model. A Multidiscip. J. 1999, 6, 1–55. [CrossRef]
57. Cea D’Ancona, M.A. Métodos De Encuesta: Teoría Y Práctica, Errores Y Mejora; Síntesis: Madrid, Spain, 2004;
ISBN 9788497562508.
58. Kerlinger, F.N.; Lee, H.B. Investigación Del Comportamiento. Métodos De Investigación En Ciencias Sociales; 4a .;
McGraw-Hill: México D.F., Mexico, 2008; ISBN 9789701030707.
59. Matosas-López, L.; Romero-Ania, A.; Romero-Luis, J. Similarities and differences in the use patterns of social
networks by university students: Comparative Spain—Azerbaijan. In Proceedings of the Congreso Universitario
Internacional Sobre La Comunicación En La Profesión Y En La Universidad De Hoy: Contenidos, Investigación,
Innovación y Docencia (CUICIID); Padilla Castillo, G., Ed.; Fórum XXI: Madrid, Spain, 2019; pp. 754–757.
60. Vílchez Vilela, M.J.; Reche Urbano, E.; Marín Díaz, V. Diseño y validación de un cuestionario para valorar
Whatsapp en la regulación de trabajo en grupo. Rev. Científica Electrónica Educ. Comun. Soc. Conoc. 2015,
15, 245–272.
61. Alonso-García, S.; Morte-Toboso, E.; Almansa-Núñez, S. Redes sociales aplicadas a la educación: EDMODO.
EDMETIC Rev. Educ. Mediática TIC 2014, 4, 88–111.
62. Monge Benito, S.; Olabarri Fernández, M.E. Los alumnos de la UPV/EHU frente a Tuenti y Facebook: Usos y
percepciones. Rev. Lat. Comun. Soc. 2011, 66.
63. Valerio Ureña, G.; Serna Valdivia, R. Redes sociales y bienestar psicológico del estudiante universitario.
Rev. Electrónica Investig. Educ. 2018, 20, 19. [CrossRef]
64. Abella García, V.; Delgado Benito, V. Aprender a usar Twitter y usar Twitter para aprender. Profr. Rev.
Currículum Form. Profr. 2015, 19, 364–378.
65. Doval-Avendaño, M.; Domínguez Quintas, S.; Dans Álvarez, I. El uso ritual de las pantallas entre jóvenes
universitarios/as. Prism. Soc. 2018, 21, 480–499.
66. García Galera, M.D.C.; Fernández Muñoz, C.; Del Hoyo Hurtado, M. Ciudadanía informada, ciudadanía
participativa. la movilización de los jóvenes en el entorno digital. Prism. Soc. 2017, 18, 124–143.
© 2020 by the authors. Licensee MDPI, Basel, Switzerland. This article is an open access
article distributed under the terms and conditions of the Creative Commons Attribution
(CC BY) license (http://creativecommons.org/licenses/by/4.0/).You can also read