Determinants of e-commerce satisfaction: a comparative study between Romania and Moldova
←
→
Page content transcription
If your browser does not render page correctly, please read the page content below
The current issue and full text archive of this journal is available on Emerald Insight at:
                          https://www.emerald.com/insight/0368-492X.htm

    Determinants of e-commerce                                                                                                     The
                                                                                                                        satisfaction of
  satisfaction: a comparative study                                                                                       e-commerce
                                                                                                                            consumers
   between Romania and Moldova
                                        Octavian Dospinescu
Business Information Systems, Faculty of Economics and Business Administration,
                University Alexandru Ioan Cuza, Iasi, Romania                                                           Received 15 March 2021
                                                                                                                          Revised 21 April 2021
                                         Nicoleta Dospinescu                                                             Accepted 16 May 2021

              Management, Marketing and Business Administration,
Faculty of Economics and Business Administration, University Alexandru Ioan Cuza,
                               Iasi, Romania, and
                                               Ionel Bostan
 Doctoral School of Economics, Ştefan cel Mare University, Suceava, Romania and
                 Department of Law and Administrative Sciences,
     Faculty of Law and Administrative Sciences, Ştefan cel Mare University,
                                Suceava, Romania
Abstract
Purpose – The purpose of this article is to highlight the relevance of the factors that influence the satisfaction
of e-commerce consumers in Romania and Moldova. The study aims to clearly define the main influence factors,
so that the marketing managers of the online stores can adopt scientific well-founded decisions.
Design/methodology/approach – The paper opted for a study including a large sample of 399 respondents
from two countries. For the analysis of the factors influencing the e-commerce satisfaction, multiple linear
regression analysis was implemented, and their differentiation within the two countries was highlighted by
multivariate analysis of variance.
Findings – The research conducted and the results obtained show that there is a differentiation of the factors
that influence the level of satisfaction of e-commerce users in Romania and Moldova.
Research limitations/implications – The research is still limited in terms of population studied to only two
countries: Romania and Moldova. Although the study is intended to be exhaustive by analyzing no less than 11
factors influencing the satisfaction generated by e-commerce, it is still limited to this group of representative
factors. Another limitation has to do with the limited number of demographic variables the authors have included.
Practical implications – Based on the results, the managerial implications for e-commerce companies that
want to uniquely address consumers in Romania and Moldova are related to the decisions of marketing and
sales managers who must allocate budgets and resources to improve the eight aspects highlighted in the paper.
Also, the e-commerce companies should not allocate resources for the implementation of functionalities such as
in-app after sales services, the possibility to cancel an order or the live consultant support feature, because these
aspects do not influence the satisfaction of e-commerce consumers in Romania and Moldova.
Originality/value – This paper is the first in the scientific literature that implements a comparative study on
the influence factors regarding the e-commerce satisfaction in Romania and Moldova. Also, it is important to
mention that the present study is an exhaustive one because it includes many influence factors that were
analyzed separately in the previous research papers from literature review.
Keywords E-commerce satisfaction, E-commerce comparative study, Romania and Moldova, E-commerce
influencing factors
Paper type Research paper

© Octavian Dospinescu, Nicoleta Dospinescu and Ionel Bostan. Published by Emerald Publishing
Limited. This article is published under the Creative Commons Attribution (CC BY 4.0) licence. Anyone
may reproduce, distribute, translate and create derivative works of this article (for both commercial and
non-commercial purposes), subject to full attribution to the original publication and authors. The full                                 Kybernetes
terms of this licence may be seen at http://creativecommons.org/licences/by/4.0/legalcode                                Emerald Publishing Limited
                                                                                                                                         0368-492X
   Disclosure statement: No potential conflict of interest was reported by the authors.                                  DOI 10.1108/K-03-2021-0197
K 1. Introduction
1.1 The general context and the purpose of the research
E-commerce is an increasing activity present in the modern life of people and companies
around the world. According to Lin et al. (2019), traders and customers try to find common
ground for transactions, so that the seller gets a profit and a market share as big as possible,
and buyers get the desired satisfaction following the purchase process. The e-commerce
relationship works in both the purchase of physical goods and the acquisition and use of
services such as banking (Geebren et al., 2021) in desktop and mobile environments. Thus,
in the online environment, trust acts as a mediator for the relationship between service
quality and customer satisfaction. The study conducted by Acquila-Natale and Iglesias-
Pradas (2020) highlights the importance of communication channels between the store and
the customer, as well as the dimensions that affect the relations between the two partners:
in-store experience, customer service, privacy and reliability. According to (Zhang et al.,
2019), one of the trends of modern society refers to IT consumerism. In this way,
e-commerce and e-business are driven by both individual customers and companies.
Mashud et al. (2021) points out that the problem of online commerce can also be seen in a
broader context of resilience to certain challenges such as the one generated by the COVID-
19 pandemic. Many authors tried to determine what are the main factors influencing
e-commerce consumer satisfaction, but no general consensus has been reached in this
regard. For example, the research by Kalia and Paul (2021) shows that the mechanisms that
generate e-commerce consumer satisfaction are not fully understood by merchants, and the
quality of electronic services is an important component of e-commerce. The electronic
services were classified according to seven different factors: efficiency, system availability,
fulfillment, privacy, responsiveness, compensation, contact. These factors can lead to
brand differentiation for online retailers.
Given that previous research has focused on narrow segments in terms of analyzing the
factors influencing e-commerce consumer satisfaction, and that there is no general consensus
in this regard, the authors believe that this aspect outlines a real “research gap” which
deserves to be investigated by scientific methods. As a result, the aim of this research is to
identify in a comprehensive way the factors influencing e-commerce satisfaction, as well as
the individual importance of these factors on consumer perception in online environments.
The research question proposed for this study is: what are the factors that influence
e-commerce consumer satisfaction? To answer this question, a questionnaire-based study
was conducted in two countries with emerging economies: Romania and Moldova. One of the
countries (Romania) is a member of the European Union, while Moldova is not a member of
the European single market.
The methodological approach involved defining 11 main research hypotheses that take
into account the possible factors influencing e-commerce satisfaction and 4 additional
hypotheses regarding the impact of demographic factors. The study also took into account
the analysis of the differences between the influencing factors in the 2 emerging countries.
For the scientific investigation, multiple linear regression, multivariate analysis of
variance and correlations were used, both at the level of the entire group of respondents and
individually on each country. The results showed that there is a group of influencing factors
at the level of the whole sample, while things are different at the country level.
Based on the factual findings of this research, managerial implications that are useful for
the owners and administrators of e-commerce stores are outlined with arguments and on a
scientific basis. In summary, the general framework of the research carried out in this article
contains the following defining elements:
(1) Introduction: the general context of the research, the research gap and the research
question;(2) Literature review: a solid analysis based on about 50 references about the factors The
influencing e-commerce satisfaction; satisfaction of
(3) The context of e-commerce in the two analyzed countries (Romanian and Moldova); e-commerce
(4) Research hypotheses: the technical description of the main and additional research consumers
hypotheses, based on research question and previous research results in the
literature;
(5) Sample and instruments: the description of the sample;
(6) Results: the description of the results obtained in the analysis;
(7) Discussion: the presentation of the results comparing to the others from the existing
literature. Also, in this section, the managerial implications are presented.
(8) Conclusions: the main findings, the limitations of the research and the future research
directions.
This article is organized as follows: introduction and literature review, materials and
methods, results, discussions and conclusions.
1.2 Literature review
Numerous studies have been conducted by researchers who wanted to analyze the factors
influencing e-commerce satisfaction. Thus, Nisarz and Prabhakar (2017) shows that the USA
consumers are very concerned with the quality of electronic services and after sales services.
In Vietnam, according to Phuong and Trang (2018), the repurchasing decision is significantly
influenced by the existence of in-app after sales services.
In the context of the transition from e-commerce to social commerce (Huang and
Benyoucef, 2013), users are increasingly interested in the possibility of receiving regular
notifications from the merchant system, so that they are up to date with the status of the
orders. Studies conducted by Sulastri et al. (2019) have shown that the existence of a periodic
notification system can have a positive effect on customer retention by the trader. Push
notification Kumar and Johari (2015) are considered to be a business enhancement technique
for e-commerce in the global information world.
From the beginning of e-commerce, customers have been interested in as many features as
possible and the ability to have control over the delivery process. Lightner (2004) shows that
the possibility to cancel an order in an e-commerce application is a functionality of great
importance for the consumer. This functionality also has an impact on any payments already
made on the account of that order Banerjee and Karforma (2008), so as to ensure the quality
management (Zuo et al., 2013).
In China, according to Siraj et al. (2020), buyers attach greater importance to issues such as
live chat rooms and the existence of live chat support. Research in Finland (Relas, 2019) shows
that e-commerce customers are even interested in real consultancy packages offered by the
trader, the existence of which is highly appreciated. Through a live chat system (Elmorshidy,
2013), the consumer has the perception of a rehumanized relationship with the seller due to
the fact that he receives real-time feedback from a real person. Some studies (Danaiața et al.,
2013) point out that the flow of information is also important for consumers of services
provided by public institutions.
The satisfaction perceived by e-commerce consumers is determined by a combination of
factors. Among these factors, Bressolles and Durrieu (2011) show that the existence of a price
comparison system can positively influence users’ perception by improving the navigation
process within the list of available offers. According to Choi et al. (2019), online shopping
malls customers in China can save significant time by using tools that make it easier for themK to compare prices between different products. In the context of growing competition between
sellers, the existence of a price comparator can provide a competitive advantage for small
enterprises (Consoli, 2017), which can attract customers through this method and optimize
their internal processes (Munteanu and Ştefaniga, 2018) and competitiveness (Niţu and
Feder, 2012).
The experience of e-commerce consumers also depends to a large extent on the
experiences of previous consumers. The impact on online satisfaction is also determined by
the existence of reviews from previous customers, as some general research shows (Park and
Lee, 2009; Anastasiei and Dospinescu, 2018; Lopes et al., 2020; D’Acunto et al., 2020) and by
Ventre and Kolbe (2020) in the case of Mexico. A recent study (Tobon and Garcıa-Madariaga,
2021) conducted in Spain revealed that word-of-mouth elements in the online environment
influence the e-commerce satisfaction perceived by consumers.
According to Khalid et al. (2018), the satisfaction of e-commerce participants in Saudi
Arabia is significantly influenced by security and the existence of diversified e-payment
methods. The research conducted by Rasli et al. (2018) also shows that in Malaysia,
alternative payment methods implemented by e-commerce sites are appreciated. Along the
same lines, it was found that buyers of insurance products in Nigeria are aware of the
existence of diversified payment methods when purchasing such products through
e-commerce sites (Isimoya et al., 2018). In Thailand, it has even analyzed the factors that
determine the reuse of e-payment in e-commerce transactions (Ladkoom and Thanasopon,
2020), concluding that the dissemination of alternative payment methods can contribute to
e-commerce satisfaction.
Technological developments in the last decade have imposed new models in terms of the
technologies used by e-commerce sites. Thus, the ease of use of the web platform is an
extremely important criterion for the end consumer, given that most applications migrate to
the cloud (Vijai and Nivetha, 2020; Lula et al., 2021). In the same vein, Ahmad and Khan (2017)
found that Indian consumers are receptive to the ease of use of web platforms when accessing
e-commerce services. The result obtained by Phuong and Trang (2018) also shows that
factors such as system quality and service quality are key determinants for Vietnamese
consumers and have a significant influence on the repurchasing decision.
Recent studies (Rasli et al., 2018) show that in Malaysia, the options for delivering products
to the final customer are a determining factor in terms of purchasing decision and satisfaction
perceived by e-commerce consumers. Based on the official sites (IT Galaxy, 2021), in Romania
some of the online merchants offer customers the open box delivery option, thus increasing the
degree of trust between the final customer, the carrier and the initial supplier. This option can
be included by default in the cost of the online order, or it can be an additional option that
requires an additional cost from the buyer.
The e-commerce world has become increasingly competitive and is trying to reach the
consumer through various approaches. Such a specific approach involves the product
customization feature (Pallant et al., 2020) which is becoming increasingly common among
e-commerce vendors. One of the industries that is best suited to customizing customer
preferences is the fashion industry (Guercini et al., 2018), which has seen a significant shift
from the physical store to the virtual store in recent years. According to Bourlakis et al. (2018),
the product customization feature even leads to the remodeling of B2B activities in the new
e-commerce context. These features enrich consumers’ experience (Dospinescu and Buraga,
2021; Tangchaiburana and Techametheekul, 2017) through audio and video channels,
bringing them closer to the product they want to buy. According to Mashud et al. (2021), the
customization of the product is also in a strong relationship with the product lifecycle, so it is a
very important aspect both for the company and customers.
All the companies operating in the e-commerce area want to increase customer loyalty and
increase their specific market share (Agheorghiesei and Ineson, 2011; Danaiaţa andKirakosyana, 2014). In the Czech Republic, a study conducted by Tahal (2014) revealed that The
e-commerce loyalty programs have a significant impact on the young adult population. This is satisfaction of
especially true when it comes to instant reward, while cumulative reward schemes do not
have the expected success of traders. On the other hand, the study conducted by Ieva and
e-commerce
Ziliani (2017) shows that there are five distinct segments of consumers in terms of preferences consumers
for e-commerce loyalty programs. To attract and retain customers, e-commerce vendors also
use loyalty programs integrated into social media platforms (He et al., 2019). Thus, the
participants in e-commerce processes are integrated in complex information ecosystems,
where the consumer’s perception is influenced by a variety of channels and methods
(Tahal, 2014).
1.3 E-commerce context in Romania and Moldova
For the purpose of this study, the authors have chosen two countries (Romania and Moldova)
whose economies are emerging and which have both common elements and differentiating
aspects. The common element is the fact that the inhabitants of the two countries speak the
same language, and the differentiation is determined by the fact that Romania is a member of
the European Union, while Moldova does not belong to the European Union. Moreover, the
two countries were at one time part of the same country. In the period 1859–1944, the territory
of the Republic of Moldova was incorporated in the territory of Romania. The two countries
have both a common history and periods of time that have left their mark on the
differentiation of the population from a linguistic, cultural and economic point of view.
Romania has a population of about 20 million, while Moldova has about 4 million inhabitants.
Official studies reveal big potential for both countries in terms of the evolution of e-commerce
value indicators. In Moldova, the revenue in the e-commerce market is projected to reach
US$148m in 2021 (Statista. eCommerce Moldova. Statista.com, 2020). The revenue is expected
to show an annual growth rate (period 2021–2025) of 12.4%, resulting in a projected market
volume of US$237m by 2025. The market’s largest segment is Fashion with a projected
market volume of US$47m in 2021. User penetration will be 34.2% in 2021 and is expected to
hit 38.9% by 2025. The average revenue per user (ARPU) is expected to amount to US$107.70.
In the case of Romania, the same forecasts (Statista. eCommerce Romania. Statista.com,
2020) estimate that the revenue in the e-commerce market is projected to reach US$5,200m in
2021. Revenue is expected to show an annual growth rate (CAGR, 2021–2025) of 9.3%,
resulting in a projected market volume of US$7,421m by 2025. Fashion is the market’s largest
segment, with a projected market volume of US$1,135m in 2021. User penetration will be
48.1% in 2021 and is expected to hit 56.7% by 2025. The ARPU is expected to amount to
US$308.26. There are no less than 8.34 m e-commerce users in Romania and their number is
growing year by year.
The authors note that all value indicators are growing for both countries, suggesting a
sustainable growth potential of the e-commerce market in the next 5 years.
2. Materials and methods
2.1 Research hypotheses
The aim of this research is to highlight the influence of different factors on the satisfaction
perceived by e-commerce consumers in Romania and Moldova, by analyzing the following 11
indicators: the existence of in-app after sales services, the existence of a periodic notification
system regarding the status of order, the possibility to cancel an order, the existence of a live
consultant support, the existence of a price comparison feature, the existence of reviews from
previous customers, the diversity of payment methods, the ease of use of the web platform,
the option to open the package on delivery, the existence of a feature for product
customization and the existence of loyalty programs for the customers.K Considering the results obtained in the previous researches from the specialized literature,
the authors formulate the following research hypotheses in Table 1.
In addition to these research hypotheses, the authors will also consider potential
differentiations depending on various demographic factors such as: country of residence,
gender, education level and area of residence (rural vs urban). Given these demographic
characteristics, the following additional research hypotheses were formulated, according to
Table 2.
Hypothesis Hypothesis description Previous research
H1 The existence of in-app after sales services has Nisarz and Prabhakar (2017), Phuong and
a significant impact on e-commerce Trang (2018)
satisfaction level
H2 The existence of periodic notification system Huang and Benyoucef (2013), Sulastri et al.
has a significant impact on e-commerce (2019), Kumar and Johari (2015)
satisfaction level
H3 The possibility to cancel the order in a Lightner (2004), Banerjee and Karforma
e-commerce application has a significant (2008), Zuo et al. (2013)
impact on e-commerce satisfaction level
H4 The existence of live consultant support has a Siraj et al. (2020), Relas (2019), Elmorshidy
significant impact on e-commerce satisfaction (2013)
level
H5 The existence of price comparators has a Bressolles and Durrieu (2011), Choi et al.
significant impact on e-commerce satisfaction (2019), Consoli (2017)
level
H6 The existence of the reviews from previous Park and Lee (2009), Anastasiei and
customers has a significant impact on Dospinescu (2018), Lopes et al. (2020);
e-commerce satisfaction level D’Acunto et al. (2020), Ventre and Kolbe (2020)
H7 The diversity of payment methods has a Khalid et al. (2018), Rasli et al. (2018), Ladkoom
significant impact on e-commerce satisfaction and Thanasopon (2020)
level
H8 The ease of use of the web platform has a Nisarz and Prabhakar (2017), Phuong and
significant impact on e-commerce satisfaction Trang (2018), Vijai and Nivetha (2020), Lula
level et al. (2021), Ahmad and Khan (2017)
H9 The existence of package opening on delivery Rasli et al. (2018), eMAG (2021), ITGalaxy
option has a significant impact on e-commerce (2021)
satisfaction level
H10 The product customization feature has a Pallant et al. (2020), Guercini et al. (2018),
significant impact on e-commerce satisfaction Bourlakis et al. (2018)
level
Table 1. H11 The existence of loyalty programs has a Tahal (2014), Ieva and Ziliani (2017), He et al.
The main research significant impact on e-commerce satisfaction (2019)
hypothesis level
Hypothesis Hypothesis description
H1a The e-commerce satisfaction level differs according to country of residence
Table 2. H2a The e-commerce satisfaction level differs according to gender
The additional H3a The e-commerce satisfaction level differs according to education level
research hypothesis H4a The e-commerce satisfaction level differs according to the zone of residence (rural/urban)2.2 Sample and instruments The
In order to conduct the research, a questionnaire was completed and it was applied to a satisfaction of
number of 450 respondents from Romania and Moldova. Of the questionnaires applied, 51
were invalid (incomplete questionnaires or respondents who do not use e-commerce). 399
e-commerce
valid questionnaires were recorded, out of which 206 for the respondents from Romania and consumers
193 for the respondents from Moldova. All respondents were between 18 and 35 years old
because the authors wanted to investigate mainly the group that uses modern information
technologies intensively. The respondents were selected from the applicants and graduates of
a university that has educational centers both in Romania and Moldova. Respondents were
not remunerated for their efforts to complete the questionnaires.
Regarding the representativeness of the sample, for the calculation of the minimum
sample the RaoSoft tool (http://www.raosoft.com/samplesize.html) was used. Considering
that the total population of the 2 countries (Romania and Moldova) is approximately 24
million inhabitants, the minimum required population is 385 respondents. This minimum
sample was calculated for a confidence level of 95%. According to (Cochran, 1977), the
minimum sample size is determined by using three variables: the population proportion (π ),
the precision level (D) and the confidence interval. The formula is presented below:
π ð1 π ÞZ 2
n¼ ;
D2
Where:
(1) π 5 population proportion;
(2) D 5 precision level (marginal error)
(3) Z 5 z-value for confidence level.
In our case, taking into consideration the demographic data of the two analyzed countries, the
population proportion was set at 40%, the precision level at 5% and the confidence interval at
95%. The corresponding z-value for the 95% confidence level is 1.96. Based on the Cochran
formula, the value of the minimum calculated sample size is n 5 369.
Given the previous results (Cohran, 1977), it is obvious that our sample of 399 respondents
is representative of the cumulative population of the two countries.
From a demographic point of view, the situation of the sample is as follows: 51.63% of
respondents are from Romania and 48.37% are from Moldova. In terms of gender, 75.68% are
females and 24.32% are males. Depending on the area of residence, 79.44% are from urban
areas and 20.56% are from rural areas. Among the respondents, 50.38% are high school
graduates, and 49.62% are university graduates.
The questionnaire was applied between May and September 2020, and it consisted of
questions aimed at quantifying the perceived level of e-commerce consumer satisfaction, as well
as the importance of factors influencing satisfaction. A five-point Likert scale with the following
value meanings was used for the questions: value 1 indicates that the variable has no influence
on e-commerce satisfaction, while value 5 indicates that the consumer has a very high level of
expectation regarding that indicator. In addition to the questions related to the e-commerce
satisfaction level, the questionnaire also contained 4 questions about the demographic aspects:
country of residence, education level, area of residence (rural/urban), gender.
The internal consistency of the questionnaire was tested by calculating the Cronbach’s
alpha indicator, whose value is 0.670. Alpha is the indicator that provides the measure of
internal consistency reliability; a value greater than 0.60 indicates an acceptable level of
reliability (Wim et al., 2008; Shrout, 1998). The data analysis was performed with IBM SPSS
Statistics version 21, and the answers received in the questionnaire are described through
descriptive statistics (average value and SD).K The main research hypotheses were analyzed and tested by Pearson correlation and
multiple linear regression. Multivariate analysis of variance and multiple linear regression
analysis were used to test the additional hypotheses.
3. Results
Following the analysis of the data obtained from the respondents, Table 3 shows the
descriptive statistics values for the independent variables and the e-commerce level of
satisfaction. As it can be seen, the results show that the respondents in the analyzed sample
consider that e-commerce level of satisfaction is greatly affected by the availability of various
payment methods (M 5 4.78), the existence of live support consultant (M 5 4.66), of loyalty
programs (M 5 4.60) and the existence of reviews from the previous customers (M 5 4.39).
Also, low level e-commerce satisfaction is associated with ease of use of web platform
(M 5 2.67), open box delivery option (M 5 3.02) and the existence of in-app after sales
services (M 5 3.63).
In the scientific approach to identify the relationships between the dependent variable and
the independent factors, the authors proceeded to test the multicollinearity for the
explanatory variables. The results of this test indicate that the proposed model is relevant
because all VIF (variance inflator factor) values are less than 5 (Salmeron and Garcia, 2018;
Daoud, 2017) and the data from Table 4.
Variable Sample size Mean Std. deviation N
ECommerceSatisfactionLevel 399 4.54 0.58 399
InAppAfterSalesServices 399 3.63 1.14 399
PeriodicNotificationSystem 399 4.11 0.66 399
PossibilityToCancelTheOrder 399 4.19 0.64 399
LiveConsultantSupport 399 4.66 0.69 399
ExistingPriceComparator 399 4.31 0.47 399
ExistingPreviousReviews 399 4.39 0.73 399
Table 3. VariousPaymentMethods 399 4.78 0.52 399
The values of the EaseOfUseOfWebPlatform 399 2.67 1.37 399
descriptive statistics PackageOpeningOnDelivery 399 3.02 1.23 399
for the analyzed ProductCustomization 399 4.35 0.49 399
variables LoyaltyPrograms 399 4.60 0.54 399
Collinearity statistics
Variable Tolerance VIF
InAppAfterSalesServices 0.856 1.168
PeriodicNotificationSystem 0.478 2.092
PossibilityToCancelTheOrder 0.662 1.510
LiveConsultantSupport 0.805 1.242
ExistingPriceComparator 0.540 1.852
ExistingPreviousReviews 0.664 1.507
Table 4. VariousPaymentMethods 0.688 1.453
The values of the EaseOfUseOfWebPlatform 0.828 1.208
collinearity statistics PackageOpeningOnDelivery 0.837 1.194
for the model’s ProductCustomization 0.777 1.288
variables LoyaltyPrograms 0.644 1.553VIF values indicate very clearly that in our model there is no multicollinearity The
phenomenon. Given this premise, the authors proceeded to the detailed statistical analysis of satisfaction of
the data obtained from the questionnaire.
For testing the H1–H11 research hypotheses, the multiple linear regression analysis was
e-commerce
used to predict the dependent variable (e-commerce satisfaction level) based on the set of consumers
independent variables: the existence of in-app after sales services, the existence of a periodic
notification system about the order status, the possibility to cancel an order from the
application, the existence of live support consultant, the reviews from previous customers, the
existence of a price comparison feature, the possibility to pay with various methods, the ease
of use of the web platform, the open box delivery option, the existence of product
customization feature and the existence of the loyalty programs. In Table 5 the ANOVA
values for the proposed model are shown.
As it can be seen, it is obvious that a set of variables are statistically significant for
predicting the dependent variable (F 5 145.02, p < 0.01). Also, it is important to note that
Adjusted R Square has a value of 0.799.
By applying linear multiple regression analysis, the data in Table 6 was obtained. All
variables were included in the analysis and, by using the enter method, all the factors started
with the same initial value.
The data obtained from multiple linear regression analysis indicate some important
aspects that are valid throughout the sample. Thus, of the 11 variables analyzed, only 8
proved to be statistically significant, while 3 of them (in-app after sales services, the
possibility to cancel the order and live consultant support) did not have a significant influence
within the global sample for respondents from Romania and Moldova.
From the analysis of Beta coefficients it can be seen that the possibility to pay by various
methods is the most important factor influencing e-commerce satisfaction, acting in a positive
direction (B 5 0.435). E-commerce customers from the two analyzed countries want to have
various payment options for the purchases they make in e-stores. In terms of importance, the
next factor that matters to customers is the existence of a periodic notification system
Sum of squares Df Mean square F Sig
Regression 108.76 11 9.89 145.02 0.00
Residual 26.39 387 0.07 Table 5.
Total 135.15 398 ANOVA values
Independent variables Standardized beta Std. error t Sig
InAppAfterSalesServices 0.045 0.012 1.840 0.067
PeriodicNotificationSystem 0.239*** 0.029 7.358 0.000
PossibilityToCancelTheOrder 0.001 0.025 0.024 0.980
LiveConsultantSupport 0.046 0.021 1.847 0.066
ExistingPriceComparator 0.134*** 0.038 4.368 0.000
ExistingPreviousReviews 0.125*** 0.022 4.537 0.000
VariousPaymentMethods 0.435*** 0.030 16.068 0.000
EaseOfUseOfWebPlatform 0.071*** 0.010 2.875 0.004 Table 6.
PackageOpeningOnDelivery 0.082*** 0.012 3.354 0.001 The values of the
ProductCustomization 0.227*** 0.030 8.914 0.000 coefficients in the
LoyaltyPrograms 0.159*** 0.030 5.686 0.000 multivariate linear
Note(s): * Significant at the level 10%, ** significant at the level 5%, *** significant at the level 1% regression modelK regarding the order status (B 5 0.239). The authors also note that all other independent
variables have a positive influence on the perception of e-commerce satisfaction. Thus,
customers are interested in the possibility of product customization (B 5 0.227), loyalty
programs (B 5 0.159), the existence of a price comparison feature (M 5 0.134), the existence of
previous reviews (B 5 0.125). The statistically significant variables, but of less importance,
are ease of use of the web platform (B 5 0.071) and the package opening on delivery
option (B 5 0.082).
Considering the results obtained from the scientific analysis, the authors conclude that
hypotheses H2, H5, H6, H7, H8, H9, H10, H11 are validated for Romania and Moldova, which
means that the correlations are confirmed for the variables: periodic notification system, price
comparison feature, the existence of previous reviews, various methods of payment, ease of
use of the web platform, open box delivery option, product customization feature and loyalty
programs.
At the same time, for the cumulated population in Romania and Moldova, hypotheses H1,
H3 and H4 are not confirmed. This means that, from a statistical point of view, the following
variables are not significant for consumers’ perception of e-commerce satisfaction: in-app
after sales services, the possibility to cancel an order and the existence of live chat support.
To test the additional hypotheses that were described in Table 2, the authors performed a
multivariate analysis of variance. Through this scientific approach, the authors wanted to
analyze how customers’ perception on e-commerce satisfaction depends on demographic
variables: country of residence, gender, education level, area of residence. The complete
results of the multivariate analysis of variance are presented in detail in Table 7.
Based on the data obtained from multivariate analysis of variance, the authors conclude
that the country of residence (H1a) differentiates customers’ perception on e-commerce
satisfaction. This result suggests that independent variables may have differentiated
importance and values for the populations of the two analyzed countries. The biggest
differences between Romania and Moldova are reflected in the variables: periodic notification
system (F 5 6,270, p < 0.05), the existence of a price comparison tool (F 5 17,836, p < 0.01),
ease of use of the web platform (F 5 3.572, p < 0.10), open box delivery option (F 5 35.521,
p < 0.01) and the existence of loyalty programs (F 5 10.680, p < 0.01). Also, significant
differences are manifested only partially in the case of two other socio-demographic
variables: education level (H3a) and gender (H2a). It is important to note that the analysis
conducted by the authors shows that there are no significant differences determined by areas
of residence (rural vs urban) in terms of the perception on e-commerce satisfaction for users in
the two countries.
Given the scientific data obtained in Table 7, the authors conclude that the hypothesis H1a
is confirmed, while the hypotheses H2a and H3a are partially confirmed. Also, the H4a
hypothesis is not confirmed.
In order to highlight the differences between the respondents from the two countries,
multiple linear regression analysis was performed on each group. The detailed results of this
analysis are presented in Table 8.
Data show that the e-commerce satisfaction for the Romania customers can be predicted in
a positive direction based on the existence of periodic notification system (Beta 5 0.333,
p < 0.01), the existence of reviews from previous customers (Beta 5 0.1717, p < 0.01), the
various payment methods (Beta 5 0.277, p < 0.01), the ease of use of web platform
(Beta 5 0.113, p < 0.01) and product customization features (Beta 5 0.347, p < 0.01).
Regarding the Moldovan respondents, it can be noted that there are several factors that
influence e-commerce satisfaction. Thus, the variables that have a significant influence are
the existence of periodic notification system (Beta 5 0.158, p < 0.01), live consultant support
(Beta 5 0.059, p < 0.05), the price comparison feature (Beta 5 0.225, p < 0.01), previous
reviews (Beta 5 0.223, p < 0.01), various methods of payment (Beta 5 0.531, p < 0.01), openSource/Variable df F Sig
The
satisfaction of
Country InAppAfterSalesServices 1 0.056 0.813 e-commerce
PeriodicNotificationSystem* 1 6.270 0.013
PossibilityToCancelTheOrder 1 0.007 0.932 consumers
LiveConsultantSupport 1 0.488 0.485
ExistingPriceComparator*** 1 17.836 0.000
ExistingPreviousReviews 1 1.619 0.204
VariousPaymentMethods 1 1.971 0.161
EaseOfUseOfWebPlatform* 1 3.572 0.060
PackageOpeningOnDelivery*** 1 35.521 0.000
ProductCustomization 1 0.433 0.511
LoyaltyPrograms*** 1 10.680 0.001
Gender InAppAfterSalesServices 1 0.289 0.591
PeriodicNotificationSystem 1 1.099 0.295
PossibilityToCancelTheOrder** 1 6.717 0.010
LiveConsultantSupport 1 0.477 0.490
ExistingPriceComparator*** 1 9.028 0.003
ExistingPreviousReviews*** 1 32.471 0.000
VariousPaymentMethods 1 2.732 0.099
EaseOfUseOfWebPlatform 1 0.001 0.978
PackageOpeningOnDelivery** 1 4.093 0.044
ProductCustomization 1 2.224 0.137
LoyaltyPrograms 1 1.437 0.231
RuralUrban InAppAfterSalesServices 1 3.338 0.068
PeriodicNotificationSystem 1 0.682 0.410
PossibilityToCancelTheOrder 1 1.070 0.302
LiveConsultantSupport 1 0.071 0.790
ExistingPriceComparator 1 2.459 0.118
ExistingPreviousReviews 1 0.136 0.712
VariousPaymentMethods 1 1.298 0.255
EaseOfUseOfWebPlatform 1 1.073 0.301
PackageOpeningOnDelivery** 1 6.663 0.010
ProductCustomization 1 0.022 0.883
LoyaltyPrograms 1 0.001 0.978
EducationLevel InAppAfterSalesServices** 3 3.433 0.017
PeriodicNotificationSystem 3 1.925 0.125
PossibilityToCancelTheOrder*** 3 5.043 0.002
LiveConsultantSupport 3 1.011 0.388
ExistingPriceComparator** 3 2.846 0.037
ExistingPreviousReviews*** 3 6.738 0.000
VariousPaymentMethods 3 2.312 0.076
Table 7.
EaseOfUseOfWebPlatform 3 1.682 0.170
Predictors and their
PackageOpeningOnDelivery 3 1.143 0.332 contributions to the
ProductCustomization 3 0.332 0.802 explanation of the
LoyaltyPrograms 3 1.748 0.157 dependent variables of
Note(s): * Significant at the level 10%, ** significant at the level 5%, *** significant at the level 1% the model
box delivery option (Beta 5 0.085, p < 0.01), product customization features (Beta 5 0.083,
p < 0.01) and the existence of loyalty programs (Beta 5 0.210, p < 0.01).
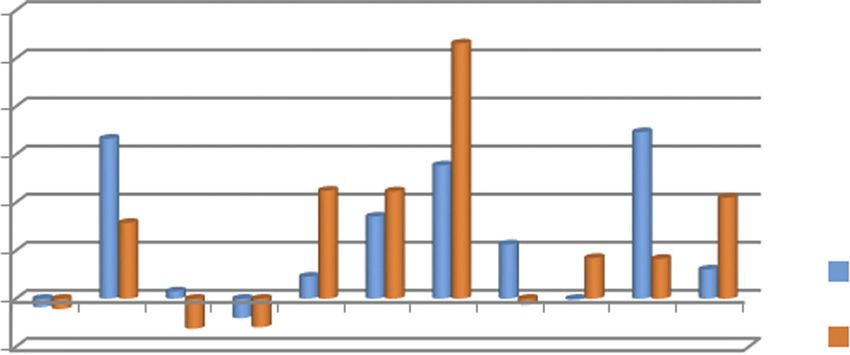
A synthetic image of the situation of the values of the coefficients from multiple linear
regression models that were obtained as a result of multivariate analysis of variance is
presented in Figure 1, for each country.K Standardized beta Standardized beta
Independent variable coefficients for Romania Sig coefficients for Moldova Sig
InAppAfterSalesServices 0.017 0.619 0.022 0.464
PeriodicNotificationSystem 0.333*** 0.000 0.158*** 0.000
PossibilityToCancelTheOrder 0.015 0.693 0.062 0.095
LiveConsultantSupport 0.040 0.279 0.059** 0.035
ExistingPriceComparator 0.046 0.240 0.225*** 0.000
ExistingPreviousReviews 0.171*** 0.000 0.223*** 0.000
VariousPaymentMethods 0.277*** 0.000 0.531*** 0.000
EaseOfUseOfWebPlatform 0.113*** 0.001 0.012 0.693
Table 8.
Regression analysis for PackageOpeningOnDelivery 0.003 0.943 0.085*** 0.006
e-commerce ProductCustomization 0.347*** 0.000 0.083*** 0.006
satisfaction in LoyaltyPrograms 0.061 0.143 0.210*** 0.000
Romania vs Moldova Note(s): * Significant at the level 10%, ** significant at the level 5%, *** significant at the level 1%
0.600
0.500
0.400
0.300
0.200
0.100
Romania
0.000
–0.100 Moldova
lty iza .
Va ngP eCo upp ..
ya m iv..
od ni la s
og n
m
C nS es
s
eO W eth s
tC On rm
Pa ofU ym Rev or
r.
Ea us vio pa t
Pr pe bP od
m
Pr tio
ck se en iew
rio re m or
is ns ce te
is Pri ntS O
Figure 1.
se Pa us rat
Li yTo tio rvic
Lo sto el
uc ng tfo
ra
Ex ing ulta The
Ex Co an ys
D
Differences in the
a e
ag of tM
ib tif sS
l
expected e-commerce
e
ss No ale
u
ilit ic
satisfaction in terms of
Po dic rS
c
rio fte
the analyzed
Pe ppA
ve
independent variables
ti
t
A
In
(Romania vs Moldova)
The obtained models that are based on multiple linear regression confirm that there are
significant differences in the importance of independent variables that determine the
perception of e-commerce satisfaction.
4. Discussion
Based on the results obtained from the research, the authors highlight some important aspects.
First, it is noted that the factors influencing e-commerce satisfaction in the entire analyzed
sample are different from the factors influencing consumers in each country. Thus, at the level
of consumers in both countries, research hypotheses were validated, that certify that
e-commerce consumer satisfaction is significantly influenced by the existence of periodic
notification system, the existence of a price comparison tool, the existence of reviews from
previous customers, the possibility to use different payment methods, the ease of use of the web
platform, the open box delivery option, the existence of product customization feature and the
loyalty programs. At the level of the analyzed population in Romania and Moldova, this
research confirms the partial results from the literature highlighted previously (Huang and
Benyoucef, 2013; Sulastri et al., 2019; Kumar and Johari, 2015; Bressolles and Durrieu, 2011;Choi et al., 2019; Consoli, 2017; Park and Lee, 2009; Anastasiei and Dospinescu, 2018; Lopes The
et al., 2020; D’Acunto et al., 2020; Ventre and Kolbe, 2020; Khalid et al., 2018; Rasli et al., 2018; satisfaction of
Ladkoom and Thanasopon, 2020; Vijai and Nivetha, 2020; Lula et al., 2021; Ahmad and Khan,
2017; eMAG, 2021; ITGalaxy, 2021; Pallant et al., 2020; Guercini et al., 2018; Bourlakis et al., 2018;
e-commerce
Tahal, 2014; Ieva and Ziliani, 2017; He et al., 2019). At the same time, this research refutes some consumers
aspects found in previous research (Nisarz and Prabhakar, 2017; Phuong and Trang, 2018;
Lightner, 2004; Banerjee and Karforma, 2008; Zuo et al., 2013; Siraj et al., 2020; Relas, 2019;
Elmorshidy, 2013). Based on these results, the managerial implications for e-commerce
companies aiming to uniquely address consumers in Romania and Moldova are related to the
decisions of marketing and sales managers who must allocate budgets and resources to
improve the eight aspects highlighted above. Also, the e-commerce companies should not
allocate resources for the implementation of functionalities such as in-app after sales services,
the possibility to cancel an order or the live consultant support feature, because these aspects do
not influence the satisfaction of e-commerce consumers in Romania and Moldova.
On the other hand, referring only to Romania, the consumers in this country are sensitive
to factors such as the existence of periodic notification system, the reviews from previous
customers, the possibility to use different payment methods, the ease of use of the web
platform and the product customization feature. These results refute some previous partial
research (Nisarz and Prabhakar, 2017; Phuong and Trang, 2018; Kumar and Johari, 2015;
Lightner, 2004; Banerjee and Karforma, 2008; Zuo et al., 2013; Siraj et al., 2020; Relas, 2019;
Elmorshidy, 2013; Bressolles and Durrieu, 2011; Choi et al., 2019; Consoli, 2017; eMAG, 2021;
ITGalaxy, 2021; Tahal, 2014; Ieva and Ziliani, 2017; He et al., 2019). Thus, e-commerce
companies that want to focus on the Romanian market do not have to allocate resources for
aspects such as in-app after sales services, the live consultant support, price comparison tools
or loyalty programs.
With regard to Moldova consumers, our research highlighted the following factors
influencing e-commerce satisfaction: the existence of the periodic notification system, the
existence of live chat support, the price comparison tools, the existence of previous reviews,
the various payment methods, the product customization features and loyalty programs. As a
result of the research results, the recommendation for marketing managers is to focus on
these issues and not allocate resources for in-app after sales services, the possibility to cancel
an order and the ease of use of the web platform.
5. Conclusions
The need to analyze the connections between the level of satisfaction of e-commerce users and
various factors of influence is justified by the fact that e-commerce is an area which has
grown significantly in the last decade. Moreover, the beneficiaries of e-commerce are different
in terms of behavior from one country to another, as well as in terms of profile. Statistics show
that the number of e-commerce users is constantly growing in both Romania and Moldova,
which means that marketing managers must be very attentive to the individual and group
needs of consumers and to specific stimuli that can improve overall satisfaction of customers.
The research conducted and the results obtained show that there is a differentiation of the
factors that influence the level of satisfaction of e-commerce users. Thus, the following factors
are significant for the Romanian users: the periodic notification system, the existence of
previous reviews, the various methods of payments, the ease of use of the web platform and
the possibility of product customization. Moldovan e-commerce customers are sensitive to the
following factors: the periodic notification system, the existence of live support consultant,
the existence of a price comparison tool, the existence of reviews from previous customers, the
various methods of payments, the open box delivery option, the possibility of product
customization and the existence of loyalty programs.K Regarding the limitations of the research, they can be identified based on the used
methodology. The current research is limited in terms of population studied to only two
countries: Romania and Moldova. Even if Romania is part of the European Union, unlike
Moldova, the authors consider that this is a limitation of the current research. Also, although
the study is intended to be exhaustive by analyzing no less than 11 factors influencing the
satisfaction generated by e-commerce, it is still limited to this group of representative factors.
The fact that the sample of respondents includes only people aged between 18 and 35 is
another limitation of the research because these results can be interpreted with scientific
precision only for this range. Another limitation has to do with the limited number of
demographic variables included herein; for example, this analysis did not include a variable
to measure the income level of the respondents.
Although the article has a number of objective limitations, based on the research carried
out and the results obtained, at least four future directions of research can be identified. The
first direction is to include several countries in the analysis so as to obtain a regional picture
about the influencing factors of e-commerce customer satisfaction. The second future
direction of research involves extending the analysis to other age groups to highlight the
differences that manifest themselves by age categories. Another direction for the future is the
analysis of the factors influencing e-commerce satisfaction in a broader context of the Internet
of things and services and new emerging IT, starting from the framework proposed by
Al-Momani et al. (2018) and the results obtained by Grubljesic et al. (2019). Finally, the fourth
direction of research would involve an approach that includes in the analysis many factors
influencing the satisfaction generated by e-commerce.
References
Acquila-Natale, E. and Iglesias-Pradas, S. (2020), “How to measure quality in multi-channel retailing
and not die trying”, Journal of Business Research, Vol. 109, pp. 38-48.
Agheorghiesei, D.T. and Ineson, E. (2011), “The impact of online booking systems on customer loyalty
in Romania”, Journal of Tourism, Vol. 11, pp. 45-54.
Ahmad, A. and Khan, M.N. (2017), “Developing a website service quality scale: a confirmatory factor
analytic approach”, Journal of Internet Commerce, Vol. 16 No. 1, pp. 104-126.
Al-Momani, A.M., Mahmoud, M.A. and Ahmad, M.S. (2018), “Factors that influence the acceptance of
internet of things services by customers of telecommunication companies in Jordan”, Journal of
Organizational and End User Computing, Vol. 30 No. 4, pp. 51-63.
Anastasiei, B. and Dospinescu, N.N. (2018), “A model of the relationships between the Big Five
personality traits and the motivations to deliver word-of-mouth online”, Psihologija, Vol. 51
No. 2, pp. 215-227.
Banerjee, S. and Karforma, S. (2008), “A prototype design for DRM based credit card transaction in
e-commerce”, ACM Ubiquity, Vol. 9 No. 18, pp. 1-9.
Bourlakis, M., Julien, D. and Ali, I. (2018), The Next Industrial Revolution: How E-Commerce Is
Transforming B2B, DHL Express, Bonn.
Bressolles, G. and Durrieu, F. (2011), “Service quality, customer value and satisfaction relationship
revisited for online wine websites”, 6th AWBR International Conference, Bordeaux.
Choi, D., Chung, C. and Young, J. (2019), “Sustainable online shopping logistics for customer
satisfaction and repeat purchasing behavior: evidence from China”, Sustainability, Vol. 11
No. 20, p. 5626, doi: 10.3390/su11205626.
Cohran, W.G. (1977), Sampling Techniques, 3rd ed., John Wiley and Sons, New York.
Consoli, D. (2017), “The use of social media and e-commerce: a winning strategy for small businesses”,
North Economic Review, Vol. 1 No. 1, pp. 108-119.D’Acunto, D., Tuan, A. and Dalli, D. (2020), “Are online reviews helpful for consumers? Big data The
evidence from services industry”, in Exploring the Power of Electronic Word-of-Mouth in the
Services Industry, ICI Global, pp. 198-216. satisfaction of
Daoud, J. (2017), “Multicollinearity and regression analysis”, Journal of Physics: Conference Series,
e-commerce
Kuala Lumpur. consumers
Dospinescu, O. and Buraga, S.C. (2021), “A knowledge-based pilot study on assessing the music
influence”, Computers, Materials and Continua, Vol. 66 No. 3, pp. 2857-2873.
Danaiaţa, D. and Kirakosyana, K. (2014), “Communication management in electronic banking. Better
communication for better relationship”, Procedia – Social and Behavioral Sciences, Vol. 124,
pp. 361-370.
Danaiața, D., Margea, G., Hurbean, L. and Artene, A. (2013), “Electronic services for business
environment”, Procedia – Social and Behavioral Sciences, Vol. 124, pp. 351-360.
Elmorshidy, A. (2013), “Applying the technology acceptance and service quality models to live
customer”, Journal of Applied Business Research, Vol. 29 No. 2, pp. 589-595.
eMAG (2021), Opening the Package upon Delivery, Bucharest, available at: https://www.emag.ro/info/
deschiderea-coletului-la-livrare-2 (accessed 14 January 2021).
Geebren, A., Jabbar, A. and Luo, M. (2021), “Examining the role of consumer satisfaction within
mobile eco-systems: evidence from mobile banking services”, Computers in Human Behavior,
Vol. 114, 106584.
Grubljesic, T., Coelho, P.S. and Jaklic, J. (2019), “The shift to socio-organizational drivers of business
intelligence and analytics acceptance”, Journal of Organizational and End User Computing,
Vol. 31 No. 2, pp. 37-64.
Guercini, S., Bernal, P.M. and Prentice, C. (2018), “New marketing in fashion e-commerce”, Journal of
Global Fashion Marketing, Vol. 9 No. 1, pp. 1-8.
He, W., Tian, X. and Wang, F. (2019), “Innovating the customer loyalty program with social media: a
case study of best practices using analytics tools”, Journal of Enterprise Information
Management, Vol. 32 No. 5, pp. 807-823.
Huang, Z. and Benyoucef, M. (2013), “From e-commerce to social commerce: a close look at design
features”, Electronic Commerce Research and Applications, Vol. 12 No. 4, pp. 246-259.
Ieva, M. and Ziliani, C. (2017), “Towards digital loyalty programs: insights from customer medium
preference segmentation”, International Journal of Retail and Distribution Management, Vol. 45
No. 2, pp. 195-210.
Isimoya, O.A., Ajemunigbohun, S.S. and Balogun, M.T. (2018), “Customers’ satisfaction of electronic
payment systems in the purchase of insurance products in Nigeria”, Management and
Marketing, Vol. XVI No. 2, pp. 180-191.
ITGalaxy (2021), Opening the Package upon Delivery, Bucharest, available at: https://www.itgalaxy.ro/
info/comanda-si-livrare/verificarea-coletului-la-livrare (accessed 21 January 2021).
Kalia, P. and Paul, J. (2021), “E-service quality and e-retailers: attribute-based multi-dimensional
scaling”, Computers in Human Behavior, Vol. 115, 106608.
Khalid, A., Lee, O., Choi, M. and Ahn, J. (2018), “The effects of customer satisfaction with e-commerce
system”, Journal of Theoretical and Applied Information Technology, Vol. 96 No. 2, pp. 481-491.
Kumar, A. and Johari, S. (2015), “Push notification as a business enhancement technique for
e-commerce”, 2015 Third International Conference on Image Information Processing (ICIIP),
Waknaghat.
Ladkoom, K. and Thanasopon, B. (2020), “Factors influencing reuse intention of e-payment in
Thailand: a case study of PromptPay”, Proceedings of the 22nd International Conference on
Enterprise Information Systems, ICEIS, Vol. 1.
Lightner, N. (2004), “Evaluating e-commerce functionality with a focus on customer service”,
Communications of the ACM, Vol. 47 No. 10, pp. 88-92.K Lin, X., Wang, X. and Hajli, N. (2019), “Building e-commerce satisfaction and boosting sales: the role of
social commerce trust and its antecedents”, International Journal of Electronic Commerce,
Vol. 23 No. 3, pp. 328-363.
Lopes, A.I., Dens, N., De Pelsmacker, P. and De Keyzer, F. (2020), “Which cues influence the perceived
usefulness and credibility of an online review? A conjoint analysis”, Online Information Review,
Vol. A, doi: 10.1108/OIR-09-2019-0287.
Lula, P., Dospinescu, O., Homocianu, D. and Sireteanu, N.-A. (2021), “An advanced analysis of cloud
computing concepts based on the computer science ontology”, Computers, Materials and
Continua, Vol. 66 No. 3, pp. 2425-2443.
Mashud, A.H.M., Hasan, M.R., Daryanto, Y. and Wee, H.M. (2021), “A resilient hybrid payment
supply chain inventory model for post Covid-19 recovery”, Computers and Industrial
Engineering, Vol. 157, article number 107249.
Munteanu, V. and Ştefaniga, A. (2018), “Lean manufacturing in SMEs in Romania”, Procedia – Social
and Behavioral Sciences, Vol. 238, pp. 492-500.
Nisarz, T. and Prabhakar, G. (2017), “What factors determine e-satisfaction and consumer spending in
e-commerce retailing?”, Journal of Retailing and Consumer Services, Vol. 39, pp. 135-144.
Niţu, R. and Feder, E. (2012), “Entrepreneurial behaviour consequences on small and medium-sized
firms’ innovation”, Theoretical and Applied Economics, Vol. XIX Nos 7(572), pp. 85-96.
Pallant, J., Sands, S. and Karpen, I. (2020), “Product customization: a profile of consumer demand”,
Journal of Retailing and Consumer Services, Vol. 54, 102030.
Park, C. and Lee, T.M. (2009), “Information direction, website reputation and eWOM effect: a
moderating role of product type”, Journal of Business Research, Vol. 62 No. 1, pp. 61-67.
Phuong, N.N.D. and Trang, T.T.D. (2018), “Repurchase intention: the effect of service quality, system
quality, information quality, and customer satisfaction as mediating role: a PLS approach of
M-commerce ride hailing service in Vietnam”, Marketing and Branding Research, Vol. 5 No. 2,
pp. 78-91.
Rasli, S., Khairi, N., Ayathuray, H. and Sudirman, M. (2018), “The effect of e-business website quality
on customer satisfaction”, Selangor Business Review, Vol. 3 No. 1, pp. 37-45.
Relas, K. (2019), Redefining Consultation Packages for the Ecommerce Service Offering: In a Digital
Marketing Software as a Service Company, Helsinki Metropolia University of Applied Sciences,
Helsinki.
Salmeron, R. and Garcia, C. (2018), “Variance inflation factor and condition number in multiple
linear regression”, Journal of Statistical Computation and Simulation, Vol. 88 No. 12,
pp. 2365-2384.
Shrout, P. (1998), “Measurement reliability and agreement in psychiatry”, Statistical Methods in
Medical Research, Vol. 7 No. 3, pp. 301-317.
Siraj, A., Guo, J., Kamran, W., Li, Q. and Zhu, Y. (2020), “Characteristics for e-satisfaction in e-retailing
– evidence from Chinese e-commerce”, International Journal of Innovation, Creativity and
Change, Vol. 12 No. 5, pp. 370-393.
Statista (2020), eCommerce Moldova. Statista.com, London.
Sulastri, H., Setiyuni, P.E., Rahmatulloh, A. and Sanjiwani, N.M.K. (2019), “The effect of implementing
web push notification and customer relationship management in e-commerce of silver craft
MSME”, Proceedings of the Sriwijaya International Conference on Information Technology and
Its Applications (SICONIAN 2019).
Tahal, R. (2014), “Loyalty programs in e-commerce and their perception by the young adult internet
population”, Central European Business Review, Vol. 3 No. 2, pp. 7-13.
Tangchaiburana, S. and Techametheekul, K.W. (2017), “Development model of web design element for
clothing e-commerce based on the concept of mass customization”, Kasetsart Journal of Social
Sciences, Vol. 38 No. 3, pp. 242-250.You can also read